Monetary Policy Review
September 2010
The Monetary Policy Review (MPR) is published monthly by Bank Indonesia after the Board of Governors» Meeting each February, March, May, June, August, September, November, and December. This report is intended as a medium for the Board of Governors of Bank Indonesia to present to the public the latest evaluation of monetary conditions, assessment and forecast for the Indonesian economy, in addition to the Bank Indonesia monetary policy response published quarterly in the Monetary Policy Report in January, April, July, and October. Specifically, the MPR presents an evaluation of the latest developments in inflation, the exchange rate, and monetary conditions during the reporting month and decisions concerning the monetary policy response adopted by Bank Indonesia.
Board of Governor
Darmin Nasution Governor
Hartadi A. Sarwono Deputy Governor
S. Budi Rochadi Deputy Governor
Muliaman D. Hadad Deputy Governor
Ardhayadi Mitroatmodjo Deputy Governor
Budi Mulya Deputy Governor
Table of Content
I. MONETARY POLICY STATEMENT ... 3
II. THE ECONOMY AND MONETARY POLICY ... 6
Developments in the World Economy ... 6
Economic Growth in Indonesia ... 9
IInflation ... 13
Rupiah Exchange Rate ... 15
Interest Rates ... 17
Suku Bunga ... 17
Funds, Credit and the Money Supply ... 19
The Stock Market ... 21
Government Securities Market ... 22
Mutual Funds Market ... 23
Condition of the Banking System ... 23
III. MONETARY POLICY RESPONSE ... 24
I. MONETARY POLICY STATEMENT
The global economic recovery under way is feared could stall due to The global economic recovery under way is feared could stall due to The global economic recovery under way is feared could stall due to The global economic recovery under way is feared could stall due to The global economic recovery under way is feared could stall due to slowing economic activity in the US, China and Japan.
slowing economic activity in the US, China and Japan. slowing economic activity in the US, China and Japan. slowing economic activity in the US, China and Japan.
slowing economic activity in the US, China and Japan. The US economic slowdown is explained primarily by stubbornly high unemployment that has depressed household consumption. The weak purchasing power of households has led to slowing activity in the manufacturing sector. In Japan, the economic slowdown has been caused mainly by deteriorating export performance, a result of a strong yen that has reached a 15-year high against the US dollar. At the same time, government action to tighten lending has slowed investment and consumption in China. This policy decision is slowing the pace of China»s economy, although growth remains at a buoyant level.
The Indonesian economy is steadily improving, but not in all areas The Indonesian economy is steadily improving, but not in all areas The Indonesian economy is steadily improving, but not in all areas The Indonesian economy is steadily improving, but not in all areas The Indonesian economy is steadily improving, but not in all areas. This is indicated by the sizeable role of household consumption in contrast to investment, which despite growth is not at optimal levels. In analysis by sector, non-tradable sectors are expanding at a brisk pace in contrast to the limited growth in tradable sectors and especially manufacturing. Various constraints to investment have contributed to limited capacity for economic growth. Under these conditions, efforts to accelerate demand side expansion must be adjusted to the supply side capacity for response. CPI inflation in August 2010 was marked by rising pressure from
CPI inflation in August 2010 was marked by rising pressure from CPI inflation in August 2010 was marked by rising pressure from CPI inflation in August 2010 was marked by rising pressure from CPI inflation in August 2010 was marked by rising pressure from fundamentals, while pressure eased from non-fundamentals and fundamentals, while pressure eased from non-fundamentals and fundamentals, while pressure eased from non-fundamentals and fundamentals, while pressure eased from non-fundamentals and fundamentals, while pressure eased from non-fundamentals and particularly volatile foods
particularly volatile foods particularly volatile foods particularly volatile foods
0.76% (mtm), down from the preceding period. However, in the annual measure, inflationary pressure is up, having mounted from 6.22% (yoy) in July 2010 to 6.44% (yoy).
Indonesia»s balance of payments has again posted an estimated surplus. Indonesia»s balance of payments has again posted an estimated surplus.Indonesia»s balance of payments has again posted an estimated surplus. Indonesia»s balance of payments has again posted an estimated surplus.Indonesia»s balance of payments has again posted an estimated surplus. Key to this is the performance of the capital and financial account bolstered by a sharp rise in capital inflows for portfolio investments. In the current account, however, imports are growing at a brisk pace. The rise in imports has come in response to more vigorous domestic economic activity, particularly in preparation for the religious festive season. In the outcome of these developments, international reserves at 31 August 23010 reached USD81.3 billion, equivalent to 6.1 months of imports and servicing of official debt.
During August 2010, the rupiah maintained an appreciating trend, During August 2010, the rupiah maintained an appreciating trend,During August 2010, the rupiah maintained an appreciating trend, During August 2010, the rupiah maintained an appreciating trend,During August 2010, the rupiah maintained an appreciating trend, bolstered by positive perceptions of the economy and high returns on bolstered by positive perceptions of the economy and high returns onbolstered by positive perceptions of the economy and high returns on bolstered by positive perceptions of the economy and high returns onbolstered by positive perceptions of the economy and high returns on rupiah instruments
rupiah instrumentsrupiah instruments
rupiah instrumentsrupiah instruments. The strength of this attraction prompted renewed increases in capital inflows with significant funds pouring into instruments on the financial market. During the month, the rupiah exchange rate averaged Rp 8,972 to the USD, a gain of 0.78% (mtm). At end-August 2010, the rupiah closed at Rp 9,035 to the US dollar, having weakened 0.95% (point to point) from end-July 2010. The strengthening in the rupiah was accompanies by slightly increased volatility. During August 2010, volatility in the rupiah averaged 0.28%, up from 0.19% in the previous month.
Indonesia»s financial market charted improved performance marked by Indonesia»s financial market charted improved performance marked byIndonesia»s financial market charted improved performance marked by Indonesia»s financial market charted improved performance marked byIndonesia»s financial market charted improved performance marked by gains in the JCI and lower yield on government securities across all tenors gains in the JCI and lower yield on government securities across all tenorsgains in the JCI and lower yield on government securities across all tenors gains in the JCI and lower yield on government securities across all tenorsgains in the JCI and lower yield on government securities across all tenors. One key factor was the high volume of capital inflows. In the area of monetary policy transmission, bank lending rates continued to ease. Bank interest rates for funds and credit moved yet lower, although at a slower pace and accompanied by a narrower spread. In the credit channel, credit expansion is on the rise, bolstered mainly by consumption credit even in spite of the increased contributions from investment credit and working capital credit. Liquidity conditions in the economy have maintained an improving trend in line with the rise in economic activity.
Financial system stability, like before, is well under control, bolstered by the Financial system stability, like before, is well under control, bolstered by theFinancial system stability, like before, is well under control, bolstered by the Financial system stability, like before, is well under control, bolstered by theFinancial system stability, like before, is well under control, bolstered by the robust condition of the banking sector in mitigating risks and improvement robust condition of the banking sector in mitigating risks and improvementrobust condition of the banking sector in mitigating risks and improvement robust condition of the banking sector in mitigating risks and improvementrobust condition of the banking sector in mitigating risks and improvement in the banking intermediation function.
in the banking intermediation function.in the banking intermediation function.
non-performing loans (NPLs) gross at below 5.0%. Improvement in the banking intermediation function is reflected in more robust credit expansion at 20.3% (yoy) in August 2010.
In the Board of Governors» Meeting convened on 3 September 2010, Bank In the Board of Governors» Meeting convened on 3 September 2010, Bank In the Board of Governors» Meeting convened on 3 September 2010, Bank In the Board of Governors» Meeting convened on 3 September 2010, Bank In the Board of Governors» Meeting convened on 3 September 2010, Bank Indonesia decided to keep the BI Rate at 6.50%
Indonesia decided to keep the BI Rate at 6.50% Indonesia decided to keep the BI Rate at 6.50% Indonesia decided to keep the BI Rate at 6.50%
II. THE ECONOMY AND MONETARY POLICY
Signs point to a slowdown in the global economic recovery, triggered primarily by less vigorous recovery in the US, China and Japan. Indications of the slowing global recovery have prompted a downturn on global stock markets and weakened prices for some globally traded commodities. On the other hand, inflation in emerging market economies is steadily mounting. Advanced nations, however, have seen the onset of renewed increases in inflation, albeit at a low level. The Indonesian economy is reporting steadily improved performance marked by brisk demand-side expansion. This is indicated by the sizeable role of household consumption in contrast to investment, which despite growth is not at optimal levels. In analysis by sector, non-tradable sectors are expanding at a rapid pace in contrast to the limited growth in tradable sectors and especially manufacturing.
Developments in the World Economy
Concerns exist that the global economic recovery could stall due to Concerns exist that the global economic recovery could stall due toConcerns exist that the global economic recovery could stall due to Concerns exist that the global economic recovery could stall due toConcerns exist that the global economic recovery could stall due to slowing economic activity in the US, China and Japan
slowing economic activity in the US, China and Japanslowing economic activity in the US, China and Japan
slowing economic activity in the US, China and Japanslowing economic activity in the US, China and Japan. Indicators point to slackening performance in the US and Japanese economies, with manufacturing activity in decline alongside weak consumption. At the same time, the monetary tightening launched by the authorities in China has also led to a slowdown in China»s economy, although growth remains at a buoyant level. Overall, the world economy is forecasted to chart reduced growth as reflected in the forecasts published by various multinational agencies. Fears over the economic slowdown in the US and China have sent global stock markets into decline. The weakening on global stock markets was triggered mainly by the release of data on US, Chinese and Japanese economic fundamentals that disappointed market forecasts. However, the decision by most central banks to maintain an accommodative monetary policy was sufficient to ease the liquidity crunch in some advanced nations. Asian stock markets were also comparatively resilient to the turmoil on global financial markets, bolstered by optimism over forecasts for the region and low perceptions of risk.
Graph 2.1.
US Household Real Income Spending
Graph 2.2.
US Purchasing Manager Index (PMI)
analyst forecasts (Graph 2.1), the published 0.2% rise in personal incomes came in below the 0.3% projection by analysts, confirming the slowing pace of US economic recovery. Lack of improvement in the US labour market has become a factor holding back incomes from rising. Similarly, flagging manufacturing activity is visible in inventory levels that have slipped back into negative territory as a result of weak household demand. The production index generated from the ISM survey of manufacturers (July 2010) dropped to 55.5, although remaining above the expansion level of 50 (Graph 2.2).
The Japanese economy is faltering due to weak exports The Japanese economy is faltering due to weak exports The Japanese economy is faltering due to weak exports The Japanese economy is faltering due to weak exports
The Japanese economy is faltering due to weak exports. The yen appreciation against the US dollar to a 15-year high has adversely
impacted Japan»s exports, which began slowing in July 2010. The knock-on effects on domestic manufacturing are evident in various indicators such as the production index and the PMI survey compared to the preceding month. Similarly, indicators of consumption, such as retail sales and household expenditures, have come under sustained pressure from rising levels of unemployment.
During Q2/2010, growth in Europe was bolstered primarily by growth in During Q2/2010, growth in Europe was bolstered primarily by growth in During Q2/2010, growth in Europe was bolstered primarily by growth in During Q2/2010, growth in Europe was bolstered primarily by growth in During Q2/2010, growth in Europe was bolstered primarily by growth in Europe»s leading nations
Europe»s leading nations Europe»s leading nations Europe»s leading nations
Europe»s leading nations. The weakening of the euro has had a positive effect on European exports, boosting economic expansion to 1.7% (yoy) or 1.0% (qtq). More robust exports have also have a positive impact on manufacturing, as reflected in gains in the production index and new manufacturing orders as business sentiment picks up in Europe. Despite this, consumption remains constrained by high unemployment and the limited fiscal headroom for governments to deliver a stimulus for economic activity.
Softening economic fundamentals of the US and China have diminished Softening economic fundamentals of the US and China have diminished Softening economic fundamentals of the US and China have diminished Softening economic fundamentals of the US and China have diminished Softening economic fundamentals of the US and China have diminished the risk appetite of investors
the risk appetite of investors the risk appetite of investors the risk appetite of investors
the risk appetite of investors. Data released on the US and Chinese economies, pointing to a slowing rate of economic recovery, has triggered a round of flight to quality reflected in rising gold prices and weakening global stock values. On European financial markets, fears over contagion from the Greek crisis have receded following the release of positive European GDP growth figures released for Q2/2010. Despite this, risk indicators for advanced nations are on a general upward trend, visible in the widening of Credit Default Swaps (CDS) for some corporations (including banks) reflecting fears over a double-dip recession. The liquidity crunch in advanced economies is easing further. Policies adopted by central banks in advanced economies include continuation of the quantitative
0,2
...up to July 2010
-2.0
Jan Apr Jul Oct Jan Apr Jul Oct Jan Apr Jul
2009 2010
expanding
contracting
ISM Manufacture ISM Services
Index
Jan Apr Jul Oct Jan Apr Jul Oct Jan Apr Jul
2008 2009 2010
...up to July 2010
easing programme and the maintenance of interest rates at an accommodative level, which has eased the liquidity crunch on the interbank money market. Indicators of counterparty risk have also improved, as reflected in the stable highest-lowest spread in interbank LIBOR quotations, the narrowing of the spread between 3-month Overnight Index Swap (OIS)and the 3-month Libor and the stable TED spread over 3 months.
Global inflationary pressure is showing signs of increasing in response to Global inflationary pressure is showing signs of increasing in response to Global inflationary pressure is showing signs of increasing in response to Global inflationary pressure is showing signs of increasing in response to Global inflationary pressure is showing signs of increasing in response to brisk economic growth in emerging market countries
brisk economic growth in emerging market countries brisk economic growth in emerging market countries brisk economic growth in emerging market countries
brisk economic growth in emerging market countries. The inflation forecast for developing nations in 2010 (August), based on the August 2010 Consensus Forecast, has risen to 5.31% (yoy), while inflation in advanced economies for 2010 is in fact predicted to drop to 1.42% (yoy). At the same time, inflation expectations in advanced nations have begun to climb, although still at a low level. Inflationary pressure in Asia is also on the rise, due to the recovery in economic activity within the region. For the most part, advanced nations have maintained an accommodative For the most part, advanced nations have maintained an accommodative For the most part, advanced nations have maintained an accommodative For the most part, advanced nations have maintained an accommodative For the most part, advanced nations have maintained an accommodative monetary policy response
monetary policy response monetary policy response monetary policy response
monetary policy response. During August 2010, some central banks in developed economies (US, Japan, UK, Canada and Europe) kept their policy rates on hold in view of still moderate inflationary pressure and renewed signs of weakening economic performance. Some central banks also resumed quantitative easing, as exemplified by the Fed in its promise to increase its buying of securities as a contingency measure in the event of a renewed downturn in the US economy. In other moves, the
Government of Japan is working with the Bank of Japan (BoJ) to curb the appreciation in the yen, which has risen to a record high for the past 15 years and could threaten exports and the recovery of the nation»s economy. To this end, the BoJ has committed itself to expand the stimulus for the banking sector from the previous ∞10 trillion (US$116 billion) to ∞30 trillion.
Despite this, some developing nations in Latin America and Asia have Despite this, some developing nations in Latin America and Asia have Despite this, some developing nations in Latin America and Asia have Despite this, some developing nations in Latin America and Asia have Despite this, some developing nations in Latin America and Asia have begun raising their policy rates to curb inflationary pressure and asset price begun raising their policy rates to curb inflationary pressure and asset price begun raising their policy rates to curb inflationary pressure and asset price begun raising their policy rates to curb inflationary pressure and asset price begun raising their policy rates to curb inflationary pressure and asset price bubbles
bubbles bubbles bubbles
Economic Growth in Indonesia
Following a period of brisk growth in Q2/2010, a period of stable growth Following a period of brisk growth in Q2/2010, a period of stable growth Following a period of brisk growth in Q2/2010, a period of stable growth Following a period of brisk growth in Q2/2010, a period of stable growth Following a period of brisk growth in Q2/2010, a period of stable growth is predicted for the Indonesian economy in Q3/2010
is predicted for the Indonesian economy in Q3/2010 is predicted for the Indonesian economy in Q3/2010 is predicted for the Indonesian economy in Q3/2010
is predicted for the Indonesian economy in Q3/2010. On the demand side, the forecast is that strengthening domestic demand coupled with
sustained high external demand will keep driving the growth of the economy. Household consumption is predicted to expand even faster in response to strong public purchasing power, support from consumer credit and relatively low prices of imported goods due to the appreciation of the rupiah. Accelerated investment growth is estimated to have carried over into Q3/2010 in keeping with the improvement in the global economy, a conducive investment climate and progress on government infrastructure projects. Increased investment has also been supported by availability of financing from domestic sources and foreign companies. While a modest slowdown is predicted for the external side, exports and imports are forecasted to maintain high growth. On the supply side, recent
developments in various indicators point to potential for higher growth in tradable sectors.
In Q3/2010, household consumption is forecasted to maintain a brisk pace In Q3/2010, household consumption is forecasted to maintain a brisk pace In Q3/2010, household consumption is forecasted to maintain a brisk pace In Q3/2010, household consumption is forecasted to maintain a brisk pace In Q3/2010, household consumption is forecasted to maintain a brisk pace of growth
of growth of growth of growth
of growth. The latest developments in leading indicators for household consumption suggest that growth in household consumption is still on the expansionary phase. During the month under review, growth in household consumption was supported by consumption of both food and non-food items. This is consistent with movement in leading consumption indicators, such as the brisk pace of motor vehicle sales in July and the upward trend in sales of electronic goods (Graphs 2.3 and 2.4). At the same time, other consumption indicators such as the retail sales index are generally stable (Graph 2.5). Despite pressure from mounting prices, food consumption is predicted to mount as the preparations for the Eid-ul-Fitr festivities move forward. On the financing side, the potential for increased household consumption growth is also reflected in the rapid expansion of consumption credit extended by banks alongside surging growth in consumer financing from multifinance companies. In early Q3/2010, consumer confidence was dented slightly in response to upward pressure on prices. The electricity billing rates announced on 1 July 2010, mounting consumer spending for education (new academic year) and higher prices for staple commodities throughout July 2010 are thought to have produced a downturn in the consumer confidence index during August 2010 (Graph 2.6). A similar trend was also visible in the Consumer
Graph 2.3.
Sales of Motor Vehicle
PY_Car
Sales of Electronic Product
Graph 2.5 Retail Sales Index
Tendency Survey fielded by the Central Statistics Agency (BPS), in which consumer confidence for Q3/2010 is down slightly at 104.34 compared to 105.32 for the preceding quarter. Nevertheless, expectations of rising consumer incomes during Q3/2010 have bolstered consumer confidence against further decline.
Investment is predicted to mount further in Q3/2010 Investment is predicted to mount further in Q3/2010 Investment is predicted to mount further in Q3/2010 Investment is predicted to mount further in Q3/2010
Investment is predicted to mount further in Q3/2010. More vigorous investment is expected in response to high growth in household consumption, persistently strong external demand and statements by various international institutions affirming the improvement in investment conditions in Indonesia. In addition, more upbeat business tendencies during the second half of 2010 will also boost investment performance. Recent developments in various leading indicators also confirm predictions for sustained investment growth during Q3/2010, particularly for
machinery investment (Graph 2.7) and construction (Graph 2.8). Positive indications of rising construction investment are high levels of cement and power consumption. At the same time, the machinery and tools
production index, electricity consumption in the business sector, imports of machinery and imports of machine parts have steadily climbed since Q4/ 2009 in line with rising investment in machinery. Imports have mounted for machinery used in telecommunications, transport and production. This trend is estimated to have carried over into Q3/2010. Accompanying this has been a steady rise in realisation of new investments and investment in previously licensed companies (FDI and domestic investment projects) (Graph 2.9). The increased investment has also been supported by greater availability of financing from both domestic and foreign sources (Graph 2.10).
Estimates for exports in early Q3/2010 point to more moderate albeit still Estimates for exports in early Q3/2010 point to more moderate albeit still Estimates for exports in early Q3/2010 point to more moderate albeit still Estimates for exports in early Q3/2010 point to more moderate albeit still Estimates for exports in early Q3/2010 point to more moderate albeit still high growth
high growth high growth high growth
high growth. Exports have slowed primarily for non-oil and gas
commodities, due to flagging economic growth in some of Indonesia»s key export destinations such as Japan and China. This has produced a
slowdown in non-oil and gas export performance, while exports of oil and natural gas show potential for growth. On one hand, indications of slowing oil and gas performance are found mainly in falling non-resource-based exports and slowing exports of resource based products. In July 2010, resource-based exports slowed in response to smaller volume of mining exports, led by coal and copper, a development matched by reduced volume of agricultural exports such as timber and shrimp. At the same time, non-resource-based exports have declined. In the particular
Graph 2.6. Consumer Confidence Index √ BI Consumer Survey
Economic Conditions Today Index Consumer Expectation Index Consumer Confidence Index
8
Graph 2.7. Machinery Investment
-10 IPI Machinery and Equipments
M Spare Part & Capital Goods Equipment M Capital Goods except transport Equipment
Industrial Electricity Consumer up to May (rhs)
% yoy % yoy
2001 2002 2003 2004 2005 2006 2007 2008 2009 2010
case of exported cement, chemical products and paper, exports have been impacted by falling production in these sectors. On the other hand, indications of higher oil and natural gas exports in Q3/2010 are supported by steadily rising gas exports since the beginning of the year, as well as higher oil exports.
In keeping with strong domestic and external demand, imports are In keeping with strong domestic and external demand, imports are In keeping with strong domestic and external demand, imports are In keeping with strong domestic and external demand, imports are In keeping with strong domestic and external demand, imports are forecasted to maintain brisk growth during Q3/2010
forecasted to maintain brisk growth during Q3/2010 forecasted to maintain brisk growth during Q3/2010 forecasted to maintain brisk growth during Q3/2010
forecasted to maintain brisk growth during Q3/2010. Movement in leading indicators for imports also show that import growth remains in an
expansionary phase. In real data for the first half of 2010 (average until June 2010), import growth reached 31.3% (yoy), contrasting with the steep drop during the same period last year at -28.5% (yoy). The brisk growth in imports in early Q3/2010 is thought to be driven more by steady improvement in consumption and investment, in addition to the
appreciating trend in the exchange rate compared to 2009. In
disaggregation by use, import growth is fuelled primarily by raw materials, followed by capital goods and consumer goods.
In analysis by sector, recent developments in various indicators point to In analysis by sector, recent developments in various indicators point to In analysis by sector, recent developments in various indicators point to In analysis by sector, recent developments in various indicators point to In analysis by sector, recent developments in various indicators point to potential for high growth in tradable sectors during Q3/2010
potential for high growth in tradable sectors during Q3/2010 potential for high growth in tradable sectors during Q3/2010 potential for high growth in tradable sectors during Q3/2010 potential for high growth in tradable sectors during Q3/2010. Several leading indicators for manufacturing, such as automotive sales, production indices, imports of raw materials and industrial machinery and power consumption, reflected positive developments as of July 2010. The mining sector is predicted to maintain stable growth, as indicated by the stable trend in crude oil lifting and renewed improvement in exports of some mining commodities. However, reduced growth is predicted for the agriculture sector, mainly as a result of falling growth in the food crops subsector following the end of the harvest season, as well as weather conditions. However, performance in the estates and forestry subsectors still points to positive developments, which may help to prevent further slowdown. Developments in indicators in non-tradable sectors also point in an improving direction. Improvement is visible in leading indicators for the trade, hotels and restaurants sector, such as VAT on imports, hotel occupancy and foreign tourist arrivals. Besides this, the impact of the Eid-ul-Fitr festive season is also expected to boost performance in this sector for Q3/2010.
The transport and communications sector is also predicted to chart improved growth indicated by gains in some leading indicators, such as total passengers and freight carried, imports of transportation equipment
Graph 2.8. Investment √ Construction and Non Construction
Graph 2.9. Realisation of Foreign Investment and Domestic Investment √ BKPM
Graph 2.10.
Investment Credit and Leasing
-5
2001 2002 2003 2004 2005 2006 2007 2008 2009 2010
PMTB (rhs) Transportation Machinery Construction (rhs)
I II III IV I II III IV I II III IV I II III IV I II III IV I II III IV I II III IV I II III IV I II III IV I II
2007 2008 2009 2010
I II III IV I II III IV I II III IV I II GFCF
Foreign Investment
Total Foreign & Domestic Investment Domestic Investment (rhs)
% yoy
Source : DPNP, DSM -20
Riil Investment Credit Riil Leasing
Inflation
CPI inflation in August 2010 was marked by rising pressure from CPI inflation in August 2010 was marked by rising pressure from CPI inflation in August 2010 was marked by rising pressure from CPI inflation in August 2010 was marked by rising pressure from CPI inflation in August 2010 was marked by rising pressure from fundamentals, while pressure eased from non-fundamentals and fundamentals, while pressure eased from non-fundamentals and fundamentals, while pressure eased from non-fundamentals and fundamentals, while pressure eased from non-fundamentals and fundamentals, while pressure eased from non-fundamentals and particularly volatile foods
particularly volatile foods particularly volatile foods particularly volatile foods
particularly volatile foods. Pressure in core inflation during August 2010 came mainly from a surge in educational expenses in the seasonal trend marking the beginning of the new academic year, as well as increases in air fares. Increases in the processed foods category triggered by volatile foods inflation and the seasonal rise in demand in advance of religious festivities added to the pressure in the core inflation category. On the external side, the impact of imported inflation caused by increases in global commodity prices and inflation in trading partners has not generated significant upward pressure on core inflation, due to the appreciating trend in the rupiah. Regarding non-fundamentals, inflationary pressure during August was fuelled by the direct impact of increased electricity billing rates for household consumers. In contrast, volatile foods inflation eased in line with the harvest of some seasonings and vegetable commodities. Amid these developments, CPI inflation was recorded at 0.76% (mtm) for the month under review, down from the preceding period. In annual figures, however, inflationary pressure is up, having mounted from 6.22% (yoy) in July 2010 to 6.44% (yoy) (Graphs 2.11 and 2.12).
Inflation in administered prices mounted higher in August 2010 due to the Inflation in administered prices mounted higher in August 2010 due to the Inflation in administered prices mounted higher in August 2010 due to the Inflation in administered prices mounted higher in August 2010 due to the Inflation in administered prices mounted higher in August 2010 due to the direct impact of higher electricity billing rates on August 2010 inflation direct impact of higher electricity billing rates on August 2010 inflation direct impact of higher electricity billing rates on August 2010 inflation direct impact of higher electricity billing rates on August 2010 inflation direct impact of higher electricity billing rates on August 2010 inflation. The new base electricity tariffs announced on 1 July 2010 were reflected in household billing during August. Other commodities in the administered prices category with inflationary impact include cigarettes. However, movement in energy prices has been largely subdued as a result of smooth implementation of the conversion programme. Taken together, the administered prices category recorded monthly inflation at 1.09% (mtm), producing a fairly steep rise in the annual inflation figure to 4.67% compared to the previous month»s level of 3.74% (yoy).
Although domestic demand soared during the fasting month, volatile Although domestic demand soared during the fasting month, volatile Although domestic demand soared during the fasting month, volatile Although domestic demand soared during the fasting month, volatile Although domestic demand soared during the fasting month, volatile foods inflation generated minimal pressure
foods inflation generated minimal pressure foods inflation generated minimal pressure foods inflation generated minimal pressure
foods inflation generated minimal pressure. During August 2010, inflation was up mainly in the miscellaneous meats and rice categories, while pressure from seasonings eased. The rise in demand throughout the Ramadan fasting month has sent meat prices soaring. Similarly, escalating demand for rice during the fasting month has driven up prices in spite of adequate supply conditions, intensive open market operations and faster, more widespread distribution of subsidised rice for impoverished citizens.
Graph 2.11. Inflation
Graph 2.12. Inflation by Category Goods and Services
%, yoy
In response to these developments, volatile foods inflation in reached 0.45% (mtm) or 15.09% (yoy), down from the previous 5.46% (mtm) or 16.18% (yoy).
Pressure began to mount in core inflation during August 2010 due to Pressure began to mount in core inflation during August 2010 due to Pressure began to mount in core inflation during August 2010 due to Pressure began to mount in core inflation during August 2010 due to Pressure began to mount in core inflation during August 2010 due to seasonal trends
seasonal trends seasonal trends seasonal trends
seasonal trends. The rise in core inflation during August came mainly from a surge in educational expenses consistent with the seasonal trend at the start of the new academic year, as well as increases in air fares.
Furthermore, the price escalation for seasonings in recent months has boosted inflation in the processed foods category, which represents part of core inflation. Soaring demand during the fasting month and exploitation by traders of the opportunity for higher profit margins has driven up prices for some food commodities. Taken together, inflation in the core category mounted from 0.49% (mtm) or 4.15% (yoy) in the preceding month to 0.80% (mtm) or 4.53% (yoy). On the external side, the impact of imported inflation from increases in global commodity prices and inflation in trading partners has not generated significant upward pressure on core inflation, due to the appreciating trend in the rupiah. External influence on core inflation came more from gold prices, in keeping with higher prices commanded by gold on the international market (Graph 2.13).
Graph 2.13. International & Domestic Gold Prices
International Gold Price Domestic Gold Price (right) 1800
1600
1400
1200
1000
800
600
500000
450000
400000
350000
300000
250000
200000 1 2 3 4 5 6 7 8 9 101112 1 2 3 4 5 6 7 8 9 101112 1 2 3 4 5 6 7 8
Rupiah Exchange Rate
The solid fundamentals of the economy and sustained high yields The solid fundamentals of the economy and sustained high yields The solid fundamentals of the economy and sustained high yields The solid fundamentals of the economy and sustained high yields The solid fundamentals of the economy and sustained high yields underpinned the attractiveness of investment in domestic instruments, underpinned the attractiveness of investment in domestic instruments, underpinned the attractiveness of investment in domestic instruments, underpinned the attractiveness of investment in domestic instruments, underpinned the attractiveness of investment in domestic instruments, which bolstered exchange rate during August 2010
which bolstered exchange rate during August 2010 which bolstered exchange rate during August 2010 which bolstered exchange rate during August 2010
which bolstered exchange rate during August 2010. During the month, the exchange rate averaged Rp 8,972 to the US dollar, representing an appreciation of 0.78% over July 2010. At end-August 2010, the rupiah closed at Rp 9,035 to the US dollar, having weakened 0.95% (point to point) from July 2010 (Graph 2.14). Accordingly, the average value of the rupiah has advanced 13.4% to Rp 9,137 to the US dollar in 2010 from Rp 10,361 in 2009. The rupiah appreciation during August was accompanied by slightly increased volatility. The level of volatility in movement in the rupiah reached 0.28% in August 2010, up from 0.19% one month earlier (Graph 2.15). The heightened volatility in the rupiah is explained in part by a renewed surge in capital inflows.
Externally, the risk of slowdown in the global economic recovery has Externally, the risk of slowdown in the global economic recovery has Externally, the risk of slowdown in the global economic recovery has Externally, the risk of slowdown in the global economic recovery has Externally, the risk of slowdown in the global economic recovery has become a factor bringing capital inflows into the region
become a factor bringing capital inflows into the region become a factor bringing capital inflows into the region become a factor bringing capital inflows into the region
become a factor bringing capital inflows into the region. The weakening in various US economic indicators and high levels of unemployment have reinforced perceptions of road blocks to recovery in the US economy. In Europe, concerns escalated in the wake of the downgrading of Ireland»s credit rating, which then widened yield spreads for the PIIGS nations over German bonds. This is feared will create added difficulties for the PIIGS countries in bringing down their fiscal deficits. By contrast, Asian nations have taken the lead in economic improvement. This has also heightened the threat of inflation in the region, compelling some central banks in Asia to raise their policy rates. This has become a key factor attracting investors to place their funds in emerging market financial instruments. During August 2010, the majority of Asian currencies moved upward in relation to the US Dollar (Graph 2.16).
Domestically, the solid fundamentals of the domestic economy have led to Domestically, the solid fundamentals of the domestic economy have led to Domestically, the solid fundamentals of the domestic economy have led to Domestically, the solid fundamentals of the domestic economy have led to Domestically, the solid fundamentals of the domestic economy have led to improvement in investment risk indicators for Indonesia
improvement in investment risk indicators for Indonesia improvement in investment risk indicators for Indonesia improvement in investment risk indicators for Indonesia
improvement in investment risk indicators for Indonesia. By the end of August 2010, the EMBIG spread eased to the 307 bps range while yield spread on Indonesia Global Bonds over US T-Notes narrowed to 160 bps (Graph 2.17). This reflects investor confidence in Indonesian debt instruments. The safeguarding of domestic risk perceptions has raised covered interest parity (CIP), the interest rate spread after factoring in risk, to 4.6% (August 2010) from 4.1% (July 2010). At this level, the CIP is wider than for many other countries in Asia (Graph 2.18).
Graph 2.14. Average Rupiah Exchange Rate
Rp/USD
Feb Apr JunAugOkt Des
2008 2009 2010
Daily Exchange Rate Monthly Average Quarterly Average
Feb Apr JunAugOkt DesFeb Apr Jun Aug
9,110
Graph 2.15. Rupiah Exchange Rate Volatility
8900 Daily Exchange Rate (Rp/USD) - rhs
% IDR/USD
Feb Apr Jun Ags Oct Des Feb Apr Jun Ags Oct Des Feb Apr Jun Ags
Graph 2.16. Asian Currencies Appreciation/ Depreciation, Average August 2010 compare to July 2010
The rupiah exchange rate has held at a level conducive to external The rupiah exchange rate has held at a level conducive to external The rupiah exchange rate has held at a level conducive to external The rupiah exchange rate has held at a level conducive to external The rupiah exchange rate has held at a level conducive to external equilibrium in the economy
equilibrium in the economy equilibrium in the economy equilibrium in the economy
equilibrium in the economy. The appreciating trend in the rupiah has not produced any visible negative impact on exports (Graph 2.23). On the other hand, the appreciation bolsters the imports of raw materials needed in domestic manufacturing activities.
Graph 2.18.
CIP Indicator in Asia Region
Graph 2.19. Exchange Rate, Exports & Imports of Non-Oil and Gas
4,62
Indonesia Philipina Malaysia Korea
%
Feb May Ags Nov Feb May Ags Nov Feb May Ags Nov Feb May Ags
2007 2008 2009 2010
USD Million Rp/$
Jan Apr Jul Oct Jan Apr Jul Oct Jan Apr Jul
2008 2009 2010 Non oil and gas Imports
Non oil and gas Exports Exchange Rate (rhs)
Graph 2.17.
Yield Spread and EMBIG
bps %
Source: Bloomberg
Risk Worsen
Jan Mar May Jul Sep Nov Jan
Interest Rates
Interest rates on the interbank money market remained comparatively Interest rates on the interbank money market remained comparatively Interest rates on the interbank money market remained comparatively Interest rates on the interbank money market remained comparatively Interest rates on the interbank money market remained comparatively stable in August 2010
stable in August 2010 stable in August 2010 stable in August 2010
stable in August 2010. The overnight interbank rate hovered at about the BI Rate level, averaging 6.20% or slightly more than 6.17% in the previous month. The rise in the average overnight interbank rate is explained by higher volume of cash withdrawals as the Eid-ul-Fitr festivities draw near. Perceptions of risk on the overnight interbank market were generally low. This was reflected in the average 33 bps spread between high and low rates, differing little from 30 bps in the previous month. Interbank rate movement in longer tenors is also stable. The average interbank rate in above overnight tenors moved within a 2 bps range, except fore the 27-30 day tenor and above 30 day tenors. Taken together, the interest rate structure on the interbank market has levelled out, reflecting lower perceptions of future risk.
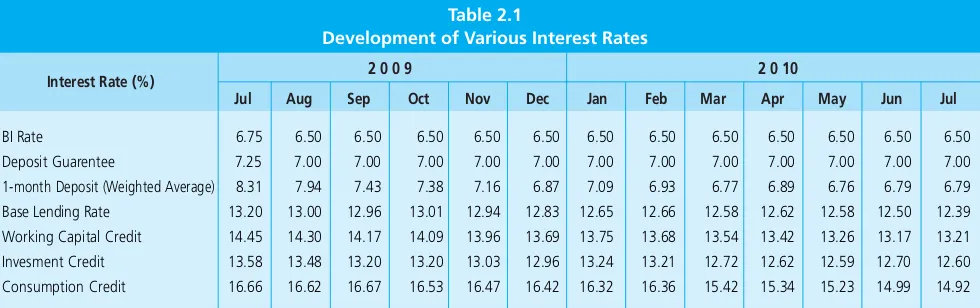
In the banking system, deposit and lending rates registered further decline, In the banking system, deposit and lending rates registered further decline, In the banking system, deposit and lending rates registered further decline, In the banking system, deposit and lending rates registered further decline, In the banking system, deposit and lending rates registered further decline, although only on a limited scale
although only on a limited scale although only on a limited scale although only on a limited scale
although only on a limited scale. In July 2010, the average deposit rate across all tenors eased by 5 bps, representing wider movement compared to one month before, when rates mounted by 2 bps (Table 2.1). Despite this, the 1-month deposit rate in July 2010 was unchanged from the preceding month. The average lending rate (average for working capital credit, investment credit and consumption credit) came down by a thin 4 bps in July 2010 compared to one month earlier.1 That month, rates for working capital credit, investment credit and consumption credit registered 13.21%, 12.60% and 14.92% (Graph 2.20). Loan interest rates, although still high, are on a downward trend and are expected to ease to levels that stimulate lending, particularly to productive sectors.
In disaggregation by category of bank, the steepest reduction in deposit In disaggregation by category of bank, the steepest reduction in deposit In disaggregation by category of bank, the steepest reduction in deposit In disaggregation by category of bank, the steepest reduction in deposit In disaggregation by category of bank, the steepest reduction in deposit rates was contributed by private banks at 35 bps
rates was contributed by private banks at 35 bps rates was contributed by private banks at 35 bps rates was contributed by private banks at 35 bps
rates was contributed by private banks at 35 bps. In contrast, foreign and joint venture banks lowered their time deposit rates by 4 bps. Deposit rates came down mainly in the 12 and 24-month tenors. As a result of these rate cuts, the lowest average deposit rates were recorded for foreign and joint venture banks (6.89%), followed by state banks (6.98%), private banks (7.46%) and regional development banks (8.46%).
In regard to loan interest rates, the most aggressive reductions were In regard to loan interest rates, the most aggressive reductions were In regard to loan interest rates, the most aggressive reductions were In regard to loan interest rates, the most aggressive reductions were In regard to loan interest rates, the most aggressive reductions were reported by foreign and joint venture banks, particularly for working reported by foreign and joint venture banks, particularly for working reported by foreign and joint venture banks, particularly for working reported by foreign and joint venture banks, particularly for working reported by foreign and joint venture banks, particularly for working
Graph 2.20.
Loan Interest Rate by Usage
6.79 BI Rate* Loan Consumption Loan Investment Working Capital Loan 1 month time deposit
6
capital and investment credit capital and investment creditcapital and investment credit
capital and investment creditcapital and investment credit. In July 2010, foreign and joint venture banks cut their loan interest rates by the steepest margin at 14 bps. However, in two other major categories, state banks and private banks, loan interest rates eased by only 2 bps and 6 bps. The lowest rates on investment loans were offered by state banks (11.71%), followed by foreign and joint venture banks (11.74%). Similarly, the lowest rates for working capital credit were offered by foreign and joint ventures (10.56%), followed by state banks (13.36%).
Table 2.1
Development of Various Interest Rates
BI Rate 6.75 6.50 6.50 6.50 6.50 6.50 6.50 6.50 6.50 6.50 6.50 6.50 6.50
Deposit Guarentee 7.25 7.00 7.00 7.00 7.00 7.00 7.00 7.00 7.00 7.00 7.00 7.00 7.00
1-month Deposit (Weighted Average) 8.31 7.94 7.43 7.38 7.16 6.87 7.09 6.93 6.77 6.89 6.76 6.79 6.79
Base Lending Rate 13.20 13.00 12.96 13.01 12.94 12.83 12.65 12.66 12.58 12.62 12.58 12.50 12.39
Working Capital Credit 14.45 14.30 14.17 14.09 13.96 13.69 13.75 13.68 13.54 13.42 13.26 13.17 13.21
Invesment Credit 13.58 13.48 13.20 13.20 13.03 12.96 13.24 13.21 12.72 12.62 12.59 12.70 12.60
Consumption Credit 16.66 16.62 16.67 16.53 16.47 16.42 16.32 16.36 15.42 15.34 15.23 14.99 14.92
Jul Aug Sep Oct Nov Dec Jan Feb Mar Apr May Jun Jul
2 0 0 9 2 0 10
Funds, Credit and the Money Supply
Bank depositor funds charted more robust growth. Bank depositor funds charted more robust growth. Bank depositor funds charted more robust growth. Bank depositor funds charted more robust growth.
Bank depositor funds charted more robust growth. During July 2010, growth in depositor funds reached 15.3% (yoy), up from the previous month»s level of 14.9% (yoy) (Graph 2.21). Despite the higher growth figure, depositor funds in fact narrowed by Rp 13.4 trillion in keeping with historical trends. Accordingly during 2010, depositor funds have mounted by Rp 109.6 trillion (5.6%, ytd) to Rp 2,082.2 trillion.
The stronger funding growth in July 2010 was driven mainly by expansion The stronger funding growth in July 2010 was driven mainly by expansion The stronger funding growth in July 2010 was driven mainly by expansion The stronger funding growth in July 2010 was driven mainly by expansion The stronger funding growth in July 2010 was driven mainly by expansion in savings deposits and time deposits.
in savings deposits and time deposits. in savings deposits and time deposits. in savings deposits and time deposits.
in savings deposits and time deposits. Funding growth in savings deposits and time deposits mounted to 20.2% and 12.0% (yoy) from the previous months» levels of 18.6% and 11.7% (yoy). Demand deposits, representing another funding component, eased to 16.0% (yoy) from 16.8% (yoy) one month earlier.
Credit expansion has undergone remarkable improvement. Credit expansion has undergone remarkable improvement. Credit expansion has undergone remarkable improvement. Credit expansion has undergone remarkable improvement.
Credit expansion has undergone remarkable improvement. In July 2010, credit growth climbed to 18.8% (yoy), ahead of 18.0% (yoy) in the previous month. Credit (including channelling) widened by Rp 11.5 trillion in July 2010, bringing total lending growth to date for 2010 to Rp 156.5 trillion(10.6%, ytd). This represents stronger performance when compared to credit growth for the same period in 2009 and is almost on par with the credit expansion that took place in 2008. According to preliminary
indicators, credit expansion in August 2010 is estimated as high as 20.3% (yoy).
In disaggregation by category of use for July 2010, the most aggressive In disaggregation by category of use for July 2010, the most aggressive In disaggregation by category of use for July 2010, the most aggressive In disaggregation by category of use for July 2010, the most aggressive In disaggregation by category of use for July 2010, the most aggressive expansion took place in working capital credit.
expansion took place in working capital credit. expansion took place in working capital credit. expansion took place in working capital credit.
expansion took place in working capital credit. Growth in working capital credit reached 13.9% (yoy), compared to 12.7% (yoy) in the preceding month. With working capital credit accounting for 47.4% of total bank lending, growth in working capital credit also represents an increasing share of overall credit expansion (Graph 2.22). Consumption credit maintained stable growth at 25.6% (yoy) compared to the level of the preceding month at 25.0% (yoy). In investment credit, lending growth tapered off slightly to 23.6% (yoy) from one month earlier, when it reached 25.2% (yoy).
In disaggregation by currency, banks also recorded increased foreign In disaggregation by currency, banks also recorded increased foreign In disaggregation by currency, banks also recorded increased foreign In disaggregation by currency, banks also recorded increased foreign In disaggregation by currency, banks also recorded increased foreign currency during July 2010.
currency during July 2010. currency during July 2010. currency during July 2010.
currency during July 2010. Foreign currency working capital credit expanded by 20.4% (yoy), compared to 17.6% (yoy) in the preceding month. The more vigorous lending in foreign currencies corresponds with higher imports of capital goods, notably passenger vehicles, as well as
Graph 2.21.
Credit, Fund and BI Rate
% %
Jan Mar May Jul Sep Nov Jan Mar May Jul Sep Nov Jan Mar May Jul
Graph 2.22.
Credit Growth Contribution by Usage
-5
growth in foreign currency deposits. By comparison, rupiah credit growth strengthened slightly to 21.8% (yoy) from 21.5% (yoy) in the previous month.
Economic liquidity maintained an upward trend in keeping with Economic liquidity maintained an upward trend in keeping with Economic liquidity maintained an upward trend in keeping with Economic liquidity maintained an upward trend in keeping with Economic liquidity maintained an upward trend in keeping with strengthening economic activity.
strengthening economic activity. strengthening economic activity. strengthening economic activity.
strengthening economic activity. During August 2010, base money growth reached 19.4% (yoy), up from the previous month»s level of 14.2% (yoy) (Graph 2.23). The significant rise in base money during August was driven by escalating demand for cash outside banks related to preparations for the Eid-ul-Fitr festivities. Growth in cash outside banks reached 24.0% (yoy) in August 2010, ahead of 13.8% (yoy) one month before. M1 and M2 economic liquidity underwent expansion.
M1 and M2 economic liquidity underwent expansion. M1 and M2 economic liquidity underwent expansion. M1 and M2 economic liquidity underwent expansion.
M1 and M2 economic liquidity underwent expansion. During July 2010,2 growth in economic liquidity mounted to 14.6% (yoy), ahead of 12.4% (yoy) one month before. M2 growth strengthened to 15.2% (yoy) from the previous month»s level of 14.5% (yoy) (Graph 2.24). In terms of trends, M1 and M2 growth have maintained a stable track since the beginning of the year, albeit still below pre-crisis levels. M1 growth has kept pace with GDP growth and can therefore be used as a leading indicator for the condition of the economy.
Graph 2.23.
Base Money and Currency
Graph 2.24.
Growth of Currency in Circulation
2 Data from former Commercial Bank Reports as of June 2010. Data in former Commercial Bank Reports differs from the SEKI data. Data from former Commercial Bank Reports excludes data on rural banks.
% yoy
-20 -10 0 10 20 30 40 50
2006 2007 2008 2009 2010
24.0
31.5
19.4
M0 M0 (GWM 5%) Currency
Jan Apr Jul Oct Jan Apr Jul Oct Jan Apr Jul Oct Jan Apr Jul Oct Jan Apr Jul Data DSM, Tim 4-BKM processed
14,6
15,2
15,0
% Y-o-Y %
0 4 8 12 16 20 24 28
2005 2006 2007 2008 2009 2010
1 3 5 7 9 11 1 3 5 7 9 11 1 3 5 7 9 11 1 3 5 7 9 11 1 3 5 7 9 11 1 3 5 M1 M2 M2 Rp
The Stock Market
The condition of Indonesia»s economic fundamentals contributed The condition of Indonesia»s economic fundamentals contributed The condition of Indonesia»s economic fundamentals contributed The condition of Indonesia»s economic fundamentals contributed The condition of Indonesia»s economic fundamentals contributed significantly to the JSX Composite Index gains during August 2010 significantly to the JSX Composite Index gains during August 2010 significantly to the JSX Composite Index gains during August 2010 significantly to the JSX Composite Index gains during August 2010 significantly to the JSX Composite Index gains during August 2010. Despite taking some correction early in the month, the JCI subsequently recovered ground to close at 3018.8. Stable movement in key
macroeconomic indicators such as the exchange rate, the improving condition of the economy and relatively low interest rates have boosted foreign investor confidence for placing their funds on the stock market. As a result, the JCI gained 0.41% and reached an all-time record high at 3,145.13 (Graph 2.25).
At the micro level of individual stock issuers, corporate fundamentals remained strong. Among others, this was reflected in buoyant earnings reported in financial statements released by some listed companies for the first half of 2010. Heartening performance by listed companies was also visible in the more robust return on assets (ROA) indicator in some sectors. Dividend payouts by some companies also offered further indication of the strong fundamentals of stock-listed companies in 2010.
The conducive condition of the Indonesian economy prompted foreign The conducive condition of the Indonesian economy prompted foreign The conducive condition of the Indonesian economy prompted foreign The conducive condition of the Indonesian economy prompted foreign The conducive condition of the Indonesian economy prompted foreign investors to keep investing on the Indonesian stock market
investors to keep investing on the Indonesian stock market investors to keep investing on the Indonesian stock market investors to keep investing on the Indonesian stock market
investors to keep investing on the Indonesian stock market. Foreign investor confidence continued to mount, reflected in the consistent net purchase in foreign investor transactions over the past 3 (three) months. During August 2010, net buying by foreigners averaged Rp 90 billion per day. The brisk pace of trading by foreign investors resulted in a positive contribution to overall expansion of trading activity. Share trading in August 2010 averaged Rp 2.5 trillion per day on share volume of 4 billion per day (Graph 2.26).
Graph 2.25. Jakarta Composite Index (JSX) and Regional Index
Graph 2.26.
JSX Trading Value and Volume
-15% -10% -5% 0% 5% 10%
Source: Bloomberg Data per August 31, 2010
Indonesia (IHSG) Hong Kong (Hang Seng) India (SENSEX)
Jan Feb Mar Apr May Jun Jul Aug
2010
Government Securities Market
Improving performance in Indonesian government securities was driven by Improving performance in Indonesian government securities was driven by Improving performance in Indonesian government securities was driven by Improving performance in Indonesian government securities was driven by Improving performance in Indonesian government securities was driven by the economic outlook and positive perceptions of external risks.
the economic outlook and positive perceptions of external risks. the economic outlook and positive perceptions of external risks. the economic outlook and positive perceptions of external risks.
the economic outlook and positive perceptions of external risks. Regarding macroeconomic conditions, the factors behind the rally in Indonesian government securities included the stable exchange rate and the positive outlook for economic growth. Also contributing to the performance of Indonesian government securities were limited fiscal risks and secure management of fiscal sustainability. These positive factors helped to narrow short-term and long-term yield by 4 bps and 8 bps. On the other hand, medium-term yield in fact widened by 18 bps due to heavy selling by foreigners in this tenor. As a result, yield measured overall edged upwards by a thin 5 bps to close at 7.9% (Graph 2.27).
During August 2010, the higher volume of capital inflows on the government securities market bolstered performance of government securities in short and long tenors. This foreign investor behaviour was driven by positive perceptions of the high returns offered in comparison to other countries in the region and expectations of more rapid progression to investment grade.
Net buying by foreign investors on the government securities market was Net buying by foreign investors on the government securities market was Net buying by foreign investors on the government securities market was Net buying by foreign investors on the government securities market was Net buying by foreign investors on the government securities market was followed by more vigorous trading activity, in keeping with the stable followed by more vigorous trading activity, in keeping with the stable followed by more vigorous trading activity, in keeping with the stable followed by more vigorous trading activity, in keeping with the stable followed by more vigorous trading activity, in keeping with the stable confidence of market actors.
confidence of market actors. confidence of market actors. confidence of market actors.
confidence of market actors. Trading volume mounted in August 2010 to Rp 5.5 trillion per day, from the previous Rp 3.6 trillion per day. This rise in trading activity boosted daily average frequency to 280 transactions per day in August 2010, compared to the previous month»s level of only 202 transactions each day (Graph 2.28). Even so, considerable numbers of foreign investors elected for the buy and hold strategy (including hold to maturity), given the thin selling on the government securities market. This resulted in slightly reduced activity on the secondary market.
Graph 2.27.
SBN Yield and BI Rate
Graph 2.28.
SBN Yield dan Trade Volume
%
2005 2006 2007 2008 2009 2010
BI Rate Yield Govt Bond 10 YR
Jan Apr Jul Oct Jan Apr Jul Oct Jan Apr Jul Oct Jan Apr Jul Oct Jan Apr Jul Oct Jan Apr Jul
Rp, Trillion % Daily Average-Trading Volume Govt Bond
Average Yield (RHS)
Mutual Funds Market
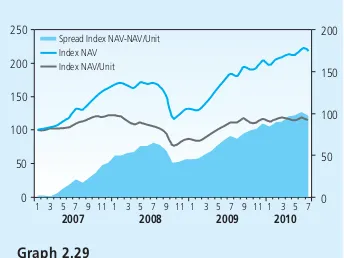
Net asset value (NAV) for mutual funds did not track performance in Net asset value (NAV) for mutual funds did not track performance in Net asset value (NAV) for mutual funds did not track performance in Net asset value (NAV) for mutual funds did not track performance in Net asset value (NAV) for mutual funds did not track performance in underlying assets
underlying assets underlying assets underlying assets
underlying assets. During July 2010, mutual funds net asset value recorded negative growth at -0.6% compared to 1.1% one month earlier. This trend contrasted with the performance of the benchmark (JCI), which gained 5.3% during July 2010. In disaggregation by category, fixed income funds and mixed funds saw growth slip to -0.6% and -1.8%. However, equity funds, despite continued negative growth, improved significantly from -4.4% in the preceding month to -1.8%.4 (Graph 2.29).
Condition of the Banking System
Conditions remain strong in the banking sector Conditions remain strong in the banking sector Conditions remain strong in the banking sector Conditions remain strong in the banking sector
Conditions remain strong in the banking sector. In July 2010, the capital adequacy ratio reached 16.5%. Other key indicators, such as non-performing loans (NPLs), net interest margin (NIM) and return on assets (ROA), also reflected healthy developments. NPLs remained at comfortably safe level below 5%, while ROA and NIM were stable at 2.9% and 0.5% (Table 2.2). In addition to the strong position of key indicators, there is steady improvement in the intermediation function. Lending growth in July 2010 reached 18.8% (yoy), ahead of the previous month»s growth at 18.0% (yoy).
Graph 2.29
NAV dan NAV/Unit of Mutual Fund
Spread Index NAV-NAV/Unit Index NAV Index NAV/Unit
0 50 100 150 200 250
2007 2008 2009 2010
0 50 100 150 200
1 3 5 7 9 11 1 3 5 7 9 11 1 3 5 7 9 11 1 3 5 7
4 Bapepam - Mutual Fund Information Center; Lag 1 month Tabel 2.2
Main Indicators of Banking System
Total Asset (T Rp) 2,331.4 2,384.6 2,388.6 2,392.7 2,439.7 2,534.1 2,501.8 2,517.0 2,563.7 2,576.3 2.604.4 2,678.3 2,683.5
Third Party Fund (T Rp) 1,806.6 1,847.0 1,857.3 1,863.5 1,897.0 1,973.0 1,948.6 1,931.6 1,982.2 1,980.5 2.013.2 2,096.0 2,082.6
Credit (T Rp) 1,370.2 1,400.4 1,399.9 1,410.4 1,430.9 1,470.8 1,435.7 1,459.7 1,485.9 1,516.0 1.561.2 1,615.8 1,627.4
LDR (%) 75.8 75.8 75.4 75.7 75.4 74.5 73.7 75.6 75.0 76.5 77.5 77.1 78.1
NPLs Gross* (%) 4.6 4.5 4.3 4.3 4.4 3.8 3.9 4.0 3.8 3.5 3.6 3.3 3.4
NPLs Net * (%) 1.7 1.5 1.3 1.2 1.4 0.9 1.1 1.0 1.0 0.9 1.0 0.8 0.9
CAR (%) 17.0 17.0 17.7 17.6 17.0 17.4 19.2 19.3 19.1 19.2 17.8 17.4 16.5
NIM (%) 0.5 0.5 0.4 0.5 0.5 0.5 0.5 0.5 0.5 0.5 0.5 0.5 0.5
ROA (%) 2.7 2.7 2.6 2.7 2.6 2.6 3.1 2.9 3.0 2.9 2.9 2.9 2.9
Jul Aug Sep Okt Nov Des Jan Feb Mar Apr May Jun Jul
2 0 0 9 2 0 10
Main Indicators
III. MONETARY POLICY RESPONSE
In the Board of Governors» Meeting convened on 3 September 2010, Bank In the Board of Governors» Meeting convened on 3 September 2010, Bank In the Board of Governors» Meeting convened on 3 September 2010, Bank In the Board of Governors» Meeting convened on 3 September 2010, Bank In the Board of Governors» Meeting convened on 3 September 2010, Bank Indonesia decided to maintain the BI Rate at 6.50%.
Indonesia decided to maintain the BI Rate at 6.50%. Indonesia decided to maintain the BI Rate at 6.50%. Indonesia decided to maintain the BI Rate at 6.50%.
Indonesia decided to maintain the BI Rate at 6.50%. However, in view of the potential for future inflationary pressure and the considerable excess liquidity in the banking system, the Board of Governors emphasises the importance of raising the Primary Statutory Reserve Requirement from 5% to 8% of rupiah depositor funds. The additional 3% held in Primary Statutory Reserves will be remunerated at 2.50% p.a. This policy combination is considered adequate to safeguard monetary stability and financial system stability amid the present high rate of capital inflows. Similarly, to promote the banking intermediation function, the Board of Governors is also introducing a statutory reserve requirement based on the LDR (loan to deposit ratio) as a means of ensuring credit growth firmly based on prudential banking principles. Under this requirement, the lower limit of the LDR is 78% and the upper limit 100%. A bank with an LDR outside this range will be subject to a disincentive based on variance in the LDR from the targeted range. If the LDR is higher than the target but the bank maintains adequate capital, it will receive an incentive. The new statutory reserves policy will be phased in with the primary statutory reserve requirement launched on 1 November 210 and the LDR statutory reserve requirement effective from 1 March 2011.
After taking stock of the latest developments, the Board of Governors After taking stock of the latest developments, the Board of Governors After taking stock of the latest developments, the Board of Governors After taking stock of the latest developments, the Board of Governors After taking stock of the latest developments, the Board of Governors stresses the importance of policy action from Bank Indonesia and of stresses the importance of policy action from Bank Indonesia and of stresses the importance of policy action from Bank Indonesia and of stresses the importance of policy action from Bank Indonesia and of stresses the importance of policy action from Bank Indonesia and of coordination with the Government to keep future inflation on track with coordination with the Government to keep future inflation on track with coordination with the Government to keep future inflation on track with coordination with the Government to keep future inflation on track with coordination with the Government to keep future inflation on track with the established inflation target
the established inflation target the established inflation target the established inflation target
Key Explanations
RUPIAH STATUTORY RESERVE
REQUIREMENT
On Friday, 3 September 2010, the Bank Indonesia Board of Governors decided to raise the primary statutory reserve requirement for rupiah funds to 8% and to introduce an LDR-based reserve requirement. This policy is intended to curb mounting inflationary pressure through management of excess banking liquidity. The new reserve requirement has been set with regard to the present condition of banking liquidity and does not diminish the capacity of banks to pursue credit expansion in line with existing bank business plans while upholding prudential banking principles.
1. Background:
1.1. Indonesia»s economic performance has registered steady improvement accompanied by stability in the financial sector. However, mounting inflationary pressure and persistent levels of excess banking liquidity have necessitated a response to avert a surge in inflation expectations that could disrupt monetary stability. 1.2. The financial sector stability maintained so far requires additional
support from a strengthening of the banking sector to manage the various emerging risks as well as from improvement in banking intermediation.
1.3. Monetary stability and the financial sector both need to be strengthened through measured actions to manage the excess liquidity in the banking system, among others, through use of statutory reserves.
2. New Policies
The rupiah statutory reserve requirement consists of: 8% primary reserves8% primary reserves8% primary reserves8% primary reserves8% primary reserves + 2.5% secondary reserves + LDR-based reserves.
+ 2.5% secondary reserves + LDR-based reserves. + 2.5% secondary reserves + LDR-based reserves. + 2.5% secondary reserves + LDR-based reserves. + 2.5% secondary reserves + LDR-based reserves. 2.1. Primary Reserves at 8% of rupiah depositor funds:
- The rupiah primary reserve requirement has been raised from 5% to 8% of rupiah depositor funds.
- The additional 3% in rupiah primary reserves against rupiah depositor funds will earn interest at 2.5% p.a.
- Interest will not be paid to banks holding primary reserves below 8%.
2.2. Secondary Reserves at 2.5% of rupiah depositor funds:
- The secondary reserve requirement at 2.5% of rupiah depositor funds is unchanged.
2.3. LDR Reserves
- The LDR-based reserve requirement is established with a range that will promote the banking intermediation function while upholding prudential banking principles.
- Accordingly, the lower limit of the LDR targeting range is set at 78% and the upper limit at 100%.
- Banks with an LDR outside this range will be subject to the following disincentives:
- Banks with an LDR below the lower limit of the LDR target face a disincentive of an additional reserve at 0.1 times rupiah depositor funds representing each 1% increment below the LDR targeting range.
- Banks with an LDR above the upper limit of the LDR target and with less than 14% CAR face a disincentive of an additional reserve at 0.2 times rupiah depositor funds representing each 1% excess in the LDR.
- The above LDR target and parameters for disincentives will be regularly evaluated by Bank Indonesia as necessary.
3. Policy Implementation
The new statutory reserves policy will come into force over the next few months as follows:
1. Primary Reserves at 8% of rupiah depositor funds 1 November 2010 2. Secondary Reserves at 2.5% of rupiah depositor funds Unchanged
3. LDR Reserves 1 March 2011
No. No. No. No.
No. Reserve Requirement in RupiahsReserve Requirement in RupiahsReserve Requirement in RupiahsReserve Requirement in RupiahsReserve Requirement in Rupiahs Implementation Implementation Implementation Implementation Implementation
The extended grace period is intended to allow banks sufficient time to bring liquidity management into line with the new requirements. The rupiah reserve requirement will be subject to regular evaluation in keeping with economic conditions.
4. In Conclusion
The rupiah statutory reserves policy will be stipulated further in a Bank Indonesia Regulation. Queries may be addressed to the Directorate of Banking Research and Regulation, the Directorate of Economic Research and Monetary Policy and the Directorate of Monetary Management at: - Phone: 381-7166, 381-8203, 381-8339, 381-8187