Full Terms & Conditions of access and use can be found at
http://www.tandfonline.com/action/journalInformation?journalCode=cbie20
Download by: [Universitas Maritim Raja Ali Haji] Date: 17 January 2016, At: 23:24
Bulletin of Indonesian Economic Studies
ISSN: 0007-4918 (Print) 1472-7234 (Online) Journal homepage: http://www.tandfonline.com/loi/cbie20
The Demography of Indonesia in Comparative
Perspective
Peter McDonald
To cite this article: Peter McDonald (2014) The Demography of Indonesia in
Comparative Perspective, Bulletin of Indonesian Economic Studies, 50:1, 29-52, DOI: 10.1080/00074918.2014.896236
To link to this article: http://dx.doi.org/10.1080/00074918.2014.896236
Published online: 24 Mar 2014.
Submit your article to this journal
Article views: 1085
View related articles
View Crossmark data
Bulletin of Indonesian Economic Studies, Vol. 50, No. 1, 2014: 29–52
ISSN 0007-4918 print/ISSN 1472-7234 online/14/00029-24 © 2014 Indonesia Project ANU http://dx.doi.org/10.1080/00074918.2014.896236
THE DEMOGRAPHY OF INDONESIA IN
COMPARATIVE PERSPECTIVE
Peter McDonald
The Australian National University
Having reduced its fertility rate over the past 40 years, Indonesia has reached a new demographic crossroad. Its fertility rate is now around 2.5 births per woman, which, if sustained, would add substantial numbers to Indonesia’s population in the future. There are concerns within Indonesia that the present level of population growth is an obstacle to continued economic development and, accordingly, that fertility should be reduced to the replacement level of 2.1 births per woman as soon as possible. Yet a comparative perspective indicates that countries such as Singa-pore, Japan, and Thailand are concerned about the effects that their very low rates of fertility are having on their labour forces and their rates of population ageing. This article suggests that with the right policy settings Indonesia can avoid this out-come yet continue to reduce its fertility. It discusses the implications of Indonesia’s population growth and distribution for its economy, as well as the poor quality of demographic data.
Keywords: population growth, age structure, urbanisation, fertility, mortality, population and development
JEL classiication: J11, J21, J61, O15
INTRODUCTION
Reducing the rate of population growth by reducing the fertility rate has been a central component of Indonesia’s development planning agenda since the late 1960s. This has also been the position of most comparator countries in Southeast Asia and East Asia. In effect, the aim has been to reduce the fertility rate to around two births per woman. Today that aim is close to being achieved in Indonesia, and in some provinces the fertility rate has fallen below this level. Indonesia’s population will continue to grow, however, because of ‘population momentum’, in which future population growth is driven by increasingly higher numbers of women in the reproductive ages and, hence, by more births than deaths.
One of the main justiications for the introduction in the 1960s and 1970s of policies to reduce fertility in developing countries was that in the 20 to 40 years following the fall in fertility, the age distribution of the population would con-centrate in the working ages. Without the economic burden of large numbers of children and large family sizes, nations and families alike could apply capital to productive investment rather than to consumption, resulting in higher GDP per capita. In the interim, the smaller numbers of children would mean that a greater
30 Peter McDonald
level of expenditure could be applied to the education of each child (Jones 1971). Over time, the country would experience a leap forward in human capital as the next, smaller generation was educated to higher levels. Universal primary educa-tion was an associated feature of these policies. Today this approach is referred to as the ‘demographic dividend’ or ‘demographic bonus’. It has been argued that the demographic dividend was a central component of the economic suc-cesses in countries such as Japan, South Korea, Taiwan, and Singapore (Bloom and Williamson 1998; Kinugasa 2013). Its logic was also part of the rationale for China’s adoption of the one-child policy. Deng Xiaoping was a major sponsor of the one-child policy, based on his expressed view that China would not be able to develop its economy or raise the living standards of its people unless the birth rate fell rapidly (Potts 2006). There is also a reasonable argument that the contrast-ing economic development pathways of Thailand, Indonesia, and the Philippines over the past 40 years have been associated with the relative timing and extent of the decline in fertility in these countries.
The use of fertility reduction as a policy approach to development arose out of the Cold War. In the years immediately after the Second World War, Ameri-can demographers such as Frank Notestein and Ansley Coale were able to con-vince the US government that declining fertility was a necessary prerequisite for economic development. This was something of a reversal of the previous theo-retical position, demographic transition theory, by which fertility fell only as a consequence of development (Szreter 1993). Demographic transition theory had strong theoretical underpinnings. In contrast, the view that fertility could fall prior to economic development was based not so much on a theory of how this might occur as on the consequences if it did occur. More than any other source, the evidence for this consequential argument was provided by the book Popula-tion Growth and Economic Development in Low-Income Countries (Coale and Hoover 1958). In the context of the Cold War battle for the hearts and minds of people in developing countries, lowering fertility was presented as a means to rapidly increase living standards, so that they would be won over to the capitalist way.
By 1967, 30 heads of government, including the newly appointed General Soe -harto, acting president of Indonesia, had signed a strikingly worded Declaration on Population:
As Heads of Governments actively concerned with the population problem, we
share these convictions: We believe that the population problem must be recog-nised as a principal element in long-range national planning if governments are
to achieve their economic goals and fulill the aspirations of their people. We be -lieve that the great majority of parents desire to have the knowledge and the means to plan their families; that the opportunity to decide the number and spacing of children is a basic human right. We believe that lasting and meaningful peace will depend to a considerable measure upon how the challenge of population growth is met. We believe the objective of family planning is the enrichment of human life, not its restriction; that family planning, by assuring greater opportunity to each per-son, frees man to attain his individual dignity and reach his full potential. (Turbay Ayala and Caradon 1968, 3)
This statement has been the mainstay of population policy in Indonesia since 1967. A vigorous national family-planning program began in Indonesia in the 1970s, and, as I describe later in this article, Indonesia’s fertility rate has more
The Demography of Indonesia in Comparative Perspective 31
than halved since that time. The centre point of Indonesian population policy has been, and still is, to reduce the rate of population growth as rapidly as possible by controlling fertility.
The family-planning approach to development aims to reduce the national fertility rate to around two births per woman, on average. This level of fertil-ity produces zero population growth in the longer term. In several countries in Southeast and East Asia, however, fertility has fallen well below two births per woman, giving rise to concerns about rapid ageing of their populations and the adequacy of future labour supplies. Japan, Taiwan, the Republic of Korea, and Singapore have all taken pronatalist stances in a desire to increase their fertil-ity rates (Westley, Choe, and Retherford 2010). Thailand has also moved in this direction, in its 11th National Economic and Social Development Plan 2012–2016 (NESDB 2012). While the efforts to reduce fertility from high levels to around two births per woman have been remarkably successful in most cases, attempts to raise the birth rate from very low levels, both in Europe and in East Asia, have been largely unsuccessful. In recognition of this, Singapore has recently published a white paper advocating relatively large-scale immigration in order to slow the ageing of its population and to meet current and future labour demand (NPTD 2013). As described below, migration to Singapore has run at a very high level in the past ive to eight years. In demographic terms, immigration can be effective in offsetting very low fertility in a country with a small population, like Singapore, but the levels of immigration required to offset very low fertility in large popula-tions, such as those of Japan or Thailand, or possibly in Indonesia in the future, are not credible. There are also cultural obstacles to large-scale migration—as evi-denced, to this point, by Japan. In the context of its very low fertility rate, there is considerable debate about the appropriateness of China continuing its one-child policy (Feng, Cai, and Gu 2012).
The spectre of very low fertility is very much on the policy agenda in countries where fertility has fallen to or is approaching two births per woman. Given the experience of other Asian countries with longer histories of fertility decline, what approach should Indonesia be taking to its future level of fertility? Will internal migration from higher-growth provinces be able to compensate for labour short-ages that may arise in low-fertility regions? How rapid is the ageing of Indonesia’s population and how big an issue is this for policy? Migration to the metropolises of East Asia has led to the populations of the cities being relatively young while the rural areas are ageing rapidly. What are the implications of demographic dif-ferences in the core and the periphery? Will Indonesia supply labour to coun-tries in the region (and further aield) experiencing labour shortages? This article addresses these questions in comparative perspective, but irst it gives attention to uncertainties about the demography of Indonesia—it is dificult to plan for the future if there is uncertainty about the present.
CONTEMPORARY DEMOGRAPHIC UNCERTAINTY
In contrast with the relatively high level of certainty about Indonesian demo-graphic trends that underpinned development planning in the 1970s and 1980s, today there is a great deal of uncertainty. This uncertainty, which is hampering the formulation of new policy initiatives, has arisen for several reasons. Most important, dificulties associated with the conduct of the 2000 Population Census
32 Peter McDonald
of Indonesia affected the results in ways that have not yet been adequately assessed. The 2000 census was conducted relatively soon after the country moved to a democratic political system and decentralised management of core-service delivery (Hull 2001). While the need for data to be available at the district ( kabu-paten) level of government was expected, the 2000 census was carried out soon after the 1997–98 Asian inancial crisis. As a result, the ambitious aims of the cen -sus extended well beyond the budget capacity to achieve them. Terry Hull has reported on the deiciencies of the 2000 census:
The resulting data set was seriously lawed in at least two ways. First, shortcomings
in the training and management of interviewers meant that large numbers of peo-ple and households were not properly canvassed. It is known that some
interview-ers simply failed to cover their territories adequately, while othinterview-ers apparently illed in ictitious material, or copied information from local government family registra -tion data rather than seeking out and interviewing the householders. (Hull 2009)
In addition, enumeration was dificult in certain regions of the country, for rea -sons of political insecurity. The technology used to scan the paper questionnaires was also not of suficiently high quality, and the scanning machines often con -fused digits such as 8, 3, and 5. The relatively low quality of the 2000 census dis-couraged analysis of its results and thus contributed to a vacuum of demographic information that extends back at least to the 1990 census. This vacuum has led to considerable contemporary uncertainty about Indonesia’s demography. Some assert that Indonesia is now experiencing a new ‘population explosion’ (see dis-cussion below). This assertion is based on intercensal population growth rates derived from the raw counts of population in the successive censuses, as shown in the second column of table 1. By these numbers, population growth stopped falling in Indonesia as far back as 1990 and there has been a slight rise in the past decade. The implication of this result is that the Indonesian fertility rate has hardly fallen at all or has risen in the past two decades.
Uncertainty about the trend in the growth rate of the Indonesian population is evidenced by the substantial changes that were made to the estimated intercensal growth rates between the 2010 and the 2012 Revisions of World Population Pros-pects, prepared by the United Nations (UN) Population Division (table 1). Between June 2011 and June 2013, the UN Population Division switched its viewpoint on Indonesia’s population growth from a strong and steady downward trend to one
TABLE 1 Intercensal Population Growth in Indonesia, 1971–2010 (%)
Raw census counts UN 2010 Revision UN 2012 Revision
1971–1980 2.30 2.42 2.43
1980–1990 1.95 2.01 2.05
1990–2000 1.42 1.46 1.57
2000–2010 1.41 1.17 1.41
Source: Author’s calculations based on data from BPS (Badan Pusat Statistik) and the United Nations (UN) Population Division’s World Population Prospects.
The Demography of Indonesia in Comparative Perspective 33
that mirrors the trend based on the raw counts. Table 2 compares the raw cen-sus counts of population with the UN estimates in the 2010 and 2012 Revisions, respectively. The UN in its 2012 Revision is implying that the 1971 and 1980 raw counts overestimated the actual population, while the 1990 raw count was the same as the UN estimates in the 2012 Revision. The extent of the undercount is then considered to be the same in the carefully taken 2010 census (Hull 2010) as it was in the poorly taken 2000 census. The logic of the changes in the UN estimates is somewhat mystifying, which underlines the need for an intensive investiga-tion of Indonesia’s demography from 1970 to 2010.1 Varying estimates continue to
appear with the new oficial population projections showing the estimated popu -lation of Indonesia in 2000 to be 205.1 million, lower than the census count and almost four million lower than the latest UN estimate for 2000 (BPS 2014).
To add to the argument of uncertainty, as described in appendix 1, the recorded population growth rates based on raw counts for many of the provinces of Indo-nesia over the past three decades (1980–90, 1990–2000, and 2000–2010) display trajectories that challenge plausibility. For example, several provinces show a pat-tern in which the growth rates in 1990–2000 were considerably lower than those in 1980–90 and 2000–2010.2
Uncertainty applies not only to the population total but also to some of its char-acteristics. From the results of the 2010 post-enumeration survey (PES), 20% of the population had inconsistent ages reported between the census and the PES and 35% had inconsistent levels of education. Marital status was inconsistently reported for 10% of the population (BPS 2011a).
As discussed below, uncertainty about population growth in Indonesia is founded on poor measurement of the components of its population change:
1. Such an intensive investigation will be undertaken through an Australian Research Council Linkage Project grant awarded to researchers at The Australian National
Universi-ty and The UniversiUniversi-ty of Adelaide, in association with the Australian Government Depart -ment of Foreign Affairs and Trade, the United Nations Population Fund in Indonesia, BPS, and Indonesia’s National Family Planning Coordination Agency (Badan Kependudukan dan Keluarga Berencana Nasional).
2. West Sumatra, Jambi, Lampung, DKI Jakarta, DI Yogyakarta, South Kalimantan, East Kalimantan, Southeast Sulawesi, Maluku, and West Papua.
TABLE 2 Excess of United Nations Population Estimates over Raw Census Counts (%)
UN 2010 Revision UN 2012 Revision
1971 1.5 –2.2
1980 2.6 –1.0
1990 3.2 0.0
2000 3.6 1.5
2010 1.1 1.5
Source: Author’s calculations based on data from BPS (Badan Pusat Statistik) and the United Nations (UN) Population Division’s World Population Prospects.
34 Peter McDonald
fertility and mortality rates and net international migration. Indonesia has failed to develop reliable ways of measuring these components of change. Along with the current age structure, these components of change are the determinants of past and future population growth.
INDONESIA’S DEMOGRAPHY IN COMPARATIVE PERSPECTIVE
To place Indonesia in comparative perspective, I use demographic data provided by the UN Population Division in its 2012 Revision.3 I compare Indonesia with
12 other countries in the Asia-Paciic region: Iran, India, Bangladesh, Myanmar (Burma), Singapore, Malaysia, Thailand, Vietnam, China, Japan, the Philippines, and Australia. This group includes all the major countries of Southeast Asia, as well as China, India, and Iran as countries with large populations in Asia. It also includes Japan, Singapore, and Australia as regional developed-country compar-ators. As shall be seen, the conventional wisdom that developing countries have high rates of population growth and developed countries have low rates is not borne out by this regional comparison.
Population Size
The irst and most obvious point to make is that Indonesia’s population is very large, by now the fourth largest in the world. While population size tells us lit-tle about economic or social development, McNicoll (1999) and others (Jackson and Howe 2008) argue that population size matters more and more as the eco-nomic disparities between countries become less divergent. Conventional mili-tary power also depends on how many soldiers a country has in its army, given the increasing capacity to arm those soldiers relatively cheaply. Writing in 1999, McNicoll said that Indonesia ‘is likely to retain an effectively heavyweight if not hegemonic role in Southeast Asia’, very largely because of its population size (McNicoll 1999, 423).
Conversely, any positive rate of growth applied to a very large population gen-erates a very large number of additional people. This consideration has inluenced the minds of policymakers in Indonesia for decades. Today, in Indonesia, there is considerable concern in many circles that current population growth constitutes a ‘population explosion’ (ledakan penduduk) that has negative implications for almost every aspect of life.4 The concern has been expressed most signiicantly by
Sonny Harmadi, director of the Demographic Institute of the University of Indo-nesia (for one example, see Harmadi, ‘Pesan Kependudukan 2011’ (Kompas, 11 Jan 2011). Harmadi was expressing concern about a population explosion before the release of the 2010 census count and, using raw rates similar to those shown in the second column of table 1, he conirmed his fear after the census results became available. His concerns have been mirrored by other luminaries such as
3. This is not to say that I endorse the estimates made by this organisation for Indonesia.
Indeed, prior to more intensive analysis, I ind the UN estimates over time to be very con -fusing. However, the 2012 Revision revised the UN’s prior estimates substantially for other countries besides Indonesia. Thus, in the interests of maintaining cross-national consist-ency, I have used the estimates from the 2012 Revision.
4. This concern is immediately evident from an online search of ‘ledakan penduduk’.
The Demography of Indonesia in Comparative Perspective 35
the then head of the Coordinating Board for National Family Planning (Badan Koordinasi Keluarga Berencana Nasional [BKKBN]) Sugiri Syarief (Antara News, 25 Nov 2011) and presidential candidate Prabowo Subianto (Tribunnews.com, 30 May 2013).
Rates of Population Growth
In policy terms, the important issue is not so much the current level of Indone-sia’s population growth as its trend. If the aim is to reduce population growth to zero, the UN 2010 Revision data for Indonesia are evidence providing support for more of the same policy approach; the raw data and the UN 2012 Revision data are evidence calling for a radical change in policy. My own sense, subject to revision after more intensive investigation, is that the Indonesian fertility decline may have been exaggerated in the decades prior to 2000. The population growth rate has probably been falling consistently, but with levels of growth higher than those shown in table 1.
Figures 1 and 2 show Indonesia’s rate of population growth (based on UN 2012 Revision data) in comparison with those of 12 other countries of the region for two periods of time. In 1970–75, the nine developing countries conirmed their expected pattern of high rates of growth (above 2% per annum) while the three more developed countries (Japan, Australia, and Singapore) had the lowest rates. At 2.5%, Indonesia had the ifth highest rate. By 2005–10, Indonesia had the sixth highest rate, 1.4%, but only because two of the developed countries, Singapore and Australia, had jumped from the low end to the high end. Both these countries were by then supporting higher population growth through large-scale migration programs (igure 4). Both were also producing their own form of ‘demographic dividend’ by importing workers directly into the younger working-age groups.
Indonesia’s 2005–10 growth rate was a little higher than that of Iran, a coun-try in which recent policy debate has focused on whether the birth rate should be stimulated (Abbasi-Shavazi, pers. comm.). Iran fears that its fertility is falling below replacement levels and that it will experience the anguish about very low fertility now expressed in countries such as Japan, South Korea, Singapore, and Thailand. There is no such concern in Indonesia, despite the apparent similarity of current population growth rates.5
Figure 4 shows the breakdown of recent population growth in the selected coun-tries into net migration and natural increase. Most noticeable is Singapore’s very high net migration rate of 1.9% per annum. Australia also has a high net migra-tion rate of more than 1% per annum. The UN estimates that net internamigra-tional migration for all the other countries is very small in relative terms. For Indonesia, a net outmigration of 148,000 persons per annum is estimated for 2005–10, but this may well be an underestimate. Hugo (2009), citing Ananta and Ariin (2008),
5. The UN projects Indonesia’s and Iran’s rates of population growth to be similarly
posi-tive in 2030–35 (igure 3). Indonesia’s rate of 0.66% per annum implies an increase of popu -lation at that time of almost two million people per annum. The 2030–35 projected popu-lation growth rates show that large countries like India, Bangladesh, and the Philippines would still have quite high rates of growth. At the other extreme, Thailand, Japan, and China will have relatively large negative rates of growth, which is highly concerning now at least to Japan and Thailand and, predictably, to China at some future point.
FIGURE 1 Annual Rate of Population Growth, Selected Countries, 1970–75 (%)
Japan Australia Singapore Vietnam India China Myanmar (Burma) Malaysia Indonesia Bangladesh Iran Thailand Philippines
0.0 0.5 1.0 1.5 2.0 2.5 3.0
Source: United Nations Population Division, World Population Prospects: The 2012 Revision.
FIGURE 2 Annual Rate of Population Growth, Selected Countries, 2005–10 (%)
Japan Thailand China Myanmar (Burma) Vietnam Bangladesh Iran Indonesia India Philippines Malaysia Australia Singapore
0.0 0.5 1.0 1.5 2.0 2.5 3.0
Source: United Nations Population Division, World Population Prospects: The 2012 Revision.
FIGURE 3 Annual Rate of Population Growth, Selected Countries, 2030–35 (%)
Japan Thailand China Myanmar (Burma) Vietnam Singapore Iran Bangladesh India Indonesia Malaysia Australia Philippines
–0.5 0.0 0.5 1.0 1.5 2.0 2.5
Source: United Nations Population Division, World Population Prospects: The 2012 Revision.
FIGURE 4 Annual Rates of Net Migration and Natural Increase, Selected Countries, 2005–10
(%)
Japan Thailand Singapore China Australia Myanmar (Burma) Vietnam Bangladesh Iran Indonesia India Philippines Malaysia
–0.5 0.0 0.5 1.0 1.5 2.0 2.5
Net migration Natural increase
Source: United Nations Population Division, World Population Prospects: The 2012 Revision.
38 Peter McDonald
states that there were 2.7 million documented migrants from Indonesia in other countries, in addition to large numbers of undocumented migrants. In contrast, if most of these migrants are temporary contract workers who will eventually return to Indonesia, which seems to be the case, this would be consistent with low net migration.
Age Distributions
Associations between economic development and demography are based most often on the nature of the age distribution of the population—in particular, on the balance between those of working age and those in the younger and older dependent ages. Countries with high birth rates have relatively large numbers of young dependents; countries with low birth rates, in time, have relatively large numbers of old dependents. This section discusses Indonesia’s age distribution in comparative perspective. Comparison is made with Thailand, in particular, because it has recently moved to implement pronatalist policies, whereas debate in Indonesia is concerned with policies to address a perceived births-led popula-tion explosion; yet both countries had similar age distribupopula-tions around 1970, and both have experienced substantial fertility declines.
In 1970, 43% of Indonesia’s population was aged 15 and under, compared with 44% of Thailand’s (igures 5 and 6). Thailand’s rate of population growth at the time was a little higher (igure 1), because its fertility rate was higher. But, since then, Thailand’s rate of growth (and its fertility) has fallen faster than that of Indo-nesia. The varying speeds of decline have had differing effects on the age struc-tures of the two countries (igures 5 and 6) and important implications for policy. The Thai age pyramid in 2010 is undercut at the younger ages; the largest ive-year age group is those aged 35–39. As the large cohort aged 30–49 in 2010 has passed through the working ages, it has, in theory, generated the demographic dividend in a classic form, because the numbers have been smaller at the younger and older ages. As this age group moves into the older ages, also in classic fash-ion, the population will age considerably and population ageing will emerge as a central issue of population policy. The UN projects that the percentage of the population aged 65 and over in Thailand will increase from 9% in 2010 to 23% in 2050, a higher level than is projected for Australia in 2050 (igure 7). In Australia, migrants and their subsequent births, along with a relatively high birth rate, are projected to keep the population at the young end of the spectrum of developed countries (McDonald and Temple 2010). In 2012, the Thai government shifted its policy agenda to one that is similar in form to those of many countries in Europe and East Asia, where fertility rates are very low (NESDB 2012). The policy pro-posals include pronatalist inancial measures (such as lower taxes for those with more children) and family-friendly workplace policies, including lexible work -ing hours, paid parental leave, and childcare.
The new Thai agenda also promotes policies for older people, including incen-tives to continue working rather than to retire, tax incenincen-tives for self-support through personal savings, the development of a national income support scheme for the aged, systems and incentives for the support of older people by their fami-lies, and better health and welfare infrastructure. The Thai government’s policy document also focuses on improving the productivity of the economy through higher human capital and higher multifactor productivity. The simple argument is that a richer country, one with high GDP per capita, will be in a better position
FIGURE 5 Age Distributions of Indonesia, 1970, 2010, and 2050
Source: United Nations Population Division, World Population Prospects: The 2012 Revision.
Note: The projected age distribution for 2050 is represented by the dashed lines.
FIGURE 6 Age Distributions of Thailand, 1970 and 2010 (population in millions)
Source: United Nations Population Division, World Population Prospects: The 2012 Revision.
40 Peter McDonald
to support its aged population (see Lutz and K. C. [2013] for an exposition of this argument).
Population ageing will occur much more slowly in Indonesia. Owing to a slower decline in fertility between 1970 and 2010 than was the case in Thailand, Indonesia’s age pyramid in 2010 is not as undercut: the largest age group is the youngest (those aged 0–4), and the size of this group may well be understated. By 2010, 30% of Indonesia’s population was aged 15 and under, compared with 19% of Thailand’s. According to the UN projections, the percentage aged 15 and under in Indonesia in 2050 will be 20%, still higher than the Thai percentage in 2010.
Having more time to adjust to an ageing population could be an advantage for Indonesia. Figure 7 provides one view of the country’s demographic future. It shows a projection of Indonesia’s present population and age structure to 2050, based on the assumption that the fertility rate will fall to 2.1 births per woman by 2015. The result shows substantial population ageing by 2050; but the age struc-ture remains relatively lat-sided, and the population growth rate at that time would be approximately zero. By this projection, the total population of Indone-sia in 2050 would be 323 million. The policy question for IndoneIndone-sia is whether a slow movement to zero population growth would provide better outcomes than the pathway that Thailand is on, despite the ultimately large population size of Indonesia. Should a country trade a larger population size for a more sustainable longer-term age structure? The policy approaches being taken by countries facing population decline and very rapid ageing suggest that they would prefer to trade a somewhat higher population size for an age structure that was more amenable to economic and social policy.
The projection in igure 5 is only one potential pathway for Indonesia. Some would argue that Indonesia could attain low fertility and then face problems similar to those of Thailand. Others would argue that Indonesia’s future may look more like India’s, in which only 14% of the population would be aged 65 and over in 2050 (igure 7). My own sense is that ageing in Indonesia will occur slowly, and FIGURE 7 Share of Population Aged 65 and Over, Selected Countries, 2010 and 2050
(%)
Philippines India Bangladesh Malaysia Myanmar (Burma) Indonesia Iran Vietnam Australia Thailand China Singapore Japan
0 5 10 15 20 25 30 35 40
2010 2050
Source: United Nations Population Division, World Population Prospects: The 2012 Revision.
The Demography of Indonesia in Comparative Perspective 41
that Indonesia’s fertility is very unlikely to be below 1.5 births per woman in the foreseeable future, if ever. Nevertheless, the demographic future of Indonesia is inherently uncertain and, because of poor data measurement and a lack of accu-racy about the prevailing levels of fertility and mortality, more uncertain than for other comparator countries. Demographic futures are important in areas of plan-ning with long lead times, such as large-scale infrastructure and education and health services.
Fertility
Fertility in Indonesia is estimated directly and indirectly. Direct estimates are obtained from the results of the infrequent Indonesian Demographic and Health Survey (IDHS). Indirect estimates are obtained every 10 years from the census results, by using the own-children method, which links children in a household to their mothers and produces a table showing the ages of children by the ages of their mothers (see Abbasi-Shavazi [1997] for an evaluation of the method).
The census-based own-children method is not robust to under-enumeration in the census of the number of children (for example, those aged 0–4) relative to the number of women of childbearing age, and this may be a considerable problem in Indonesia.6 In countries with relatively good vital registration data, such as India
and Iran, the own-children estimates of fertility are lower than those based on birth registration data.
In the IDHS, a sample of women is asked to report the details of all their preg-nancies, which makes it possible to calculate fertility directly from the number of births reported by the women surveyed. The accuracy of the result depends on whether the sample truly represents the population. In the last two IDHS col-lections, in 2007 and 2012, the age-speciic proportions of married women were much higher than those recorded in other data collections, such as Susenas and the 2000 and 2010 censuses. In other words, there is strong evidence that the IDHS tends to miss women who are not married. Single women have few children, so the fertility rates from the IDHS tend to be too high (assuming that the number of births is accurately reported).7
In summary, the census-based own-children estimates of fertility are likely to underestimate fertility in Indonesia, whereas the IDHS is likely to overestimate it. IDHS estimates suggest that Indonesian fertility rates have hardly changed since the mid-1980s, and that the decline has stalled at around 2.6 births per woman (Hull and Hartanto 2009; Hull pers. comm.). By the own-children estimates from the censuses, fertility fell to around 2.3 births in the late 1990s, but rose slightly to about 2.4 births in the latter years of the 2000s (BPS 2011b).
6. For example, if we estimate the population aged 0–4 at the time of the 2000 census by reverse surviving the population aged 10–14 at the 2010 census, this estimate is approxi-mately 12% higher than that recorded in 2000. The own-children estimate of the total fer-tility rate from the 2000 census was 2.27 births per woman, but with a 12% correction it would have been 2.54. This is a large variation to consider when trying to measure the trend in fertility.
7. The 2007 IDHS estimated the total fertility rate to be 2.57 in 2002–3, and the 2012 IDHS estimated it to be 2.60 in 2007–8. If the IDHS proportions married by age are adjusted to those obtained in the 2000 and 2010 censuses, the IDHS estimates of fertility for these years fall respectively to 2.35 and 2.20 (Hull and Hartanto 2009; Hull pers. comm.).
42 Peter McDonald
The argument has been made that Indonesia’s family-planning program has been disrupted by decentralisation (Habsjah 2009; Hull and Hartanto 2009), and that this is why fertility has remained constant for a long period (as shown by the IDHS estimates). This argument has also been used to justify a rise in fer-tility, using own-children estimates, between the 2000 and 2010 censuses. It has also been suggested that democracy has stimulated a shift to a more conservative (Islamic) society, and that this shift has stimulated the birth rate. On the other side, fertility has fallen sharply in almost all other Islamic countries, and sharp rises in education and urbanisation are very likely to have pushed the Indonesian fertility rate downwards. The age pattern of fertility also shifts to older ages between the own-children estimates of 2000 and 2010 (BPS 2011b). This kind of shift in the age pattern of fertility is usually associated with a fall in the fertility rate.
For comparative purposes, igure 8 uses the estimates provided by the UN Pop -ulation Division (2012 Revision). The estimates show Indonesia’s fertility level drifting up in rank from the ninth highest among the 13 countries around 1970 to the second highest around 2010. The UN estimates are more in keeping with the IDHS estimates than with the census-based estimates, despite the criticisms that have been made of the IDHS estimates. As a consequence, Indonesia’s fertility around 2010 is estimated to be above that of India, Malaysia, and Bangladesh. Iran has the largest downward movement, from 7.0 births per woman in 1985 to FIGURE 8 Total Fertility Rates, Selected Asian Countries, 1970, 1985, 1995, and 2010
(births per woman)
Singapore Japan Thailand China Iran Australia Myanmar (Burma) Vietnam Bangladesh Malaysia India Indonesia Philippines
0 1 2 3 4 5 6 7
1970 1985 1995 2010
Source: United Nations Population Division, World Population Prospects: The 2012 Revision.
The Demography of Indonesia in Comparative Perspective 43
1.85 in 2010 (see Abbasi-Shavazi, McDonald, and Hosseini-Chavoshi 2009). The UN estimates that the fertility rates of China and Thailand have now fallen into the ‘very low’ range, under 1.5 births per woman. The Philippines, not unexpect-edly, has the highest fertility rate, and there are those who argue, in keeping with the demographic-dividend theory, that high fertility has been an obstacle to eco-nomic growth in that country.
The latest UN estimates of fertility for Indonesia question the conventional wisdom of rapidly declining fertility. They indicate that the Indonesian govern-ment may need to take stronger action in addressing the country’s stalling decline in fertility. Yet if the UN estimates are too high, as some would argue they are, an overly vigorous approach to fertility reduction may push Indonesian fertility rates in the direction of ‘very low’ fertility—which is also not desirable. The ideal outcome for Indonesia is to have fertility fall to around two births per woman and then be sustained at that level. The countries that have achieved this (without fertility falling to very low levels) have accepted that couples may have more than two children, and have also provided support for families with children.
Mortality
While there is uncertainty about the level of fertility in Indonesia, there is no reli-able information about mortality for people over the age of ive. Planners need accurate information on adult mortality, both to project the numbers at older ages and to plan aged-related services. This section shows that a change in the method of measurement could transform Indonesia from one of the best perform-ers among the comparator countries in reducing mortality to one of the worst.
The conventional way of measuring adult mortality in Indonesia is to associ-ate a model life table—most commonly that of Coale and Demeny’s (1966) West model—with the estimate of child mortality (mortality below age ive) to obtain estimates of mortality at all other ages and life expectancy at birth. The West model life tables are based very largely on the mortality experience in Europe, Australia, and New Zealand in the 19th century, and questions remain about their appropriateness to countries like Indonesia in the 21st century because the regime of causes of death and the state of medical knowledge are very different in today’s developing countries compared with 19th-century Western experience.
Child mortality in Indonesia is most commonly estimated by using data on the number of live births that women have had and the number of those live births that are still alive at the time of the census or the survey, according to the women’s ages at the time of the survey. The methodology dates back to the 1960s and was designed to measure child mortality in situations where mortality is very high— say, around 200 deaths under the age of ive from 1,000 live births—and where childbearing begins at a young age. When child mortality falls to a much lower level and childbearing begins at older ages, as is the case in Indonesia today, this method is not robust enough to measure the much smaller movements in child mortality.8 Applying this method to 2010 census data, Statistics Indonesia (Badan
Pusat Statistik [BPS]) estimated the rate of child mortality to have been 30 deaths per 1,000 births in 2006 (BPS 2011c). Another method of estimation, used in the
8. If the age distribution of mothers at the time of birth were to be older than the distribu-tion assumed in the model, the level of child mortality would tend to be underestimated.
44 Peter McDonald
IDHS, involves asking women about the dates of birth and death (if applicable) of each of their children. Such data can be used to make direct estimates of child mortality. This method, however, tends to underestimate child mortality because the birth and death of children who died shortly after birth are often not reported. The most recent survey shows a child mortality rate, based on this method, of 32 deaths per 1,000 live births during 2008–12 (BPS et al. 2012). This estimate is largely consistent with that of the 2010 census, but both may be consistently low.9
In its 2012 Revision, the UN Population Division estimated life expectancy in Indonesia in 2005–10 to be 69.6 years (igure 9). This is consistent with the estimate for 2006 (70.7 years) published by BPS (2011c). However, Muhidin and Nasrun’s (2012) estimate of 60.8 years from the 2010 census, which also refers to about 2006, is a very different result.10 These contrasting estimates show that the level of
mor-tality in Indonesia is highly speculative, and much more so than the fertility rate. Figure 9 shows that Indonesia’s life expectancy, at 60.8 years, would easily be the lowest among the comparator countries, the lowest of which is currently Myan-mar (Burma), at 64.2 years. Much consideration needs to be given to improving the estimation of mortality in Indonesia.
Population Distribution and Internal Migration
The movement of population from densely settled Java to other islands is a policy approach that originated in the Dutch colonial period, and the idea of population
9. There is little consistency at the provincial level between the census-based estimates and the IDHS estimates—the former appears to be particularly low in the eastern provinces. 10. Muhidin and Nasrun (2012) also use West model life tables, but they include an analy-sis of the change in age cohort sizes between the 2000 and 2010 censuses (the intercensal survival method).
FIGURE 9 Life Expectancy at Birth, Selected Countries, 1970–75 and 2005–10 (years)
Myanmar (Burma) India Philippines Bangladesh Indonesia Iran Thailand Malaysia China Vietnam Singapore Australia Japan
0 10 20 30 40 50 60 70 80 90
1970–75 2005–10
Source: United Nations Population Division, World Population Prospects: The 2012 Revision.
The Demography of Indonesia in Comparative Perspective 45
redistribution is embedded in the minds of most Indonesians at primary school. In addition, fertility fell earlier and further in the provinces of Java than in those outside Java. For these reasons, we would expect a redistribution of population away from Java. Yet urban economic development has been concentrated in Java’s largest cities, which have grown substantially. The once-wide boundaries of DKI Jakarta long ago became inadequate to contain the city’s growth, and Jakarta now abuts on the neighbouring cities of Depok, Bekasi, and Tangerang. This section considers the extent to which the redistribution of population from Java to the outer islands is taking place today.
The net effect of these demographic trends is that Java has grown a lot more slowly than all the other regions of Indonesia. The fastest growing region has been Kalimantan; East Kalimantan’s population increased almost ive times during 1971–2010 (table 3). Growth within Java is quite diverse, with West Java (including Banten) increasing 2.5 times but Central and East Java each increasing only 1.5 times. The high growth rate of West Java relects Jakarta’s spreading into that province.
The slower growth of Java, at least in recent years, owes little to outmigra-tion from Java. Table 4 shows that net migraoutmigra-tion from Java during 2005–2010 amounted to only 354,000, or just 71,000 per annum, a number that is trivial com-pared with the total population of the island (BPS 2011d). The table also shows that DKI Jakarta, which has experienced net outmigration since the late 1980s, recorded negative net migration of 239,000 in this period, as people moved out of the province to housing estates in the areas of West Java and Banten contiguous with DKI Jakarta. The even larger in-migration to West Java and Banten shown in table 4 can also be attributed to the growth of the megacity of Jakarta. Central Java is the largest source of out-migrants, with a net loss of 136,000 per annum in the ive years before the 2010 census.
The dificulty of deining city boundaries hinders cross-country comparisons of cities and their growth. For example, the UN Population Division recorded the population of the urban agglomeration of Jakarta in 2010 to be 9.6 million, which
TABLE 3 Growth of the Regions of Indonesia, 1971–2010 (ratio of population, 2010 to 1971)
Java 1.80 Sumatra 2.43
Kalimantan 2.68 Remainder 2.23
Sulawesi 2.04 Indonesia 1.99
Source: Author’s calculations based on data from BPS.
TABLE 4 Net Migration, Provinces of Java, 2005–10
Banten 272,000 East Java –285,000
Central Java –678,000 West Java 453,000
DI Yogyakarta 124,000 Java –354,000
DKI Jakarta –239,000
Source: BPS (2011d).
46 Peter McDonald
is precisely the population recorded for the province at the 2010 census. Yet it is accepted that the city has now sprawled into West Java and Bantan, and that its real urban agglomeration is considerably larger.11
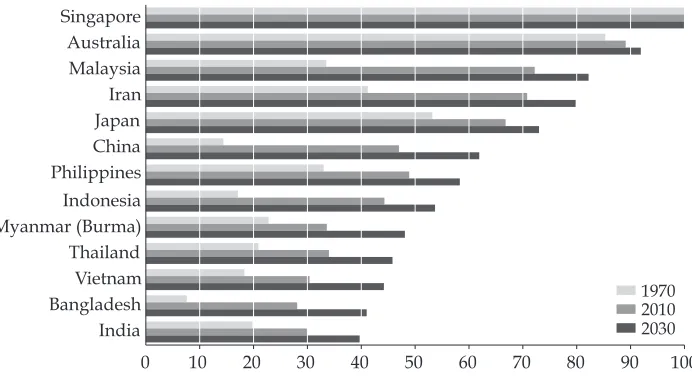
Deinitions of rural and urban areas are also notoriously inconsistent across countries. Glossing over this problem, igure 10 shows that urbanisation has been a very powerful force in Indonesia since 1970. Yet in 2010, the urban population remained below 50% of the total population (a higher proportion than in ive of the comparator countries: Myanmar [Burma], Thailand, Vietnam, Bangladesh, and India). The World Bank has recently argued that urban agglomerations pro-vide major advantages for development, and that Indonesia’s relatively high level of urbanisation may present it with considerable opportunities to increase productivity (World Bank 2013). However, the UN’s projections of urbanisation suggest that the growth of the urban segment will be slow in all the developing countries shown in igure 10. In Indonesia, for example, the urban proportion is projected to increase from 44% to just 54% in the next 20 years. This slow rate of urbanisation does not seem to be in keeping with the increases in education that will take place in this period. The UN projections also do not take into account the results of the 2010 Indonesian census, which shows a higher level of urbanisation in 2010 (49.8%) than the 44% taken as the starting point for the UN projections (BPS 2011e). Probably more reliably, new oficial estimates project urbanisation in Indonesia reaching 66.6% in 2035, 77.6% in Java, and a remarkable 89.9% among the 85 million people who are projected to be living in Jakarta, West Java, and Banten by 2035 (BPS 2014).
11. Around 23 million according to Knowledge@Wharton and around 26 million according to World Atlas (http://www.worldatlas.com/citypops.htm).
FIGURE 10 Share of Population Living in Urban Areas, Selected Countries, 1970, 2010, and 2030
(%)
India Bangladesh Vietnam Thailand Myanmar (Burma) Indonesia Philippines China Japan Iran Malaysia Australia Singapore
0 10 20 30 40 50 60 70 80 90 100
1970 2010 2030
Source: United Nations Population Division, World Urbanization Prospects: The 2011 Revision.
The Demography of Indonesia in Comparative Perspective 47
CONCLUSION AND POLICY DIRECTIONS
The central conclusion from the analysis is that there is a very deinite need for clarity about the trends of fertility, mortality, and population growth in Indonesia. We need this clarity in order to conclude whether population growth and fertility ceased declining in the 1990s or whether they have continued to decline in line with long-term Indonesian population policy. It is the trends that are important, not the levels. At present, without this clarity, policy is torn between placing a major new emphasis on family planning, especially outside of Java, or proceeding with the present settings.
Some of Indonesia’s regional comparators have very low fertility rates, which will see their populations age excessively rapidly at the same time as the size of their labour forces starts to fall. The aim of fertility control programs in develop-ing countries in Asia was not to reduce fertility to these very low levels but to have fertility stop falling at about the level of an average of two births per woman. With fertility at two births per woman, the population ages at a slower pace and the size of the labour force does not fall, although the labour force will age. Pro-moting multifactor productivity, especially by reskilling the labour force, can then lead to reasonable economic growth and increases in GDP per capita, even though the labour force is not growing.
In countries such as Thailand, Singapore, South Korea, Japan, and Taiwan, very low fertility is associated with high rates of non-marriage and higher levels of female participation in the labour force. Women have been educated to the point where they are able to have well-paid, full-time jobs, but the possibilities for them to combine work with family are very restricted. So, many women do not marry or, if they do marry, have one or no children. There is little evidence of these cir-cumstances applying in Indonesia today. Marriage is still close to universal and still occurs, on average, at a relatively young age for women. The irst birth is usually not delayed within the marriage. In the big cities, mothers of young chil-dren generally do not have full-time jobs in the formal sector. In the 2010 Greater Jakarta Transition to Adulthood Survey, 67% of mothers aged 20–34 years were not employed (McDonald 2011). At the wealthier and higher-paid end of the spec-trum (in the top 6%–7% in Jakarta), mothers of young children have household help to assist them in combining work and family. The province of Jakarta has the lowest fertility rate in Indonesia (1.82), based on the own-children estimates of fertility from the 2010 census (BPS 2011b)—still well above the very low fertility bound of 1.5 births per woman.
A declining population in a crowded island like Java can be desirable for many reasons. Yet when numbers decline because of a large and rapid fall in the num-ber of births, it distorts the age structure of the population. If a population is to decline, it is better for the decrease to occur slowly rather than rapidly. It seems that Indonesia and Java are on this latter path. Nevertheless, the gradual intro-duction of family-support policies like early-childhood education and care, par-ticularly in urban areas, will help to ensure that fertility lands softly around the replacement level (McDonald 2011).
The UN Population Division projects only relatively modest growth of Indo-nesia’s urban population. With the substantial exception of Greater Jakarta, other major cities in Indonesia seem likely to remain at a relatively manageable size. As the Indonesian economy modernises and diversiies, it can be expected that urbanisation will be stimulated to an extent similar to the latest oficial projections.
48 Peter McDonald
In China, this process has involved the growth of a very large number of medium-sized cities well connected by transport infrastructure. Even some of China’s smaller towns have grown by ‘urbanisation in situ’ (Zhu 2002), which has taken the pressure off its megacities (although they still face substantial dificulties). It would be wise for Indonesia to follow a similar strategy, but this would require much better urban planning than has occurred to this point. Of course, Indone-sia’s archipelago geography also presents different transport and communication problems to those faced by China. Overall, there are likely to be advantages in having people remain in their own provinces and for those provinces to urban-ise. Interisland migration would then be likely to remain fairly modest in scale, except to some of the resource-rich provinces such as East Kalimantan, Riau, and Southeast Sulawesi.
With urbanisation comes the problem of demographic differences between the periphery and the core. In particular, the cities will remain relatively young while the rural areas age rapidly. Ageing is not the prominent macroeconomic policy issue in Indonesia that it is in countries like Thailand and Singapore, but local-ised ageing may still be prominent. Much old-age support in Indonesia remains informal and depends on the family unit. There may be ways that the govern-ment can assist families living in towns or cities to support their older members in rural areas. The shorter the distance that rural–urban migrants move, the easier it is to implement such a policy regime and to justify stimulating urbanisation in situ—which, in any case, has a relatively long history in Java (McDonald and Sontosudarmo 1976).
I have not dealt with international migration in this article, because the data sources remain poor. I acknowledge, however, that there is large-scale labour migration from Indonesia to the Middle East, to Malaysia, and, increasingly, to East Asia. Some East Asian countries are supporting their aged-care system by importing carers from Indonesia—Taiwan being a case in point. This is an out-come of the very large wage differentials between Indonesia and the destination countries, and these differences are likely to continue for some years.
In economic terms, as fertility in Indonesia seems to have declined more slowly than previously thought, the potential advantages deriving from a population concentrated in the working ages (the demographic dividend) are smaller than in the comparator countries in Asia with higher levels of development. Indonesia must therefore focus even more intently on developing its human capital and not rely on an illusory bonus from its age structure. It must consider the skills that will best serve its economy not just today but over the next 20 years, by which time the labour requirements will have shifted.
Indonesia has been very successful in providing school education to children, even in remote areas, but it has been much less successful in imbuing them with ideas about appropriate occupational pathways. Employment problems for edu-cated young people increase in severity as distance from Jakarta increases. Out-side of a small number of major cities, young tertiary graduates often still hope to ind jobs mainly in the public sector, and there is a danger that decentralisation will encourage a proliferation of publicly funded jobs as opposed to more produc-tive forms of employment and investment. While new tertiary-sector investment continues to be focused in Jakarta, educated young people outside Jakarta have limited employment opportunities, and at least some drift to Jakarta in the hope
The Demography of Indonesia in Comparative Perspective 49
of inding appropriate work. This problem of employment inequality between the centre and the periphery is found in almost all countries, but it is especially problematic in Indonesia because of the country’s geography and the rapid rise in education levels.
Rapid population ageing is often considered problematic for Indonesia, yet if fertility declines more slowly than previously thought, ageing will also be slow. The present priorities should be productive investment and appropriate training and jobs for young people. Should this strategy succeed, the ensuing creation of income and wealth will provide resources for supporting an ageing population, when that becomes necessary. As I have discussed, however, local-level ageing remains a problem in rural areas.
REFERENCES
Abbasi-Shavazi, Mohammad J. 1997. ‘An Assessment of the Own-Children Method of Esti-mating Fertility by Birthplace in Australia’. Journal of the Australian Population Associa-tion 14 (2): 167–85.
Abbasi-Shavazi, Mohammad J., Peter McDonald, and Meimanat Hosseini-Chavoshi. 2009. The Fertility Transition in Iran: Revolution and Reproduction. Dordrecht: Springer.
Ananta, Aris, and Evi Nurvidya Ariin. 2008. ‘Changing faces of Indonesia’s population’.
In 21st Century Indonesia: Challenges Ahead, edited by Evi Ariin and Bernhard Platz -dasch. Singapore: Institute of Southeast Asian Studies.
Bloom, David E., and Jeffrey G. Williamson. 1998. ‘Demographic Transitions and Economic
Miracles in Emerging Asia’. The World Bank Economic Review 12 (3): 419–55.
BPS (Badan Pusat Statistik). 2011a. Laporan PES sensus penduduk 2010 [Post-enumeration survey 2010 population census report]. Jakarta: BPS.
———. 2011b. Fertilitas pendiduk Indonesia: Hasil sensus penduduk 2010 [Fertility population
of Indonesia: Results of the 2010 population census]. Jakarta: BPS.
———. 2011c. Angka kematian bayi dan angka harapan hidup penduduk Indonesia: Hasil sensus
penduduk 2010 [Infant mortality and life expectancy in Indonesia: Results of the 2010 population census]. Jakarta: BPS.
———. 2011d. Migrasi internal penduduk Indonesia: Hasil sensus penduduk 2010 [Internal
migration population of Indonesia: Results of the 2010 population census]. Jakarta: BPS.
———. 2011e. Pertumbuhan dan persebaran: Hasil sensus penduduk 2010 [Growth and distri
-bution: Results of the 2010 population census]. Jakarta: BPS.
———. 2014. Proyeksi penduduk Indonesia 2010–2035 [Indonesian population projections
2010–2035]. Jakarta: BPS.
BPS (Badan Pusat Statistik), National Family Planning Board, Ministry of Health, and MEASURE DHS. 2012. Indonesia Demographic and Health Survey 2012: Preliminary Report. http://www.measuredhs.com/pubs/pdf/PR25/PR25.pdf.
Coale, Ansley J., and Paul Demeny. 1966. Regional Model Life Tables and Stable Populations. Princeton: Princeton University Press.
Coale, Ansley J., and Edgar M. Hoover. 1958. Population Growth and Economic Development in Low-Income Countries. Princeton: Princeton University Press.
Feng, Wang, Yong Cai, and Baochang Gu. 2012. ‘Population, Policy, and Politics: How Will
History Judge China’s One-Child Policy?’. Population and Development Review 38: 115– 29.
Habsjah, Atashendartini. 2009. Contraception in the Decentralisation Era in Indonesia.
Kuala Lumpur, Malaysia: The Asian-Paciic Resource & Research Centre for Women
(ARROW).
50 Peter McDonald
Hugo, Graeme. 2009. ‘Best Practice in Temporary Labour Migration for Development: A Perspective from Asia and the Paciic’. International Migration 47 (5): 23–74.
Hull, Terry. 2001. ‘First Results from the 2000 Population Census’. Bulletin of Indonesian Economic Studies 37 (1): 103–11.
———. 2009. Implementation of the Grand Design for Processing, Disseminating, Analysing, and
Utilizing Data from Indonesia’s 2010 Population Census. Report to BPS. 10 March.
———. 2010. ‘Estimates of Indonesian Population Numbers: First Impressions from the
2010 Census’. Bulletin of Indonesian Economic Studies 46 (3): 371–75.
Hull, Terry, and Wendy Hartanto. 2009. ‘Resolving Contradictions in Indonesian Fertility Estimates’. Bulletin of Indonesian Economic Studies 45 (1): 61–71.
Jackson, Richard, and Neil Howe. 2008. The Graying of the Great Powers: Demography and Geopolitics in the 21st Century. Washington DC: Center for Strategic and International Studies.
Jones, Gavin W. 1971. ‘Effect of Population Change on the Attainment of Educational Goals
in the Developing Countries’. In Rapid Population Growth: Consequences and Policy Impli-cations, edited by Roger Revelle, 315–67. Baltimore: Johns Hopkins University Press. Kinugasa, Tomoko. 2013. ‘Populations in Transition: Second Dividend Holds Promise of
Sustained Rewards’. East Asia Forum Quarterly 5 (1): 5–7.
Knowledge@Wharton. 2012. ‘Southeast Asian Megacities: Big Challenges, Bigger
Opportu-nities’. Last modiied 10 October. http://global.wharton.upenn.edu/post/southeast-asian-megacities-big-challenges-bigger-opportunities/.
Lutz, Wolfgang, and Samir K. C. 2013. ‘Educational Advantage: The Asian Century Will Be Built on Human Capital’. East Asia Forum Quarterly 5 (1): 7–8.
McDonald, Peter. 2011. Early Childhood Education and Care for Disadvantaged Families. 2010
Greater Jakarta Transition to Adulthood Survey, Policy Brief No. 3. Canberra: The Aus -tralian Demographic and Social Research Institute, The Aus-tralian National University. McDonald, Peter, and Alip Sontosudarmo. 1976. Response to Population Pressure: The Case of
the Special Region of Yogyakarta. Yogyakarta: Gadjah Mada University Press.
McDonald, Peter, and Jeromey Temple. 2010. Immigration, Labour Supply and Per Capita Gross Domestic Product: Australia 2010–2050. Report to the Australian Government Department of Immigration and Citizenship. http://www.immi.gov.au/media/pub-lications/research/_pdf/labour-supply-gdp-2010-2050.pdf.
McNicoll, Geoffrey. 1999. ‘Population Weights in the International Order’. Population and Development Review 25 (3): 411–42.
Muhidin, Salut, and Aja Nasrun. 2012. ‘Constructing Indonesian Life Tables Using the 2010 National Census’. Paper presented at the Australian Population Association Confer-ence, Melbourne, 5–7 December.
NESDB (National Economic and Social Development Board, Thailand). 2012. Population Policy for Thailand during the 11th National Economic and Social Development Plan (2012– 2016). Bangkok: NESDB.
NPTD (National Population and Talent Division). 2013. A Sustainable Population for a Dynamic Singapore: Population White Paper. Singapore: NPTD.
Potts, Malcolm. 2006. ‘China’s one child policy’. British Medical Journal 333: 361.
Szreter, Simon. 1993. ‘The Idea of Demographic Transition and the Study of Fertility Change: A Critical Intellectual History’. Population and Development Review 19 (4): 659–701. Turbay Ayala, Julio C., and Lord Caradon. 1968. ‘Declaration on Population: The World
Leaders Statement’. Studies in Family Planning 1 (26): 1–3.
Westley, Sidney B., Minja Kim Choe, and Robert D. Retherford. 2010. ‘Very Low Fertility in Asia: Is There a Problem? Can It Be Solved?’ Asia Paciic Issues 94 (May).
World Bank. 2013. Indonesia Economic Quarterly: Pressures Mounting. March. Jakarta: The World Bank.
Zhu, Yu. 2002. ‘Beyond Large-City-Centred Urbanisation: In Situ Transformation of Rural Areas in Fujian Province’. Asia Paciic Viewpoint 43 (1): 9–22.
The Demography of Indonesia in Comparative Perspective 51
APPENDIX 1. RATES OF POPULATION GROWTH IN THE PROVINCES
Appendix table A1 (overleaf) presents data equivalent to that in the irst column of table 1, but based on 1971 provincial boundaries. The trajectory of growth rates between the decades 1971–80 and 1980–90 seem to be reasonable and in keeping with expectations. However, the growth rates in the following two decades often luctuate. In West Sumatra, for example, the growth rate falls between 1980–90 and 1990–2000, from 1.6% to 0.6%, but then rises again in 2000–2010, to 1.32%. A similarly severe luctuation is evident across these two decades for Jambi, Lam -pung, Jakarta, South Kalimantan, East Kalimantan, Southeast Sulawesi, Maluku, and West Papua.
If there were enumeration problems in the 2000 census (table 2), the complete-ness of enumeration seems to have varied enormously across provinces. This var-iability is conirmed by the estimates of the net census undercount for provinces at the 2010 census, as derived from the 2010 PES (inal column of table 2). The net undercount ranged from 0.4% in South Sulawesi to 9.8% in Papua.
APPENDIX TABLE A1 Intercensal Annual Rates of Population Growth, Based on Census Counts, Provinces of Indonesia, 1971–2010
(%)
1971–1980 1980–1990 1990–2000 2000–2010
Estimated undercount, 2010 census
(%)
Aceh 2.92 2.69 1.40 1.34 2.7
North Sumatra 2.59 2.04 1.27 1.08 1.1
West Sumatra 2.21 1.61 0.60 1.32 3.4
Riau 3.09 4.21 4.06 3.76 6.2
Jambi 4.03 3.35 1.78 2.48 4.4
South Sumatra 3.30 3.10 2.11 1.06 5.4
Bengkulu 4.35 4.29 2.85 0.90 3.4
Lampung 5.67 2.63 1.01 1.33 3.2
Sumatra 3.30 2.65 1.69 1.58
DKI Jakarta 3.90 2.39 0.16 1.36 7.6
West Java 2.52 2.54 2.14 2.03 3.4
Central Java 1.65 1.17 0.91 0.36 2.5
DI Yogyakarta 1.11 0.57 0.69 1.02 3.5
East Java 1.49 1.08 0.68 0.75 2.9
Java 1.98 1.64 1.20 1.18
Bali 1.70 1.17 1.26 2.11 5.0
West Nusa Tenggara 2.36 2.12 1.74 1.16 4.8
East Nusa Tenggara 1.96 1.77 1.90 1.70 5.6
West Kalimantan 2.31 2.62 2.23 0.86 3.4
Central Kalimantan 3.41 3.81 2.85 1.75 4.6
South Kalimantan 2.17 2.30 1.39 1.95 3.8
East Kalimantan 5.63 4.32 2.69 3.70 8.5
Kalimantan 2.95 3.03 2.19 1.96
North Sulawesi 2.31 1.58 1.39 1.51 4.5
Central Sulawesi 3.83 2.83 2.60 1.72 2.7
South Sulawesi 1.75 1.41 1.44 1.32 0.4
Southeast Sulawesi 3.08 3.59 1.62 3.41 1.3
Sulawesi 2.22 1.85 1.61 1.66
Maluku 2.87 2.75 0.69 2.56
Irian Jayaa 2.67 3.40 2.98 4.81
Bangka–Belitung Islands 5.4
Riau Islands 7.6
Banten 5.4
Maluku 4.1
North Maluku 6.6
West Papua 7.7
Papua 9.8
Sources: Columns 1–4: author’s calculations based on data from Badan Pusat Statistik (BPS). Column 5: BPS (2011a).
Note: Table uses provincial boundaries from 1971.
aNow Papua and West Papua.