Full Terms & Conditions of access and use can be found at
http://www.tandfonline.com/action/journalInformation?journalCode=cbie20
Download by: [Universitas Maritim Raja Ali Haji] Date: 18 January 2016, At: 00:28
ISSN: 0007-4918 (Print) 1472-7234 (Online) Journal homepage: http://www.tandfonline.com/loi/cbie20
Survey of recent developments
Paul J. Burke & Budy P. Resosudarmo
To cite this article: Paul J. Burke & Budy P. Resosudarmo (2012) Survey of recent developments, Bulletin of Indonesian Economic Studies, 48:3, 299-324, DOI: 10.1080/00074918.2012.728620
To link to this article: http://dx.doi.org/10.1080/00074918.2012.728620
Published online: 20 Nov 2012.
Submit your article to this journal
Article views: 562
View related articles
ISSN 0007-4918 print/ISSN 1472-7234 online/12/030299-26 © 2012 Indonesia Project ANU http://dx.doi.org/10.1080/00074918.2012.728620
SURVEY OF RECENT DEVELOPMENTS
Paul J. Burke and Budy P. Resosudarmo*
Australian National University
SUMMARY
The Indonesian economy is maintaining its momentum at a time of ongoing uncertainty in the global economy and slowing economic growth in China. Strong domestic demand saw output grow by 6.4% over the year to June, despite a steep fall in net exports. Inlation is safely within Bank Indonesia’s target range, although food prices have increased relatively quickly. The current account deicit widened to 3.1% of GDP in the June quarter due to continued growth in imports and falling prices for commodity exports. The trade environment has deteriorated in 2012, and new divestment and domestic processing requirements are likely to further reduce investor interest in the mining sector.
President Yudhoyono has recently made several speeches calling for a ‘green growth agenda’. Some progress has been seen in slowing deforestation and in establishing mechanisms for facilitating payments to reduce emissions from deforestation, but loss of natural forests remains rapid. Carbon dioxide emissions from energy are growing quickly, stoked by increasing use of coal. The proposed 2013 budget continues to be heavily burdened by energy subsidies, which encour-age over-consumption of fossil fuels. In most respects, therefore, the business-as-usual trajectory of the Indonesian economy is unlikely to be particularly green.
A barrier to subsidy reform is its perceived unpopularity, including the threat of public protests such as those witnessed in March. To gauge current opinion we carried out a survey of Jakarta-based university students. The results indicated majority support for the removal of fuel subsidies, but some respondents said they would protest against fuel subsidy reductions, highlighting the politically sensitive nature of the issue.
Indonesia has witnessed booms in the coal and palm oil sectors in recent years, becoming the world’s largest exporter of both commodities. We review the bene-its from these two booms and the tensions between the development of these sec -tors and environmental goals. We also review the tourism sector, which remains relatively under-developed outside Bali. Tourism is a potential source of long-run growth that may be aligned with a green economy. The development of the sec-tor would be aided by infrastructure improvements and a renewed focus on the conservation of natural assets.
* We are grateful to Gema Darmawan and Lydia Napitupulu for assistance in implement-ing the student survey and to Umbu Reku Raya for assistance with data.
POLITICAL DEVELOPMENTS
The popularity of President Susilo Bambang Yudhoyono remains in decline fol -lowing various corruption scandals within the Democrat Party (Partai Demokrat, PD) and a growing perception of weakness in his leadership, as displayed by his failure to secure parliamentary support for proposed fuel price increases earlier this year (Olivia and Yamauchi 2012: 151). The president appears to have a keen focus on maintaining the economy’s overall macro performance for the remainder of his term, but little appetite for any signiicant microeconomic reforms. There is instead a risk of a continuing retreat towards inward-looking policies of import substitution and encouraging sectoral value adding, which are seen as popular with the public.
Attention has already turned to who will contest the 2014 presidential elec-tion. Aburizal Bakrie (Golkar) and retired general Prabowo Subianto (Gerakan Indo nesia Raya, Gerindra) have signalled their intention to stand, but PD is yet to select a nominee. A July opinion poll by the Centre for Strategic and International Studies (CSIS 2012) found support for Prabowo exceeding that for other candi -dates, although it remains too early for a clear frontrunner to have emerged.
The election for the position of Jakarta’s governor showed that Indonesia’s young democracy can produce election surprises. The mayor of Solo (Surakarta), Joko Widodo, received 42.6% of the irstround vote to take the incumbent, Fauzi Bowo (34.1%), to a second round held on 20 September, in which Widodo pre-vailed with 53.8% of the vote. Widodo’s campaign was energised by his reputa -tion as a clean and successful outsider to Jakarta’s politics and by frustra-tion with the incumbent’s slow progress in addressing local problems such as trafic jams and looding.
Two incidents have renewed concerns about underlying religious and social intolerance. On 26 August a mob attacked a Shia Muslim community in Sampang, Madura, killing two men, destroying dozens of homes and causing hundreds to lee. The attack followed a ransacking of the same village in December 2011 and other outbreaks of religious violence in recent years, including assaults targeting members of the Islamic Ahmadiyah sect (Fealy 2011: 347). The second incident was the forced cancellation of a concert in Jakarta by Lady Gaga, an American pop star, in June. Members of the Islamic Defenders Front (Front Pembela Islam, FPI) and other organisations threatened to disrupt the concert and attack the air -port upon Lady Gaga’s arrival. The police then baulked at issuing a permit for the concert, and government members appeared relieved when she inally can -celled her show. The case attracted considerable media attention and revealed the power that hard-line groups can wield in Indonesia in the face of weak govern-ment leader ship.
MACROECONOMIC DEVELOPMENTS Economic growth
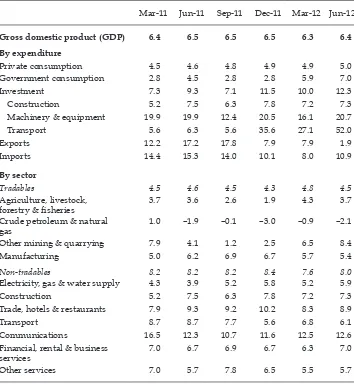
Indonesia’s economy is showing strong resilience at a time of slowing growth in the region and continuing economic troubles in Europe and the US. While export growth slowed considerably in the year to June 2012, GDP expanded by 6.4% in real terms (table 1). Strong growth in investment, and increases in private and government consumption growth, explained the (very small) uptick in the
annual growth rate from the quarter before. Yearonyear GDP growth has exhib -ited remarkable consistency, remaining in the narrow range of 6.3–6.5% since the start of 2011.
Investment growth increased from 10.0% in the year to March to 12.3% in the year to June, its fastest rate since 2008. Growth was particularly strong in invest-ment in transport (52.0%) and machinery and equipinvest-ment (20.7%), primarily in the form of capital goods imports. Growth in government consumption rose to 7.0%, while private consumption expenditure grew at 5.0% per annum, up 0.4 percent -age points from the previous year. The value of Indonesia’s net exports surplus fell by 29.3% in the year to June (using year 2000 rupiah prices) as export growth slowed. Because private consumption has routinely grown more slowly than the
TABLE 1 Components of GDP Growth (2000 prices; % year on year)
Mar-11 Jun-11 Sep-11 Dec-11 Mar-12 Jun-12
Gross domestic product (GDP) 6.4 6.5 6.5 6.5 6.3 6.4
By expenditure
Private consumption 4.5 4.6 4.8 4.9 4.9 5.0
Government consumption 2.8 4.5 2.8 2.8 5.9 7.0
Investment 7.3 9.3 7.1 11.5 10.0 12.3
Construction 5.2 7.5 6.3 7.8 7.2 7.3
Machinery & equipment 19.9 19.9 12.4 20.5 16.1 20.7
Transport 5.6 6.3 5.6 35.6 27.1 52.0
Exports 12.2 17.2 17.8 7.9 7.9 1.9
Imports 14.4 15.3 14.0 10.1 8.0 10.9
By sector
Tradables 4.5 4.6 4.5 4.3 4.8 4.5
Agriculture, livestock,
forestry & isheries 3.7 3.6 2.6 1.9 4.3 3.7
Crude petroleum & natural gas
1.0 –1.9 –0.1 –3.0 –0.9 –2.1
Other mining & quarrying 7.9 4.1 1.2 2.5 6.5 8.4
Manufacturing 5.0 6.2 6.9 6.7 5.7 5.4
Non-tradables 8.2 8.2 8.2 8.4 7.6 8.0
Electricity, gas & water supply 4.3 3.9 5.2 5.8 5.2 5.9
Construction 5.2 7.5 6.3 7.8 7.2 7.3
Trade, hotels & restaurants 7.9 9.3 9.2 10.2 8.3 8.9
Transport 8.7 8.7 7.7 5.6 6.8 6.1
Communications 16.5 12.3 10.7 11.6 12.5 12.6
Financial, rental & business services
7.0 6.7 6.9 6.7 6.3 7.0
Other services 7.0 5.7 7.8 6.5 5.5 5.7
Source: CEIC Asia Database.
economy as a whole, its contribution to total expenditure has now fallen to 54% in current price terms, down from two-thirds 10 years ago.
Output growth continues to be led by non-tradables. Communications has maintained its impressive performance, recording annual real growth of 12.6%. Growth in wholesale and retail trade increased to 9.8% and the hotel sector expanded by 9.0% over the year to June, although restaurants experienced growth of only 2.9%. Among tradables, the fastest expansion was in mining and quarry-ing (excludquarry-ing oil and natural gas), which recorded annual growth of 8.4%, up from 6.5% in March. The combined value of oil and natural gas output contin -ued to decline in real terms. Growth in the manufacturing sector slowed to 5.4%, although manufacturing outside the oil and gas sector grew at a steady rate of 6.1% per annum.
Inlation, monetary policy and inancial markets
Consumer price index (CPI) inlation registered 4.6% over the year to August 2012 (igure 1), comfortably within Bank Indonesia’s (BI’s) 2012 target range of 3.5–5.5%. Food price inlation has outpaced price increases for the rest of the CPI bundle in recent months, reaching 7.4% in year-on-year terms by August. The increases in food prices were partly caused by international factors: droughts in the US and some other producing countries saw a 24.2% rise in the international price of soybeans over the year to August, for example (IMF 2012a). But some of the increases were selfinlicted through, for instance, import restrictions on com -modities such as rice and beef, and new limits on horticultural imports through the port of Tanjung Priok in Jakarta. Despite only small rises in the international
FIGURE 1 Inlation and Interest Ratesa
(% p.a.)
Jun-11 Aug-11 Oct-11 Dec-11 Feb-12 Apr-12 Jun-12 Aug-12 0
2 4 6 8 10
9-month SBI rate Food price inflation
CPI inflation
a CPI = consumer price index; SBI = Bank Indonesia Certiicate. Inlation rates are year on year.
Source: CEIC Asia Database.
prices of rice and beef,1 average domestic retail prices increased by 9.3% and
11.5% respectively over the year to August.
BI has left its policy rate unchanged at 5.75% since February. In practice, how -ever, the policy rate is not a good measure of BI’s monetary policy stance, as it is not linked to any instrument in the market (McLeod 2011: 14). The nine-month Bank Indonesia Certiicate (SBI) rate has increased over the last halfyear, but at 4.5% per annum remains relatively low. The SBI rate is almost equal to CPI inlation, meaning that in real terms the certiicates now attract close to zero return. Following the release of the second-quarter balance of payments data, BI increased the deposit facility rate (the rate that commercial banks receive from BI for overnight deposits) from 3.75% to 4.0% as part of its efforts to cool demand for imports. Money supply (proxied by currency in circulation) increased by 17.6% over the year to July, slightly faster than the average rate of 17.0% per annum since 2006 (CEIC Asia Database). There is no indication that this growth in mon-etary liabilities will be inconsistent with BI achieving its inlation target, however.
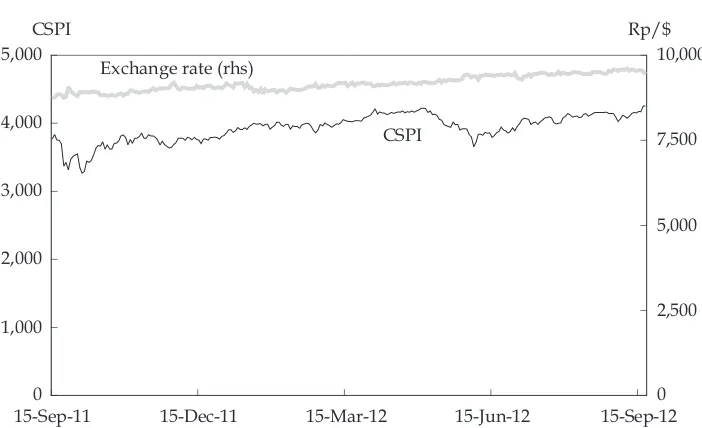
The rupiah has continued to depreciate against the dollar, losing 8.3% of its nominal value over the year to midSeptember (igure 2). The depreciation is asso -ciated with reduced demand for rupiah as the overall balance of payments has gone from surplus to deicit. The net exports surplus would have fallen by even more if this depreciation had not occurred. The stock market has recovered since reaching a ivemonth low in early June 2012 associated with economic uncer -tainty in Europe. Despite the setback, the composite stock price index (CSPI) was up 12.8% over the year to mid-September.
1 The average export price of Thai rice increased by less than 0.1%, and that of Australian and New Zealand beef by 1.3%, over the year to August (IMF 2012a).
FIGURE 2 Composite Stock Price Index (CSPI) and Exchange Rate
15-Sep-11 15-Dec-11 15-Mar-12 15-Jun-12 15-Sep-12 0
1,000 2,000 3,000 4,000 5,000
0 2,500 5,000 7,500 10,000 Exchange rate (rhs)
CSPI
Rp/$ CSPI
Source: Indonesia Stock Exchange; Paciic Exchange Rate Service.
Balance of payments
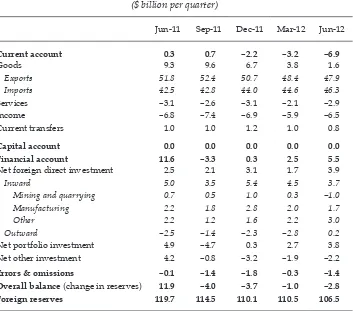
To date, 2012 has been the most challenging year for Indonesian exports since 2009. Merchandise exports fell to $47.9 billion in the June quarter, down from $51.8 billion in the June quarter of 2011 (table 2). The fall was associated with lower prices for Indonesia’s export commodities and an overall weakening in external demand, but was also exacerbated by new restrictions on mineral exports. Mer-chandise imports increased by 8.9% relative to the second quarter of 2011, the lowest annual growth rate since 2009.
The decline in the merchandise trade surplus, and increases in net outlows for services and income transfers, saw the current account deicit spike to $6.9 billion in the June quarter. As a share of GDP (3.1%), this was the largest quarterly deicit since 1996. The widening of the current account deicit is mostly a symptom of strong domestic demand amid subdued external demand and falling commodity prices, and should not be a cause for concern – particularly given that the inancial account surplus remains sizeable, and most imports are inputs to production.2
2 BI (2012a) data indicate that 86.6% of imports in the June quarter were ‘raw materials and auxiliary goods’ or ‘capital goods’, with the remainder classed as ‘consumption goods’.
TABLE 2 Balance of Payments ($ billion per quarter)
Jun-11 Sep-11 Dec-11 Mar-12 Jun-12
Current account 0.3 0.7 –2.2 –3.2 –6.9
Goods 9.3 9.6 6.7 3.8 1.6
Exports 51.8 52.4 50.7 48.4 47.9
Imports 42.5 42.8 44.0 44.6 46.3
Services –3.1 –2.6 –3.1 –2.1 –2.9
Income –6.8 –7.4 –6.9 –5.9 –6.5
Current transfers 1.0 1.0 1.2 1.0 0.8
Capital account 0.0 0.0 0.0 0.0 0.0
Financial account 11.6 –3.3 0.3 2.5 5.5
Net foreign direct investment 2.5 2.1 3.1 1.7 3.9
Inward 5.0 3.5 5.4 4.5 3.7
Mining and quarrying 0.7 0.5 1.0 0.3 –1.0
Manufacturing 2.2 1.8 2.8 2.0 1.7
Other 2.2 1.2 1.6 2.2 3.0
Outward –2.5 –1.4 –2.3 –2.8 0.2
Net portfolio investment 4.9 –4.7 0.3 2.7 3.8
Net other investment 4.2 –0.8 –3.2 –1.9 –2.2
Errors & omissions –0.1 –1.4 –1.8 –0.3 –1.4
Overall balance (change in reserves) 11.9 –4.0 –3.7 –1.0 –2.8
Foreign reserves 119.7 114.5 110.1 110.5 106.5
Source: BI (2012a).
Further depreciation of the rupiah would help to prevent the current account dei -cit increasing too much further, and BI has indicated that it is willing to allow this to occur (Jakarta Globe, 1/9/2012). Despite this, the government responded to the widening of the current account deicit by introducing a number of wholly unnec -essary policies aimed at restricting imports (see below).
The surplus on the inancial account rose to $5.5 billion in June, principally due to a reduction in outward net direct investment. Net foreign direct invest-ment (FDI) in the mining and quarrying sector was negative during the quarter, perhaps an early sign of the effects of new divestment requirements and export restrictions. Net FDI in other sectors increased by $0.5 billion, with the largest overall inlows coming from Singapore and Japan; net lows from Europe were negative. Net portfolio investment increased to $3.8 billion, although this was still down by over a ifth from June 2011.
Indonesia’s overall balance was a deicit of $2.8 billion in the June quarter, meaning that BI currency interventions have seen foreign reserves continue their fall since reaching a high of $124.6 billion at the end of August 2011. Maintaining large foreign reserves is a costly exercise given the differential between the SBI rate and the yield on US treasuries (McLeod 2011: 14, Suryadarma and Sumarto 2011: 161). To reduce these losses and diversify risk, BI has for the irst time invested in China interbank bonds, which provide a higher yield than US treasuries (Jakarta Globe, 24/7/2012).
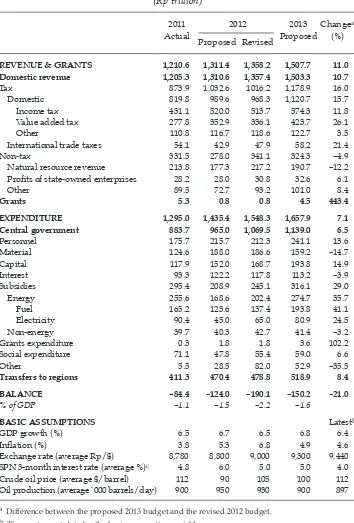
The 2013 budget
The president tabled an essentially business-as-usual draft budget for 2013 on 16 August (table 3). Central government spending is scheduled to rise by 6.5% in nominal terms, which is a very small increase once inlation and population growth are considered. Disappointingly, the proposed increase is predominantly due to increased spending on energy subsidies. Fuel subsidies are projected to rise by a massive 41.1%. Electricity subsidies are to increase by 24.5%, despite a plan to raise electricity prices by up to 15% in 2013 in several steps (with an exemption for low-consuming households). It remains to be seen whether the electricity price increases will win the approval of parliament this time around.
The draft budget includes a Rp 25 trillion (14.9%) increase in capital spending to help relieve Indonesia’s numerous infrastructure bottlenecks. This is welcome, although it is much smaller than the increase in energy subsidies (Rp 72 trillion). Initiatives include 15 new airports and 120 airport upgrades, 380 kilometres of railways and 4,431 kilometres of roads. There is a risk, however, that these capital expenditure plans will not be fully realised: capital expenditures in the irst half of 2012 amounted to less than 20% of the annual capital budget owing to dificul -ties in project execution (Jakarta Post, 21/8/2012). The target of 6.8% real GDP growth in 2013 also appears ambitious given the uncertain prospects of the global economy.
Oil revenue is budgeted to fall by 19.8% as a result of declining production and a lower assumed oil price of $100 per barrel. Strong growth is predicted in most other revenue categories, including a particularly ambitious 26.1% increase in collections of value added tax. Total revenue and grants are projected to be 11.0% higher in 2013, causing the budget deicit to fall to 1.6% of GDP in 2013, down from the revised 2012 deicit of 2.2%. There is little indication of the type of
TABLE 3 Budgets for 2011, 2012 and 2013
REVENUE & GRANTS 1,210.6 1,311.4 1,358.2 1,507.7 11.0
Domestic revenue 1,205.3 1,310.6 1,357.4 1,503.3 10.7
Tax 873.9 1,032.6 1016.2 1,178.9 16.0
Domestic 819.8 989.6 968.3 1,120.7 15.7
Income tax 431.1 520.0 513.7 574.3 11.8
Value added tax 277.8 352.9 336.1 423.7 26.1
Other 110.8 116.7 118.6 122.7 3.5
International trade taxes 54.1 42.9 47.9 58.2 21.4
Non-tax 331.5 278.0 341.1 324.3 –4.9
Natural resource revenue 213.8 177.3 217.2 190.7 –12.2 Proits of stateowned enterprises 28.2 28.0 30.8 32.6 6.1
Other 89.5 72.7 93.2 101.0 8.4
Grants 5.3 0.8 0.8 4.5 443.4
EXPENDITURE 1,295.0 1,435.4 1,548.3 1,657.9 7.1
Central government 883.7 965.0 1,069.5 1,139.0 6.5
Personnel 175.7 215.7 212.3 241.1 13.6
Material 124.6 188.0 186.6 159.2 –14.7
Capital 117.9 152.0 168.7 193.8 14.9
Interest 93.3 122.2 117.8 113.2 –3.9
Subsidies 295.4 208.9 245.1 316.1 29.0
Energy 255.6 168.6 202.4 274.7 35.7
Fuel 165.2 123.6 137.4 193.8 41.1
Electricity 90.4 45.0 65.0 80.9 24.5
Non-energy 39.7 40.3 42.7 41.4 –3.2
Grants expenditure 0.3 1.8 1.8 3.6 102.2
Social expenditure 71.1 47.8 55.4 59.0 6.6
Other 5.5 28.5 82.0 52.9 –35.5
Transfers to regions 411.3 470.4 478.8 518.9 8.4
BALANCE –84.4 –124.0 –190.1 –150.2 –21.0
% of GDP –1.1 –1.5 –2.2 –1.6
BASIC ASSUMPTIONS Latestb
GDP growth (%) 6.5 6.7 6.5 6.8 6.4
Inlation (%) 3.8 5.3 6.8 4.9 4.6
Exchange rate (average Rp/$) 8,780 8,800 9,000 9,300 9,440 SPN 3month interest rate (average %)c 4.8 6.0 5.0 5.0 4.0
Crude oil price (average $/barrel) 112 90 105 100 112
Oil production (average ‘000 barrels/day) 900 950 930 900 897
a Difference between the proposed 2013 budget and the revised 2012 budget.
b The most recent data for the basic assumption variables.
c SPN = Surat Perbendaharaan Negara (treasury bills). These have been issued since March 2011 fol
-lowing the cessation of auctions for three-month SBIs.
Source: Ministry of Finance.
iscal consolidation required to achieve a balanced budget by 2014, to which the president previously committed, although the challenging external environment provides justiication for this. Reform to energy subsidies alone could return the budget to surplus.
THE INVESTMENT AND TRADE ENVIRONMENTS
The increase in net FDI outside the mining sector observed in table 2 relects growing interest in investing in the Indonesian economy.3 This is attributable to the buoyancy of the economy and the attractiveness of Indonesia’s large domestic market rather than to tangible improvements in the policy environment. Rising labour costs in China have also seen investors in the manufacturing sector increas-ingly turn elsewhere, including to Indonesia (Manning and Purnagunawan 2011: 312). There are indications of numerous FDI projects in the pipeline in sectors ranging from petrochemicals to consumer goods (Jakarta Post, 31/8/2012).
The investment outlook for the mining sector has deteriorated, however (Olivia and Yamauchi 2012: 156). Government Regulation 24/2012, introduced in Febru -ary, requires foreign irms to start selling down their stakes in mining entities from the sixth year of extraction, to ensure 51% domestic ownership by the tenth year. Ministerial Regulation 7/2012 of the Ministry of Energy and Mineral Resources, also enacted in early 2012, banned exports of 14 raw minerals, including cop-per, nickel and gold. This regulation applies to licences issued after 2009 but not to companies with pre-existing contracts of work, or to those that submit plans to process their minerals domestically and that obtain ‘clean and clear’ status.4 Companies with clean and clear status that plan to process minerals domestically are able to export ore until 2014, subject to a 20% export tax. In May, an additional regulation was enacted to expand the changes to cover 65 raw minerals (but not coal). Exports of copper, nickel and bauxite fell sharply after the new regulations were enacted (BI 2012a), and substantial uncertainty shrouds the sector.
Requiring domestic processing of minerals carries a high cost. Minerals pro-cessing is highly energy, capital and skills intensive, and diverts resources from other potentially more eficient uses. Processing that is carried out less proitably than it could be overseas reduces the value of extracted minerals, thus discour-aging investment in mining. The export taxes and pending ban have also upset Indonesia’s trading partners (Wall Street Journal, 18/7/2012). The 2014 timeframe for companies to cease exports of unprocessed ore may have to be relaxed given
3 Net inward FDI outside the mining sector was 13% higher in the irst half of 2012 than in the irst half of 2011 in nominal terms. Data from the Investment Coordinating Board (Badan Koordinasi Penanaman Modal, BKPM) indicate an even larger increase in FDI realisation (30%) for greenield projects outside the oil, gas, coal and inance sectors. See Lindblad and Thee (2007: 20) for details on the differences between the BKPM and BI data.
4 Clean and clear status, granted by the Ministry of Energy and Mineral Resources, means that there is no problem with an entity’s mining permit (for example, it does not overlap with another permit) or operations (for example, tax and environmental obligations have been met).
the time required to build smelters and supporting infrastructure; securing reli -able electricity is a particularly dificult challenge.5
The primary nominal motivation for requiring domestic minerals process-ing is to ensure that Indonesians gain greater beneit from the country’s mineral resources, particularly in light of the environmental impacts of mining.6 Yet
man-dating domestic processing is at the ineficient end of the range of options for extracting rent from the minerals sector and reduces the value of the domestic minerals stock (Baird and Wihardja 2010: 167; Gandataruna and Haymon 2011: 228); a rent tax is a much more eficient alternative.7 It would also be possible to address the environmental impacts of mining through, for instance, stricter requirements for site rehabilitation. A secondary motivation for requiring domes-tic processing is to encourage manufacturing. There is little economic rationale for speciically targeting minerals processing over other sectors, however, espe -cially given that it is not an impressive contributor to employment. Concentrat-ing on improvConcentrat-ing the underlyConcentrat-ing investment environment through infrastructure, institutional and human capital improvements is likely to be a more productive approach to increasing value added in the overall economy, which is what counts.
The past year has also seen the introduction of a number of restrictive poli-cies in the trade arena. After the release of the second-quarter balance of pay-ments data, the government announced additional initiatives aimed at reducing imports, including a broadened tax holiday for investments in the production of capital goods and new anti-dumping policies. These moves followed tight-ened import licence requirements for inished goods announced in May (Anas 2012). Hatta Rajasa, the Coordinating Minister for Economic Affairs, stated that ‘In the medium term, government policy is directed to decreasing dependence on imports and continuing to encourage exports’ (BI 2012b). This mercantilist focus on curtailing imports is a threat to long-term growth, particularly if it compro-mises Indonesia’s participation in (import-intensive) global production networks. Nontariff barriers relect a continuing ambivalence towards international agri -cultural trade. Indonesia retains its ban on rice imports, which are only permitted when deemed necessary. Because the domestic rice price exceeds the international price (World Bank 2012a: 15) and most poor people are net consumers of rice (that is, they consume more than they produce), the import ban exacerbates poverty (World Bank 2011: 20). An oftstated goal of rice policy is to achieve selfsufi -ciency – the trade minister has even suggested that people reduce their consump-tion of rice to help achieve this aim (Jakarta Globe, 26/1/2012).
Other agricultural markets are protected by similar non-tariff barriers to trade. In 2011 Indonesia tightened quotas on imports of beef and live cattle, for instance, with the goal of reaching selfsuficiency by 2014. The restrictions on horti cultural
5 Indonesia is ranked 161st out of 183 countries for ease of accessing electricity (World Bank 2012b).
6 The processing requirement is part of a broad push for additional value adding in sectors such as rattan (a ban on exports of raw rattan was reintroduced in late 2011) and palm oil (export taxes are lower for more highly processed oil palm products). Restrictive policies aiming to boost sectoral value adding have a long history in Indonesia; see Resosudarmo and Yusuf (2006) for the case of logging.
7 For a discussion of approaches to raising revenue from the mining sector, see IMF (2012b).
imports through the port of Tanjung Priok, introduced in June, have been relaxed to allow produce from Australia, Canada, the US and New Zealand to come into the country through Jakarta, but Chinese horticultural goods are still required to enter through other ports. In July the government removed a 5% import tar -iff on soybeans to relieve pressure on prices following a strike by tempeh (fer-mented soya bean cake) and tahu (tofu) producers, but the removal is temporary, and against the overall trend.8 In August President Yudhoyono announced that the state logistics agency, Bulog (Badan Urusan Logistik), would start to play a broader role in managing commodity markets in order to maintain price stability, with a focus on sugar, soybeans, meat and corn (in addition to rice) (Jakarta Post, 6/9/2012). This could signal further disengagement from international commod-ity markets.
Infrastructure is frequently cited as a constraint to investment in Indonesia. In August the president signed an implementing regulation for Law 2/2012 on Land Acquisition for Public Facilities that sets an unambitious maximum time of 583 days for the land acquisition process for new public projects (Jakarta Post, 16/8/2012).9 It is too early to determine whether the new regulation will have any
effect in getting infrastructure projects moving.
GREEN GROWTH
In June, in the lead-up to the Rio+20 United Nations Conference on Sustainable Development, President Yudhoyono made a speech at the Center for Forestry Research in Bogor in which he called for a ‘green growth agenda’ and announced that ‘environmental sustainability is at the heart of all long-term development plans’ in Indonesia. He repeated the message in Rio de Janeiro, and has made similar calls for a green economy at other international meetings, including the World Economic Forum at Davos in January 2011. Since 2010 the president has added a fourth ‘pro’ to the government’s development mantra, which has become ‘progrowth, projob, propoor and [now] proenvironment’.
Green growth is economic growth that does not overly compromise the quality of the environment. The goal is not to slow the economy, but to address market failures to reduce the extent to which economic growth has negative environmen-tal impacts. The concept has been around for decades (Pearce, Markandya and Barbier 1989), but has become increasingly popular over the last few years. The World Bank, the United Nations, the Asian Development Bank and the Organi-sation for Economic Co-operation and Development (OECD) have all expressed support for green growth. The AsiaPaciic Economic Cooperation (APEC) Lead -ers’ Declaration from Vladivostok in September also afirmed a ‘commitment to promote green growth’ (APEC 2012).
Making Indonesia’s economic growth more environmentally sustainable is a substantial challenge. Prerequisites for greening growth in an eficient manner include that prices adequately relect environmental costs and that laws and administrative arrangements are in place to ensure that resources such as forests,
8 The properties of some producers who did not join the strike were ransacked by a mob (Jakarta Globe, 3/8/2012).
9 See Mahi and Nazara (2012: 27) for details on the law.
marine areas, rivers and the atmosphere are adequately governed. Reducing the environmental impact of economic growth need not distract from other priorities, such as extending electricity to the 17 million households who do not yet have it (PLN 2011: 31). Policies to encourage green growth, if well designed, may beneit the poor (Resosudarmo 2002).
Indonesia has made some progress in environmental initiatives, particularly through efforts to slow deforestation (see below). Yet the government’s overall policy stance is not well aligned towards a green economy, and in a business-as-usual scenario many environmental indicators are likely to deteriorate as the economy continues to expand. Efforts to boost domestic smelting of minerals, for instance, are far from green. Indonesia’s ‘Master Plan’ for 2011–25 (MP3EI) does not mention green growth,10 and while work is being done to incorporate
an additional section on the topic, it will be dificult to reconcile this with the MP3EI’s current emphasis on developing extractive industries such as coal.
Greening the economy cuts across multiple policy areas, several of which are reviewed below.
The energy subsidy stalemate
Large subsidies for fuel and electricity – projected to reach Rp 275 trillion ($29.5 billion) in 2013 – continue to distort the overall allocation of resources in the Indo-nesian economy.11 They encourage excessive use of fuel and electricity, which
exacerbates resource depletion, trafic congestion, air pollution and carbon diox -ide emissions. They are also regressive, as the bulk of the subsidies low to the non-poor (World Bank 2011: 27). Energy subsidies displace resources from essen-tial government services and infrastructure provision, and make it dificult for the government to implement countercyclical iscal policy. The government dedi -cates scarce resources to enforcing rules on the use of subsidised fuel, but misuse and fuel smuggling remain rife (Bisnis Indonesia, 5/9/2012). The maintenance of a low electricity price also makes it dificult for the state electricity company, Peru -sahaan Listrik Negara (PLN), to raise suficient revenue to maintain and expand electricity coverage.
The president failed to adequately communicate and advocate the govern-ment’s plans to raise gasoline and diesel prices in March, and street protests against the price rises were witnessed in Jakarta and other cities. The plans were eventually quashed when the parliament approved an increase that would take effect only if the Indonesian crude oil price (ICP) exceeded a threshold set 15% above the oil price assumption in the government budget (that is, a threshold of $121) on average over a six-month period in 2012 (Olivia and Yamauchi 2012: 151). The ICP was $112 in August and even lower in June and July, meaning that the trigger for the fuel price increase has been avoided.
In Indonesia protests against fuel price increases often involve university stu-dents, although others also participate. To better understand what the student
10 MP3EI stands for Masterplan Percepatan dan Perluasan Pembangunan Ekonomi Indo-nesia (Master Plan for the Acceleration and Expansion of IndoIndo-nesian Economic Develop-ment).
11 Many before us have highlighted the perverse effects of Indonesia’s burgeoning energy subsidies. See, for instance, OECD (2010: 71) and Suryadarma and Sumarto (2011: 163).
body thinks about the removal of fuel subsidies, we carried out a survey of 437 students across four faculties of the University of Indonesia during July–August 2012.12 Seventy per cent of the students indicated support for the removal of fuel subsidies,13 while 17% said they would protest if the subsidies were removed.The fact that some students would be willing to protest against fuel subsidy reforms helps to explain why the issue has become so politically heated. Nevertheless, the survey results support the idea that a well-communicated program of phased fuel subsidy reductions packaged with increased expenditure on other priorities could potentially attract majority support.
Of interest is that students who used a private car as their main means of trans-port were less likely to suptrans-port removing fuel subsidies.14 Students majoring in economics or accounting/management were more likely to support the subsidy removal,15 perhaps because they had a better understanding of opportunity cost and the function of prices.
With the 2014 election on the horizon, it seems that President Yudhoyono has missed his chance to oversee any substantial reduction in fuel subsidies. Despite securing fuel price increases in 2005 and 2008, the overall share of energy sub -sidies in central government expenditure in the proposed 2013 budget (24.1%) is almost the same as in 2004 (24.0%), the year he came to ofice. This record is unlikely to win the president a legacy as a green reformer.
Greenhouse gas emissions
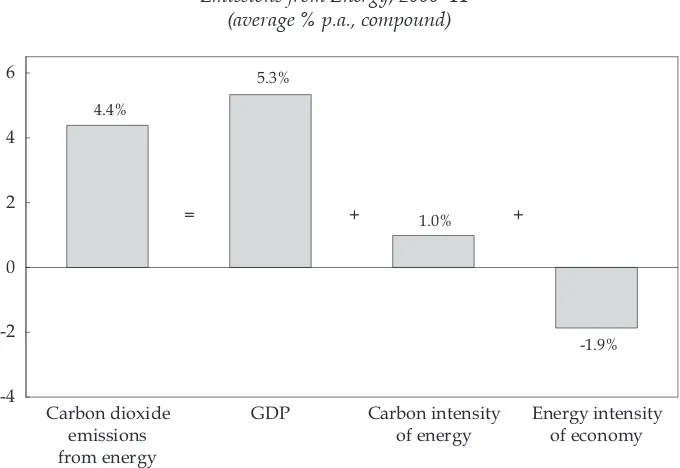
Indonesia is one of the largest emitters of greenhouse gases, and so one of the most important contemporary contributors to global climate change.16 Deforestation,
peatland drainage, peat ires and agriculture have been estimated to account for around two-thirds of Indonesia’s emissions (Ministry of Environment 2010: xi), although there is considerable uncertainty about this number. Per capita carbon dioxide emissions from energy remain small – only 39% of the global average – but are likely to account for an increasing share of total emissions in coming years. Carbon dioxide emissions from energy increased by 4.4% per annum on aver-age between 2000 and 2011. This is primarily because of the relatively rapid
12 The four faculties were economics; engineering; social and political science; and math-ematics and natural science. The survey was not nationally representative, but it does pro-vide a snapshot of the opinions of a segment of the Jakarta-based student population. 13 The question was phrased as follows: ‘Removal of fuel subsidies will raise the price of fuel, but provides an opportunity for the government to direct more money to other government priority programs, particularly improvement of roads and public transport. Do you support the policy of removal of fuel subsidies?’ The questionnaire was in Bahasa Indonesia. The italicised text was randomised over three options, with the other two being ‘education, health care and poverty eradication’ and ‘rural economic development, agricul-ture and irrigation’. There was no statistically signiicant association between the options and support for removing fuel subsidies.
14 Signiicantly different from zero at the 5% level in both linear and logit estimations, after controlling for gender, age and study major.
15 Signiicant at the 1% level.
16 The World Resources Institute (2011) estimates that Indonesia was the ifth largest emit-ter in 2005, afemit-ter China, the US, the EU and Brazil.
economic expansion over the period (of 5.3% per year on average), as the grow -ing economy has required more energy. The carbon intensity of energy has also increased (by 1.0% per year) due to Indonesia’s increasing use of coal. As in other countries, emission increases have been partly ameliorated by reductions in the overall energy intensity of the economy (by 1.9% per annum). Figure 3 provides a decomposition of the sources of growth in carbon dioxide emissions from energy since 2000.
An underlying challenge to moving to a lower-carbon economy is that coal is in many instances the least-cost electricity generation option in Indonesia (dis-regarding externalities). While renewable technologies are improving, coal’s cost advantage over most of the alternatives is likely to persist for some time. Given current policy settings, emissions will thus continue to rise quickly with increases in energy use and, in particular, the use of coal (Ministry of Environ-ment 2010: V-7).
Achieving low-carbon economic growth requires reductions in the carbon intensity of energy and the energy intensity of the economy. As igure 3 shows, the energy intensity of the economy has indeed decreased, but the carbon intensity of energy has increased. Phasing out fossil fuel subsidies would probably assist in reducing both. In the long run, the most eficient way to achieve emission reduc -tions in the energy sector is through a carbon price. The Ministry of Finance (2009) loated the idea of a carbon tax in a green paper, but little progress has been made since. A mechanism for cost pass-through in the electricity sector is a prerequisite
FIGURE 3 Decomposition of Growth in Carbon Dioxide Emissions from Energy, 2000–11a
(average % p.a., compound)
Carbon dioxide emissions from energy
GDP Carbon intensity of energy
Energy intensity of economy -4
-2 0 2 4 6
4.4%
5.3%
1.0%
-1.9%
= + +
a The decomposition approach is as used by Jotzo et al. (2012).
Source: 2000–09: IEA (2011). Data extended to 2011 using BP (2012).
for the introduction of a properly functioning carbon price (Howes and Dobes 2010: 65).
Among the energy options, geothermal appears to provide the greatest medium-term potential for facilitating low-carbon growth in Indonesia. In some instances it is cost competitive with coal, although geothermal costs are highly ‘front-loaded’ (that is, involving large initial capital outlays, with relatively low subsequent operating costs). Indonesia has the largest potential geothermal capac-ity of any country, of which only 4% is currently exploited. In 2010, geothermal energy supplied 5.5% of Indonesia’s electricity (Ministry of Energy and Mineral Resources 2011: 86).
The government’s second electricity ‘crash program’ envisions a rapid expan-sion of geothermal energy, which would contribute 48% of an electricity capacity increase of 10,000 megawatts by 2018 (WWF 2012: 14). In July the government announced an increase in the benchmark price for new geothermal projects to 10–18.5 cents per kilowatt hour, depending on location, as well as a tax holiday during exploration (Jakarta Globe, 5/9/2012). This followed the establishment in January of a funding facility under which local governments and geothermal licence holders can borrow up to $30 million to fund exploration and the acceler-ated construction of geothermal projects (Bisnis Indonesia, 18/1/2012).
These changes will increase the viability of private sector investment in geo-thermal projects, but it will still be dificult to meet the government’s ambitious expansion target. Challenges include that geothermal exploration is costly (and, of course, not guaranteed of success), that many of the most promising sites are in protected forest areas, that development requires linking geothermal sites to the distribution network, and that there is a shortage of suitably trained engi-neers. Institutional and policy factors also hinder geothermal development. Geo-thermal resources are managed by local governments, which typically have little by way of relevant expertise. Cashstrapped PLN faces incentives that discourage the pursuit of geothermal projects given the relative simplicity of expanding coal ired electricity. PLN has also been reluctant to provide independent power pro -ducers with power purchasing agreements due to uncertainty over government policy (WWF 2012: 16).
At the G20 meeting in Pittsburgh in 2009, President Yudhoyono committed Indonesia to reducing its greenhouse gas emissions by 26% relative to business as usual by 2020, and by 41% with international support. This commitment, which covers emissions from all sources, was signed into a presidential decree (No. 61/2011) in September 2011. Emission reduction initiatives have been listed under a 2011 National Action Plan for the Reduction of Greenhouse Gas Emis -sions, with the largest reductions slated to come from forests and peatlands. The National Action Plan generally relies on speciic projects implemented by govern -ment agencies rather than harnessing the ability of the private sector to deliver least-cost abatement. The government has also not formally locked in the busi-ness-as-usual emissions level against which the commitment will be evaluated, meaning that the 2020 target remains malleable (Jotzo 2012: 105). It is also worth noting that President Yudhoyono will have been out of ofice for six years by 2020, and that the next president might not regard the commitment as a binding obligation.
Indonesia has the potential to make money from emission reductions through the sale of carbon credits to the international market, although improvements in facilitating institutions and mechanisms are required for this to occur on any sizeable scale. Indonesia has 80 projects registered under the Clean Development Mechanism of the Kyoto Protocol, fewer than Malaysia or Vietnam (UNFCCC 2012). The government’s attention is primarily focused on facilitating payments for emission reductions under the United Nations’ Reducing Emissions from Deforestation and Forest Degradation (REDD+) scheme.
Forests
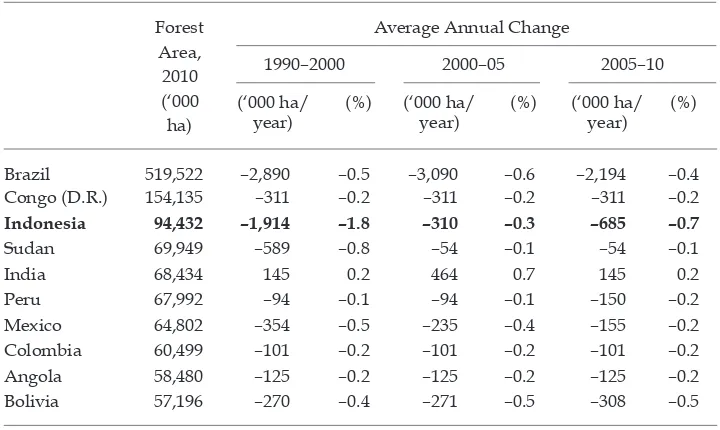
Probably the most pressing environmental concern for Indonesia is the loss of its natural forests, which continues at a rapid pace due to demand for timber and for land for alternative uses such as oil palm plantations and mining. Deforesta-tion rates are contested, but the Ministry of Forestry estimates that approximately 0.45 million hectares, or 0.5% of Indonesia’s forests, were lost in 2011 (Antara, 23/7/2012).17 This is a slower rate than witnessed in recent years, but it remains high relative to comparable countries (table 4).
A major milestone in efforts to reduce deforestation was a May 2010 commit -ment of $1 billion by the govern-ment of Norway to support the imple-mentation of REDD+ in Indonesia. The commitment, over eight years, is not particularly large in the context of the Indonesian budget or economy, but has focused attention on
17 Differences in deinitions and measurement approaches lead to differences in estimates of forest cover. See Indrarto et al. (2012: 2) for a comparison of forest data sources.
TABLE 4 Deforestation in Tropical Countriesa
Forest Area,
2010 (‘000
ha)
Average Annual Change
1990–2000 2000–05 2005–10
(‘000 ha/ year)
(%) (‘000 ha/ year)
(%) (‘000 ha/ year)
(%)
Brazil 519,522 –2,890 –0.5 –3,090 –0.6 –2,194 –0.4
Congo (D.R.) 154,135 –311 –0.2 –311 –0.2 –311 –0.2
Indonesia 94,432 –1,914 –1.8 –310 –0.3 –685 –0.7
Sudan 69,949 –589 –0.8 –54 –0.1 –54 –0.1
India 68,434 145 0.2 464 0.7 145 0.2
Peru 67,992 –94 –0.1 –94 –0.1 –150 –0.2
Mexico 64,802 –354 –0.5 –235 –0.4 –155 –0.2
Colombia 60,499 –101 –0.2 –101 –0.2 –101 –0.2
Angola 58,480 –125 –0.2 –125 –0.2 –125 –0.2
Bolivia 57,196 –270 –0.4 –271 –0.5 –308 –0.5
a Data are estimates for the 10 developing countries with the largest tropical forest cover.
Source: FAO (2010).
the task. The agreement makes phased transfers of the funds conditional on the implementation of pilot schemes and a deforestation moratorium, the establish-ment of a REDD+ strategy and institutions, and measured achieveestablish-ments in reduc-ing emissions. To date only $30 million has been disbursed, with the majority of the funds slated to be transferred after 2014 upon the veriication of actual emis -sion reductions (Royal Norwegian Embassy in Jakarta 2012).
As part of the agreement with Norway, Presidential Decree 10/2011 estab -lished a two-year moratorium on new permits to clear primary forests and peat-lands throughout Indonesia. This was a noteworthy step, although exemptions exist (for projects to develop energy, rice or sugar, for example) and implementa -tion has been challenging given weaknesses in land titling and enforcement (see box 1). The moratorium does not affect existing permits (which are sizeable) or the allocation of new permits to clear secondary forests. Whether it will be extended in 2013 is unclear.
The government is investing considerable effort in implementing REDD+. The president appointed the President’s Delivery Unit for Development Monitoring and Oversight (Unit Kerja Presiden Bidang Pengawasan dan Pengendalian Pem -bangunan, UKP4) to manage initial implementation, and signed a presidential decree (No. 25/2011) establishing a REDD+ Task Force. The head of UKP4, Kun -toro Mangkusubroto, who is close to the president, chairs the task force and has been charged with making the scheme a success.
BOX 1 The Tripa Case
The case of the Tripa peatland forests in Aceh highlights some of the challenges faced in the management of Indonesia’s forests. More than 1,100 hectares of for-est – an important area for orangutans – were burned by two companies before and during March 2012, despite a prohibition under the national deforestation moratorium on the issuance of new concessions on land with more than three metres of peat. The companies were allegedly given oil palm plantation per-mits by the (then) governor of Aceh even after Tripa was shown as a protected area on the national moratorium map (Jakarta Globe, 9/7/2012). The president responded by calling for an immediate end to the burning, and investigations were launched. In August a court revoked the permit of one of the companies following a challenge led by the Aceh chapter of the Indonesian Forum for the Environment (Wahana Lingkungan Hidup, Walhi).
The high proile given to the Tripa case is indicative of a renewed national emphasis on conserving Indonesia’s forests. Yet the case is also a reminder of the dificulty of administering forest regulations in Indonesia given the attractive economics of alternative land uses and ongoing institutional weaknesses, includ-ing problems of coordination between different levels of government.
The case is but one of numerous recent instances of illegal forest conversion; in September, for instance, oficials announced an investigation into the illegal burning of 200 hectares of protected forest in Tanjung Batu, East Kalimantan (Jakarta Globe, 8/9/2012). Permits to legally clear more than 300,000 hectares of forest have been issued so far during 2012 (Jakarta Globe, 7/8/2012).
The task force has established 10 working groups to develop the policy and institutional infrastructure for REDD+. A REDD+ National Strategy, released in June 2012, proposes the establishment of several implementing institutions: a REDD+ agency (to govern and coordinate all REDD+ activities, led by an agency head whose position will be equal to a minister); a REDD+ funding instrument (to manage and facilitate the distribution of funds); and a REDD+ measurement, reporting and veriication institution (Indonesia REDD+ Task Force 2012). There are currently over 45 demonstration activities, about half of them in Kalimantan (Forest Climate Center 2012). Progress is also being made in producing a single map of Indonesia’s forests; numerous maps had existed, but they were full of inconsistencies.
There are numerous challenges to the successful implementation of REDD+ in Indonesia. Negotiations with international partners are proceeding slowly, and the prospects for a functioning international market in permits from emission reductions from deforestation within the next few years appear slim. Achieving broad institutional backing for REDD+ at both the central and local levels has also been dificult. There is a risk that the REDD+ agency will be relatively weak, and the degree of support for REDD+ from the public and those outside the presi-dent’s immediate circle is also untested. If the next president does not provide adequate backing for REDD+, its implementation in Indonesia may well fail.
Challenges on the ground are also large. Ensuring that payments actually reach those whose actions result in reduced emissions is dificult, and there are seri -ous dificulties with land tenure, forest monitoring and emissions measurement (Indrarto et al. 2012). Conlicts within communities, corruption and weak law enforcement capacity further complicate REDD+ implementation. Experience shows that the rents from forests lead to conlicts between government agencies, and also between these agencies and communities (Resosudarmo et al. 2012). Improved social safeguards are required, including ensuring that the principle of free and prior informed consent of local communities is applied (Indrarto et al. 2012).
Proits from alternative land uses such as oil palm are likely to remain higher than any payments for avoided deforestation for the foreseeable future, mean-ing that private incentives will continue to favour forest clearmean-ing (Hunt 2010). REDD+ will thus not replace the need for formal restrictions on land use in forest areas. But it remains early days for the scheme. If it is able to generate credible emission reductions and link to international carbon markets, it might eventually become an important economic mechanism for the sustainable management of Indo nesia’s forests.
TWO COMMODITY BOOMS: COAL AND PALM OIL
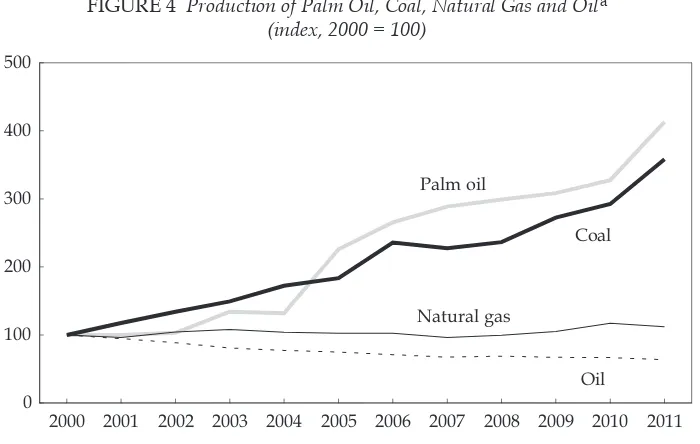
Recent years have seen booms in coal and palm oil production. While oil output has been declining and the natural gas sector has stagnated, coal production more than tripled and palm oil production quadrupled during 2000–11 (igure 4). Indo -nesia is now the world’s largest producer of palm oil and largest exporter of both palm oil and coal. In 2011 exports of coal were worth $27.2 billion and exports of palm oil $17.3 billion. The combined contribution of the two commodities to total merchandise exports reached 21.9% in 2011, up from only 3.8% in 2000. Since 2009,
these combined exports of coal and palm oil have exceeded combined exports of oil and natural gas.
Indonesia’s success in coal and palm oil is part of a global commodity boom associated with the rise of China and India. Prices for the two commodities have increased substantially in recent years, although they have fallen from their his-torical highs. Over the year to mid-September, the average international price of Indonesian coal fell by 26% and the crude palm oil price by 9% (World Bank 2012c). Despite these falls, the values of coal and palm oil exports during the irst seven months of 2012 exceeded those during the irst seven months of 2011 by 10% and 14% respectively (BI 2012a).
The boom in palm oil has brought sizeable economic beneits to rural com -munities, predominantly outside Java. Data from the National Labour Force Sur-vey (Sakernas) indicate that 1.7 million people worked on oil palm plantations in 2010, equal to 1.6% of total employment. Permanent workers on the plantations received an average wage of Rp 6,400 per hour, slightly higher than permanent workers on food crop farms.
In 2010, 42% of the land area of oil palm plantations was managed by small-holders (DJP 2011). While good from the point of view of community involve -ment, smallholders typically have below-average productivity and are not able to exploit economies of scale. Some ind it dificult to access loans because they lack land tenure documents. There have also been numerous disputes involving plantation estates and local people (McCarthy, Gillespie and Zen 2011).
Coal mining is a much smaller contributor to jobs, providing only 0.2% of total employment, although the sector provides considerable lowon beneits to local economies. Sakernas data indicate that permanent coal mine workers received a
FIGURE 4 Production of Palm Oil, Coal, Natural Gas and Oila
(index, 2000 = 100)
2000 2001 2002 2003 2004 2005 2006 2007 2008 2009 2010 2011 0
100 200 300 400 500
Palm oil
Coal
Natural gas
Oil
a Oil is crude and condensate.
Source: CEIC Asia Database.
relatively high average wage of Rp 15,000 per hour in 2011, more than 70% higher than the average for all permanent workers.
One issue affecting the coal sector is uncertainty over mining permits. Since the enactment of Law 22/1999 on Regional Government, supported by Law 4/2009 on Mineral and Coal Mining, provincial and local governments have had the right to grant mining licences. These have often been issued with little consultation with other agencies, and in many instances multiple licences have been issued for the same area (Resosudarmo et al. 2012).
The coal sector has also seen rapid expansion in ‘people’s mining’, often termed ‘illegal mining’. The 2009 mining law provides equal opportunity for corporate and people’s mining on mining land. Owing to licence processing dificulties, however, many small miners are reluctant to obtain a permit. Without a permit, they typically operate on the periphery of areas that are licensed to large mining operations, and because of their informal status do not duly contribute to govern-ment revenue collected from the sector. Also, people’s mining is often carried out without adequate capital equipment and on a very small scale, and thus tends to be ineficient (Gandataruna and Haymon 2011).
The palm oil and coal sectors illustrate the tensions involved in achieving rapid economic growth while conserving key environmental assets. Oil palm planta-tions covered 8.9 million hectares in 2011 (DJP 2011), and have been the largest contributor to deforestation in recent years. The area of land affected by coal mining is also large; Indrarto et al. (2012: 31) report that 3.1 million hectares of coal-mining concessions have been allocated in East Kalimantan alone. Most coal mines are open-cut operations in previously forested areas, often polluting local rivers and ecosystems. Land reclamation following coal mining is generally lim-ited to the small area where the soil has been moved, and non-native species are typically planted. Large areas are often left without fertile soil and remain deso-late (Resosudarmo et al. 2009).
One option to reduce the environmental impact of the oil palm industry, listed as a ‘core activity’ in the 2011 National Action Plan for the Reduction of Green -house Gas Emissions, is to focus expansion on degraded land rather than peatland or primary forest. Doing so would require an improved mechanism for identify-ing and rezonidentify-ing degraded land, although it would be important not to provide an incentive to degrade high-value conservation areas.
In response to the environmental concerns of consumers and foreign govern-ments, particularly in Europe, in March 2011 the Ministry of Agriculture intro-duced a mandatory Indonesia Sustainable Palm Oil (ISPO) scheme. Expected to be fully operational by 2014, the scheme aims to ensure palm oil is produced in accordance with existing laws and regulations. It will not affect the continuing conversion of forests and peatland to plantations if this occurs under valid per-mits. In September 2011, the Indonesian Palm Oil Growers Association, Gabun -gan Pengusaha Kelapa Sawit Indonesia (Gapki), resigned from the (somewhat stricter) international Roundtable on Sustainable Palm Oil (RSPO) certiication process, citing the costs involved in compliance. Some companies have received RSPO certiication, although certiied palm oil currently attracts only a small price premium. Given monitoring dificulties and the scale of the industry, there are substantial implementation challenges for these certiication schemes.
TOURISM
Recent developments
Indonesia’s tourism sector remains less developed than those of some of its neighbours.18 Tourism contributes around 3% of GDP, compared with 7% in
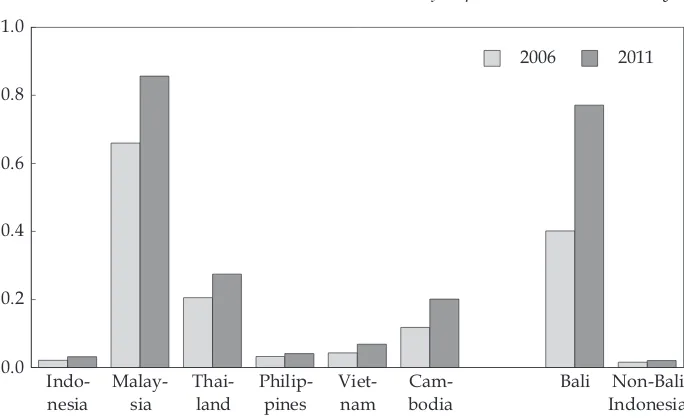
both Malaysia and Thailand. Indonesia has around 1,500 rooms of accommoda -tion per 100,000 people, far fewer than Malaysia (6,000) or Thailand (6,500). In 2010, Indonesians are estimated to have made one domestic tourism trip each on average, fewer than Malaysians (5) or Thais (1.5). Revenue from international visitors, which amounted to $9 billion in 2011, is an important source of foreign exchange, although much smaller than in either Malaysia ($19 billion) or Thailand ($31 billion). For its population, Indonesia – and particularly non-Bali Indonesia – receives relatively few international visitor arrivals (igure 5).
International tourism in Indonesia experienced a dificult decade following the Asian inancial crisis of 1997–98. The effects of the crisis and its aftermath were compounded by the terrorist attacks that occurred during the irst years of the new century. October 2012 marked the 10th anniversary of the irst bombings
in the Bali tourist district of Kuta; the attacks killed more than 200 people and caused international arrivals to Bali to drop by more than a quarter.19 Bombings of
18 For a review of earlier developments in the tourism sector, see Booth (1990). The data cited in this section are from the World Tourism Organization (2012), the World Travel & Tourism Council (2012) and the sources listed for igure 5.
19 Henderson (2003) reviews the effects of the Bali bombings.
FIGURE 5 International Visitor Arrivals Per Head of Population in Host Countrya
Indo-nesia
Malay-sia
Thai-land
Philip-pines
Viet-nam
Cam-bodia
Bali Non-Bali Indonesia 0.0
0.2 0.4 0.6 0.8 1.0
2006 2011
a Data are for the point of arrival; domestic transfers into or out of Bali are not relected in the Bali/
non-Bali division.
Source: BPS; CEIC Asia Database; World Bank (2012d).
the JW Marriott Hotel (2003), the Australian Embassy (2004), tourist areas in Bali (2005) and the Ritz and JW Marriott hotels (2009), and other terrorist incidents, also affected tourist arrivals.
The campaign against terrorism has been relatively successful. No large-scale attack has occurred in Indonesia since 2009, although police continue to disrupt scattered terrorist groupings, including in raids in March on a group in Bali that was apparently planning to attack tourists (Jakarta Globe, 18/3/2012). Security initiatives at international hotels have complemented the government’s efforts to return calm to the sector. As a result, arrivals increased by 9% per annum on average during 2006–12, a time of relatively slow global growth in international visitor lows. Based on arrivals in the irst seven months of the year, it is likely that Indonesia will receive more than 8 million international visitors in 2012, up from 7 million in 2010 and 5 million in 2006. Tourist arrivals have been growing faster than business arrivals, and accounted for 63% of total arrivals in 2010. Australia relaxed its travel warning on Indonesia in May 2012, which may help to further increase arrival numbers. The US removed its travel warning in 2008.
Recent years have seen a growing inlow of visitors from the AsiaPaciic, with particularly fast growth in arrivals from China (46% per annum over 2002–11) and India (19%). Growth in arrivals from ASEAN countries (5%) has been aided by the removal of visa charges for most ASEAN citizens. Asia and Oceania now account for almost fourifths of international visitor arrivals.
Bali’s tourism sector is much more developed than those of other provinces. Bali directly receives 36% of the international arrivals to Indonesia, and many domestic tourists as well. According to one estimate, around half of Bali’s econ-omy relies on tourism (ILO 2011: 11). Tourism has made a large contribution to poverty reduction in Bali, which has the lowest poverty rate of provinces outside Jakarta – of 4.2% in 2011, compared with the national rate of 12.5% (BPS 2012).
Tourism growth potential
Tourism has the potential to be an important source of growth in Indonesia’s economy, and one that provides employment opportunities in geographically diverse regions. While air lights are emissions intensive, and tourists have a high demand for energy-intensive goods and services and ecosystem-changing facili-ties such as golf courses, a healthy tourism sector in many respects aligns with conservation efforts (Buckley 2011). This is because maintaining a clean environ-ment and natural assets such as forests, beaches and coral reefs is important for attracting tourists. Maintaining healthy populations of species such as orang utans is important for the development of ecotourism.
A recent assessment of tourism competitiveness by the World Economic Forum (2012) ranks Indonesia favourably for its natural resources (17th out of 139 sur-veyed economies) and cultural resources (39th), but very poorly in terms of envi-ronmental sustainability (127th), the time required to start a business (119th), the availability of hotel, car rental and banking facilities (116th), health and hygiene
(115th) and the business costs associated with terrorism (101st). Indonesia also per-forms poorly in terms of the quality of toilets in tourist areas.20 Improvements
20 In 2011, the World Toilet Association ranked Indonesia below the Philippines, Malaysia, Singapore and Thailand in terms of toilet quality (Jakarta Post, 12/12/11).
in these areas would make the country a more attractive option for tourists and tourism investors.
A challenge facing the tourism sector is for provinces outside Bali to attract more tourists. The Master Plan for 2011–25 (MP3EI) focuses tourism development on Bali and Nusa Tenggara, but in our view other provinces also have substantial potential for tourism development. The strategic plan for 2012–14 of the Ministry of Tourism and Creative Economy (2012: xv) has a broader vision for tourism than the MP3EI, including a focus on developing 16 strategic tourism sites around the country.
While domestic air trafic has increased rapidly, further improvements in national connectivity are required before a sizeable tourism industry becomes viable in some areas. Considerable investment in upgrading airports is under way. A new international terminal is being built at Bali’s Ngurah Rai International Airport, and Jakarta’s Soekarno–Hatta International Airport is being expanded. The new airports under the proposed 2013 budget are to be located in eastern Indonesia. Certain areas, such as Papua, will essentially remain offbounds for tourists until political and security problems are resolved.
Bali’s tourism sector is facing growing problems of over-development, traf-ic congestion, crime, water shortages, electrtraf-icity outages and pollution (Time, 9/4/2011). Visitors complain about rubbish in the ocean and on the beach. In 2011, Bali’s governor placed a moratorium on new hotel development in some built-up areas in the south of the island. An increased focus on infrastructure and waste management is required if the sector is to continue to grow in Bali.
There is an increasing focus on improving the sustainability of the ‘blue eomy’, particularly the ecologically important Coral Triangle, an area that con-tains around 30% of the world’s coral reefs and that is vital for both tourism and ishing. In 2009 President Yudhoyono announced a target of having 20 million hectares of sea areas protected by 2020. The president was also instrumental in establishing the Coral Triangle Initiative on Coral Reefs, Fisheries and Food Secu-rity, a 2007 partnership with Malaysia, Papua New Guinea, the Philippines, the Solomon Islands and Timor Leste, with a secretariat in Jakarta. As the chair of APEC in 2013, Indonesia intends to promote a focus on the blue economy.
Other regional initiatives may also serve to increase the number of tourists visit-ing Indonesia. There are moves to establish a svisit-ingle visa for the whole of ASEAN, although this is unlikely to cover all ASEAN countries for some time to come. The ongoing ASEAN tourism campaign may also beneit Indonesia given that it lags behind its neighbours in international tourism brand recognition. There remains large potential for continued growth in tourist arrivals from China and India, the region’s rising giants.
REFERENCES
Anas, T. (2012) ‘Indonesia’s new protectionist trade policies: a blast from the past’, East Asia Forum, 18 June, available at <http://www.eastasiaforum.org/2012/06/18/ indonesia-s-new-protectionist-trade-policies-a-blast-from-the-past/>.
APEC (AsiaPaciic Economic Cooperation) (2012) ‘2012 leaders’ declaration’, available at <http://www.apec.org/MeetingPapers/LeadersDeclarations/2012/2012_aelm. aspx>.
Baird, M. and Wihardja, M.M. (2010) ‘Survey of recent developments’, Bulletin of Indonesian Economic Studies 46 (2): 143–70.
BI (Bank Indonesia) (2012a) Indonesian Financial Statistics, Jakarta, available at <http:// www.bi.go.id/web/en/Statistik>.
BI (Bank Indonesia) (2012b) ‘Bank Indonesia and government coordinated measures to overcome increasing current account deicit’, Jakarta, 10 August, available at <http:// www.bi.go.id/web/en/Ruang+Media/Siaran+Pers/sp_142912.htm>.
Booth, A. (1990) ‘The tourism boom in Indonesia’, Bulletin of Indonesian Economic Studies 26 (3): 45–73.
BP (2012) Statistical Review of World Energy, London.
BPS (Badan Pusat Statistik) (2012) ‘Number and percentage of poor people, poverty line, poverty gap index, poverty severity index by province’, Jakarta, available at <http:// dds2.bps.go.id>.
Buckley, R. (2011) ‘Tourism and environment’, Annual Review of Environment and Resources
36: 397–416.
CSIS (Centre for Strategic and International Studies) (2012) Survei Nasional CSIS Juni/Juli 2012 [CSIS National Survey June–July 2012], Jakarta.
DJP (Direktorat Jenderal Perkebunan) (2011) Buku Statistik Perkebunan Tahun 2009–2011 [Plantation Statistics Yearbook 2009–2011], Jakarta.
FAO (Food and Agriculture Organization) (2010) ‘Global forest resource assessment 2010’, FAO Forestry Paper No. 163, Rome.
Fealy, G. (2011) ‘Indonesian politics in 2011: democratic regression and Yudhoyono’s regal incumbency’, Bulletin of Indonesian Economic Studies 47 (3): 333–53.
Forest Climate Center (2012) ‘Indonesia REDD demonstration projects – update March 2012’, available at <http://forestclimatecenter.org>.
Gandataruna, K. and Haymon, K. (2011) ‘A dream denied? Mining legislation and the Con-stitution in Indonesia’, Bulletin of Indonesian Economic Studies 47 (2): 221–31.
Henderson, J.C. (2003) ‘Terrorism and tourism’, Journal of Travel & Tourism Marketing 15 (1): 41–58.
Howes, S. and Dobes, L. (2010) Climate Change and Fiscal Policy: A Report for APEC, World Bank.
Hunt, C. (2010) ‘The costs of reducing deforestation in Indonesia’, Bulletin of Indonesian Economic Studies 46 (2): 187–92.
IEA (International Energy Agency) (2011) CO2 Emissions from Fuel Combustion, Paris. ILO (International Labour Organization) (2011) Measuring Employment in the Tourism
Indus-tries beyond a Tourism Satellite Account: A Case Study of Indonesia, Jakarta.
IMF (International Monetary Fund) (2012a) ‘Primary commodity prices’, Washington DC, available at <http://www.imf.org/external/np/res/commod/index.aspx>.
IMF (International Monetary Fund) (2012b) ‘Indonesia: selected issues’, IMF Country Report No. 12/278, Washington DC, September.
Indonesia REDD+ Task Force (2012) REDD+ National Strategy, Jakarta, June.
Indrarto, G.B. et al. (2012) ‘The context of REDD+ in Indonesia: drivers, agents and insti-tutions’, Working Paper 92, Center for International Forestry Research (CIFOR) and Indonesian Center for Environmental Law (ICEL), Bogor.
Jotzo, F. (2012) ‘Can Indonesia lead on climate change?’, in Indonesia Rising: The Reposition -ing of Asia’s Third Giant, ed. A.S. Reid, Institute of Southeast Asian Studies, S-ingapore: 93–116.
Jotzo, F., Burke, P.J., Wood, P.J., Macintosh, A. and Stern, D.I. (2012) ‘Decomposing the 2010 global carbon dioxide emissions rebound’, Nature Climate Change 2 (4): 213–14. Lindblad, J.T. and Thee K.W. (2007) ‘Survey of recent developments’, Bulletin of Indonesian
Economic Studies 43 (1): 7–33.