E-ISSN: 2347-5129 P-ISSN: 2394-0506
(ICV-Poland) Impact Value: 5.62 (GIF) Impact Factor: 0.549 IJFAS 2017; 5(3): 356-360 © 2017 IJFAS
www.fisheriesjournal.com Received: 15-03-2017 Accepted: 16-04-2017
Felly A Esilaba
Department of Environmental Sciences, Egerton University, Egerton, Kenya
Wilkister N Moturi
Department of Environmental Sciences, Egerton University, Egerton, Kenya
Millicent A Mokua
Department of Environmental Sciences, Egerton University, Egerton, Kenya
Correspondence Felly A Esilaba
Department of Environmental Sciences, Egerton University, Egerton, Kenya
Urban consumers’ fish preferences and the
determinants influencing fish selection and
consumption: Case study of Nakuru Town, Kenya
Felly A Esilaba, Wilkister N Moturi and Millicent A Mokua
Abstract
Existing literature suggests that research done in the fisheries sector in Kenya has a strong focus on fish production, leaving many questions on marketing and consumption patterns of fish unanswered. This study focused on assessing urban consumers’ fish preferences and the determinants of fish selection and consumption. A total of 385 questionnaires were administered to fish customers in the major fish markets in Nakuru town, Kenya. Tilapia, Silver sardine, Nile perch and Lungfish were the widely consumed fish species in Nakuru town. Average Tilapia, Silver sardine, Nile perch and Lungfish consumption per month was 0.79841, 0.35357, 1.03862 and 0.564803 kilograms respectively. The main determinants of purchasing either one of the four widely consumed fish species were price, convenience, safety concerns and experience. There is a need to introduce fish labeling as well as enhance convenience traits like filleting to all available fish varieties in order to increase fish consumption.
Keywords: Fish, species, preference, consumption, urban, consumers
1. Introduction
Fish is an important source of proteins, essential nutrients and trace elements [1, 2, 3]. It has low
fat content and is easy to digest due to lack of connective tissue [1]. Because of these reasons
fish has for a long time been promoted as an important component of a healthy meal [1, 2, 3, 4, 5].
Several studies have documented the health and nutritive benefits associated with fish consumption. Important among these benefits include increased intelligence and cognitive development in children, reduced risk of cardio vascular disorders, reduced risk of high blood pressure and various forms of cancers [1, 6].
In the past few decades there has been a significant growth in the fisheries and aquaculture production [7, 8]. This growth has seen a gradual increase in the world’s annual per capita fish
consumption from an average of 9.9 kilograms in the 1960s to 14.4 kilograms in the 1990s and 19.7 kilograms in 2013, with FAO estimates indicating that the 2015 average exceeded 20 kilograms [7, 8]. Nonetheless, this increase has not been uniform across all the regions of the
world [7, 8]. For instance, fish consumption has grown substantially in the last few decades in
East Asia (from 10.8 in 1961 to 39.2 kilograms in 2013), Southeast Asia (from 13.1 to 33.6 kilograms) and North Africa (from 2.8 to 16.4 kilograms in 2013). Together these regions have been responsible for the growth of the world’s per capita fish consumption [7, 8, 9]. In contrast,
fish consumption in sub-Saharan countries including Côte d’Ivoire, Liberia and South Africa has remained almost static while consumption in Kenya has declined from 6.0 kilograms in the year 2000 to 4.5 kilograms in 2011[7, 8, 9, 10]. One possible explanation for this scenario is the
fact that approximately 90 percent of fish products consumed within the sub-Saharan region is provided by inland fisheries as marine catches are destined for export and thus play very little role in meeting the fish demand of the continent [9]. In addition, aquaculture development in
Africa has trailed far behind that seen in other regions of the world yet fish farming offers a great opportunity to supplement the declining stocks of capture fisheries [7, 9, 10].
High prices, limited preparation, cooking and eating skills, sensory factors like taste and smell and, consumers’ attitudes and socio-demographic characteristics [1, 4, 5] could be contributing
In deed a review of existing literature on fisheries and aquaculture development in Kenya indicates a strong production focus leaving many questions on fish marketing, purchase and consumption behaviour unanswered [11, 12]. An
assessment of purchase and consumption patterns of fish therefore provides important information to guide fish production in Kenya as well as ensure contemporary concepts like market oriented production are applied in the aquaculture subsector. The goal of this study was to assess urban consumers’ fish preferences and the determinants that influenced fish selection and consumption.
2. Materials and Methods
To accomplish the objectives of this research a questionnaire-based consumer survey was designed and conducted between the months of June and August 2015. A multistage purposive sampling procedure was used to select the survey population with the main sampling units being the 5 major fish markets in Nakuru town (The Main Municipal Market, Open Air Municipal Market, Ponda Mali Market, Tuskys Supermarket and Gilanis Butchery). Random sampling was conducted to select 385 fish consumers from these markets using the following formula
[13]
.
Prior to administering the questionnaires, theinstrument was pre-tested on 40 respondents selected by
convenience from fish markets other than the ones identified for this study.
The accuracy and reliability of the data was enhanced by ensuring that the participants were willing and available to participate in the survey. In addition, only respondents with the responsibility of making household purchasing decisions were considered appropriate to participate in the survey. Descriptive analysis was done using means, percentages and frequency distribution. Inferential analysis was done using Chi-square test of independence and Kruskal Wallis H Test. All data analyzed was considered significant at 95% confidence interval with 5% error margin.
3. Results
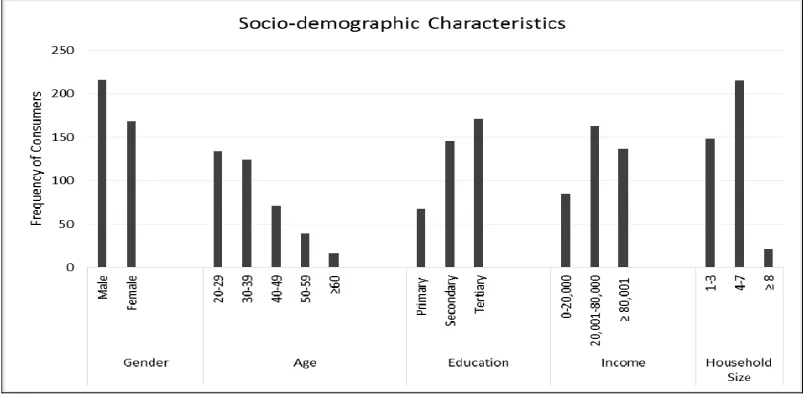
3.1 Socio-demographic characteristics of fish consumers The gender composition of the study respondents revealed slightly higher proportion of male fish buyers (56%) than their female counterparts (44%). Majority of fish buyers were below 40 years of age with all having achieved a certain level of formal education. With regards to family income, 78% of the respondents reported earning a joint family income of above 20,000 Kenyan shillings per month. The findings also indicate that 95% of the respondents came from small to medium households of between 1-7 members.
Fig 1: Socio - demographic characteristics of the sampled fish customers
3.2 Consumers preference for different fish species The findings summarized in Table 1 reveal that Tilapia
(Oreochromis niloticus) was consumed by majority (95%) of
those who buy and consume fish from fish markets in Nakuru town. Other widely consumed fish species were Silver sardine
(Rastrineobola argentea), Nile perch (Lates niloticus) and
Lungfish (Protopterus aethiopicus). Additionally, fish species grouped as ‘others’ and consumed by only 8% of fish consumers were haplochromis, cray fish, trout, cichlids and barbus spp.
Table 1: Consumers’ fish preference
Consumer’s Fish Preference
Tilapia 364 (95%) Catfish 58 (15%)
Silver Sardine 260 (68%) Common carp 43 (11%)
Nile Perch 202 (52%) Others 31 (8%)
Lungfish 189 (49%)
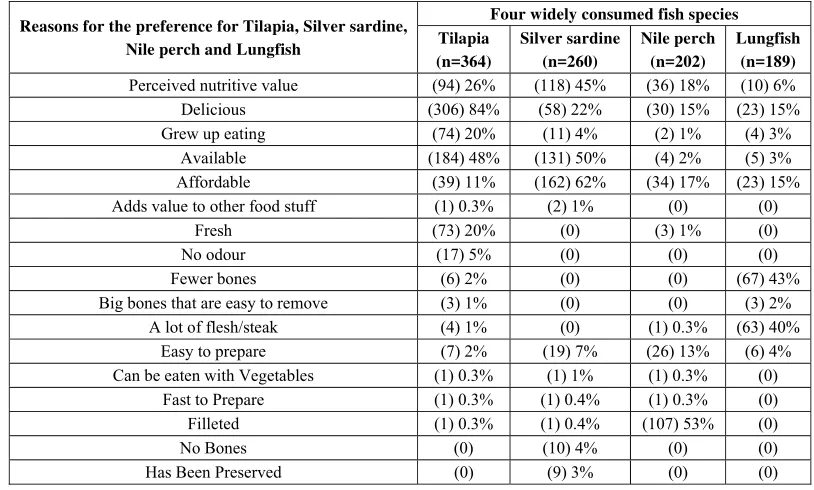
3.3 Reasons for the preference for Tilapia, Silver sardine, Nile perch and Lungfish species
Table 2: Reasons for preference for the four widely consumed fish species
Reasons for the preference for Tilapia, Silver sardine, Nile perch and Lungfish
Four widely consumed fish species Tilapia
(n=364)
Silver sardine (n=260)
Nile perch (n=202)
Lungfish (n=189)
Perceived nutritive value (94) 26% (118) 45% (36) 18% (10) 6%
Delicious (306) 84% (58) 22% (30) 15% (23) 15%
Grew up eating (74) 20% (11) 4% (2) 1% (4) 3%
Available (184) 48% (131) 50% (4) 2% (5) 3%
Affordable (39) 11% (162) 62% (34) 17% (23) 15%
Adds value to other food stuff (1) 0.3% (2) 1% (0) (0)
Fresh (73) 20% (0) (3) 1% (0)
No odour (17) 5% (0) (0) (0)
Fewer bones (6) 2% (0) (0) (67) 43%
Big bones that are easy to remove (3) 1% (0) (0) (3) 2%
A lot of flesh/steak (4) 1% (0) (1) 0.3% (63) 40%
Easy to prepare (7) 2% (19) 7% (26) 13% (6) 4%
Can be eaten with Vegetables (1) 0.3% (1) 1% (1) 0.3% (0)
Fast to Prepare (1) 0.3% (1) 0.4% (1) 0.3% (0)
Filleted (1) 0.3% (1) 0.4% (107) 53% (0)
No Bones (0) (10) 4% (0) (0)
Has Been Preserved (0) (9) 3% (0) (0)
3.4 Major barriers to fish consumption
Fish consumers were asked why they did not consume higher quantities of fish. They were also asked what prevented them from consuming fish varieties that they don’t normally consume. Table 3 indicates that 81% of the study respondents stated that some fish varieties like Tilapia and Nile perch were
very expensive. Twenty eight (28%) reported that they grew up not eating some of the fish varieties found in the market. Another very interesting finding was that some species like Lungfish and Catfish were visually not appealing in fact some consumers said that these species do not look like fish at all.
Table 3: Barriers to fish consumption
Barriers to fish consumption
Price 312 (81%) Not available 100 (26%)
Lack of preparation skills 235 (61%) Lack of quality assessment skills 87 (23%)
Safety concerns 110 (29%) Not visually appealing 54 (14%)
Did not grow up eating 106 (28%)
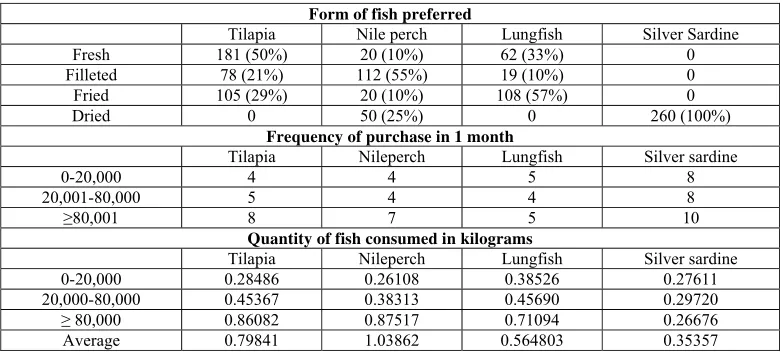
3.5 Forms in which Tilapia, Silver sardine, Nile perch and Lungfish species were purchased
As presented in table 4 majority of those who bought and consumed Tilapia species purchased fresh unfilleted Tilapia. Fifty five percent of those who purchased Nile perch species preferred Nile perch fillets whereas fifty seven percent of those who consumed Lungfish species preferred the pre-cooked option of this species (deep fried in cooking oil).
3.6 Frequency of purchase for the widely consumed fish species
Frequency of consumption per month of the widely consumed fish species was categorized based on the income level of the study participants. Results summarized in table 4 indicate that fish consumers in the ≥ 80,001 Kenya Shillings income group generally purchased fish more frequently than those in the
0-20,000 and 20,001-80,000 Kenya Shillings income groups. The findings also indicate that the high income earners purchased Tilapia and Nile perch species more frequently (χ2
(6, N = 385) = 50.646, p<0.05) in a month than their counterparts in the lower income brackets.
3.7 Quantity of Tilapia, Silver sardine, Nile perch and Lungfish consumed
Table 4: Form, frequency and quantity of fish consumed
Form of fish preferred
Tilapia Nile perch Lungfish Silver Sardine
Fresh 181 (50%) 20 (10%) 62 (33%) 0
Filleted 78 (21%) 112 (55%) 19 (10%) 0
Fried 105 (29%) 20 (10%) 108 (57%) 0
Dried 0 50 (25%) 0 260 (100%)
Frequency of purchase in 1 month
Tilapia Nileperch Lungfish Silver sardine
0-20,000 4 4 5 8
20,001-80,000 5 4 4 8
≥80,001 8 7 5 10
Quantity of fish consumed in kilograms
Tilapia Nileperch Lungfish Silver sardine
0-20,000 0.28486 0.26108 0.38526 0.27611
20,000-80,000 0.45367 0.38313 0.45690 0.29720
≥ 80,000 0.86082 0.87517 0.71094 0.26676
Average 0.79841 1.03862 0.564803 0.35357
4. Discussion
Capture fisheries contributes approximately 140,000 metric tonnes of fish products annually [14, 15]. Fish species that
dominate capture fisheries include Silver sardine, Nile perch, Tilapia, African Catfish and Lungfish [14, 16]. Together they
contribute approximately 124,000 metric tonnes of fish to the annual capture fisheries production [14]. Out of this Kenya
exports only about 7000 metric tonnes of fish annually [14]
which means that the bulk of fish landings is sold domestically. This probably explains why Tilapia, Silver sardine, Nile perch and Lungfish were found to be the widely consumed fish species. It indicates that fish consumers purchased and consumed fish species that were available for them in the local markets. Moreover, the recent increase in production of farmed fish from approximately 4,452 metric tonnes in 2008 to 23,501 metric tonnes in 2013 increased the production of the Tilapiine varieties that form up to 70 percent of the total farmed fish in Kenya [12, 14].
Previous studies have outline a number of motivating and detering determinants of food choice. Some of these commonly acknowledged factors include consumers attitudes, perceived health and nutritive benefits, taste preference, price, convenience as well as environmental and social factors [5, 17, 18]. The findings of this study indicate that convenience was
an important determinant found to influence consumers’ preference either one of the four widely consumed fish species. Convenience according to [5, 18, 19] means saving time,
physical or mental energy at any one or more points of meal acquisition, preparation, storage and disposal. Study respondents who considered themselves inexperienced fish users for instance tended towards Nile perch which is normally sold as fillets and is thus easy prepare and consume. On the other hand, Study respondents who preferred pre-cooked forms of Tilapia and Lungfish were looking for convenient time saving meal solutions. This goes to show that convenience is becoming more and more important as fish consumers are seeking to reduce time, energy and effort expended on acquisition, preparation and consumption of meals [4]. Hence adding convenience traits to all fish varieties
in the market could encourage uptake and increase fish consumption.
The price of different fish species and products was found to be both encouraging and deterring factor to fish consumption. Literature indicates that fish is generally perceived by consumers to be more expensive than meat [5]. Nonetheless,
study respondents who bought Silver sardine in agreement
with the findings of [11, 12, 20] reported this fish species to be a
cheap alternative to other fish varieties as well as meat and poultry. In contrast, Tilapia and Nile perch species were reported by fish customers to be very expensive. In fact the findings of this study consistent with [2, 21, 22] reveal that lower
income earners consumed significantly smaller quantities of these high priced fish species. This can be attributed to the low disposable income for consumers in this income bracket. Indeed using the 2005/2006 national poverty estimates for urban households –2,913 Kenya Shillings per person per month – [23], 27 percent of fish consumers in the 0-20,000
Kenya Shillings income group were found to fall below the poverty line with the rest being slightly above this threshold. This implies that consumers in the low income group are limited to purchasing affordable fish varieties like Silver sardine or consuming fish products in smaller quantities. Aquaculture development provides a great platform to increase fish production in Kenya this could create competitive prices for fish products and in turn make fish consumption more affordable for consumers in all income groups.
Safety concerns especially among inexperienced users served as another barrier to consumption of certain fish products in the market. Study respondents who considered themselves or members of their households to be inexperienced users, because of safety concerns tended to purchase Nile perch and Tilapia fillets. However, consistent with [24], these respondents
reported that fish fillets were only available in selected fish markets in Nakuru town. In addition, they stated that the price per kilogram of fish for fish fillets were considerably higher than the prices for unfilleted fish. This they said restricted them from consuming higher quantities of fish.
Still on the issue of experience, [5] reveal that lack of the
ability to evaluate fish quality is another constraint to fish consumption. Literature shows that many fish buyers do not have this ability associated with regular purchase and preparation of fish [4, 5]. The results of this study is quite
thus did not purchase fish as frequently as they would prefer. In light of consumers’ experience, or lack thereof, fish labeling should be considered for future fisheries development. Fish labeling could provide consumers with fundamental information about the fish, its species and place of origin, use by date and perhaps even simple fish recipes. Such measures could empower fish buyers and consequently increase fish consumption especially among inexperienced users.
5. Conclusion and recommendations
In conclusion, Tilapia was found to be the most preferred and the widely consumed fish species in Nakuru town. The other widely consumed fish species were Silver sardine, Nile perch and Lungfish following that order. The main determinants for purchasing and consuming either one of the four widely consumed fish species were price, availability, convenience, safety concerns and experience in selecting and preparing fish.
Future aquaculture development should consider diversifying fish varieties as well as increasing fish production. This will not only supplement the declining stocks of capture fisheries, but also create competitive prices for fish products which will consequently make fish consumption more affordable. In addition, introducing fish labeling as well as adding convenience traits like filleting to all fish varieties in the market will probably increase fish consumption. Fish filleting could also encourage consumption of fish species like Lungfish and Catfish that some consumers found to be visually unappealing.
6. Acknowledgement
The authors wish to acknowledge National Research Fund (Kenya) for funding this research. Special thanks to Egerton University Kenya for technical and logistical support.
7. References
1. Can MF, Günlü A, Can HY. Fish consumption preferences and factors influencing it. Food Science and Technology (Campinas). 2015; 35(2):339-346.
2. Verbeke W, Vackier I. Individual determinants of fish consumption: application of the theory of planned behaviour. Appetite. 2004; 44(1):67-82.
3. Pieniak Z, Verbeke W, Scholderer J. Health‐related beliefs and consumer knowledge as determinants of fish consumption. Journal of Human Nutrition and Dietetics. 2010; 23(5):480-488.
4. Birch D, Lawley M, Hamblin D. Drivers and barriers to seafood consumption in Australia. Journal of Consumer Marketing. 2012; 29(1):64-73.
5. Brunsø K, Verbeke W, Ottar OS, Fruensgaard JL. Motives, barriers and quality evaluation in fish consumption situations: Exploring and comparing heavy and light users in Spain and Belgium. British Food Journal. 2009; 111(7):699-716.
6. Kris-Etherton PM. Omega-3 fatty acids and cardiovascular disease new recommendations from the American Heart Association. Arteriosclerosis, thrombosis, and vascular biology. 2003, 151-152. 7. FAO. The State of the World Fisheries and Aquaculture.
FAO, Rome, 2016. 8. Fisheries Latest Data.
https://www.greenfacts.org/en/fisheries/l-2/06-fish-consumption.htm. 23 March 2017.
9. World Fish Center. Fish Supply and Food Security for Africa. WorldFish Center, Penang, 2009.
10. Fishery and Aquaculture Country Profiles. http://www.fao.org/fishery/facp/KEN/en. 20 March 2017. 11. Githukia CM, Obiero KO, Manyala JO, Ngugi CC, Quagrainie KK. Consumer Perceptions and Preferences of Wild and Farmed Nile Tilapia (Oreochromis niloticus L.) and African Catfish (Clarias gariepinus Burchell 1822) in Urban Centres in Kenya. International Journal of Advanced Research. 2014; 2(7):694-705.
12. Obiero KO, Opiyo MA, Munguti JM, Orina PS, Kyule D, Yongo E et al. Consumer preference and marketing of farmed Nile Tilapia (Oreochromis niloticus) and African Catfish (Clarias gariepinus) in Kenya: Case Study of Kirinyaga and Vihiga Counties. International Journal of Fisheries and Aquatic Studies. 2014; 1(5):67-76.
13. Daniel WW. BIOSTATISTICS: A foundation for analysis in the health science. 9, John Wiley & Sons, Inc, Hoboken NJ, 2009, 192-192.
14. Annual Fisheries Statistical Bulletin. Ministry of Livestock and Fisheries Development, Fish Statistics 2013, Kenya National Bureau of Statistics, 2013. 15. Facts on Kenyan fisheries.
http://www.kmfri.co.ke/index.php/about-kmfri/133-facts-on-kenyan-fisheries. 11 March, 2017.
16. Njiru M, Kazungu J, Ngugi CC, Gichuki J, Muhoozi L. An overview of the current status of Lake Victoria fishery: Opportunities, challenges and management strategies. Lakes & Reservoirs: Research & Management. 2008; 13(1):1-12.
17. Nørgaard MK, Brunsø K, Christensen PH, Mikkelsen MR. Children's influence on and participation in the family decision process during food buying. Young Consumers. 2007; 8(3):197-216.
18. Olsen SO, Scholderer J, Brunsø K, Verbeke, W. Exploring the relationship between convenience and fish consumption: A cross-cultural study. Appetite. 2007; 49(1):84-91.
19. Beck ME. Dinner preparation in the modern United States. British Food Journal. 2007; 109(7):531-547. 20. Oyoo-Okoth E, Admiraal W, Osano O, Ngure V, Kraak
HM, Omutange SE. Monitoring exposure to heavy metals among children in Lake Victoria, Kenya: Environmental and fish matrix. Ecotoxicology and Environmental Safety. 2010; 73(7):1797-1803.
21. Dalhatu M, Ala AL. Fish Preference among Residents of Sokoto Metropolis, Sokoto State, Nigeria. Pakistan Journal of Social Sciences. 2011; 8(3):132-134.
22. Mohan DM, Rab MA, Paraguas FJ, Piumsombun S, Bhatta R, Ferdous AM et al. Fish consumption and food security: a disaggregated analysis by types of fish and classes of consumers in selected Asian countries. Aquaculture Economics & Management. 2005; 9(1-2):89-111.
23. World Bank. Kenya Poverty and Inequality Assessment, Executive Summary and Synthesis Report. World bank, Washington DC, 2009.