Sleeping giants
of deforestation:
the companies, countries
and inancial institutions
with the power to save
forests
Citation:
Please cite this publication as:
Global Canopy Programme, 2016. Sleeping giants of deforestation: the companies, countries and inancial institutions with the power to save forests. The 2016 Forest 500 results and analysis. Global Canopy Programme: Oxford, UK.
Lead authors:
Christina MacFarquhar, Francesca Ward, Tom Bregman, Sarah Lake. Contributing authors and reviewers:
Helen Bellield, Xavier Andrillon. Annex
A list of Forest 500 powerbrokers and their 2016 scores is provided in an accompanying annex, available from http://forest500.org/reports
This publication was inancially supported by UK aid from the UK government; however the views expressed in this report do not necessarily relect the UK government’s oficial policies.
The Forest 500, an initiative of the Global Canopy Programme, is the world’s irst rainforest rating agency. It identiies and ranks the most inluential companies, inancial institutions, countries and subnational jurisdictions in the race towards a deforestation-free global economy.
Contact:
To contact the Forest 500 team, please write to [email protected].
The Global Canopy Programme is a tropical forest think tank working to demonstrate the scientiic, political and business case for safeguarding forests as natural capital that underpins water, food, energy, health and climate security for all. GCP’s pioneering initiatives include the Forest Footprint Disclosure Project (now CDP’s forests programme), the Natural Capital Declaration, the REDD Desk and the Little Book series. The Global Canopy Programme is a registered UK charity, number 1089110. www.globalcanopy.org
The contents of this report may be used by anyone providing acknowledgement is given to the Global Canopy Programme. No representation or warranty (express or implied) is given by the Global Canopy Programme or any of its contributors as to the accuracy or completeness of the information and opinions contained in this report. The Global Canopy Programme sits under The Global Canopy Foundation, a United Kingdom charitable company limited by guarantee, charity number 1089110. © 2016 Global Canopy Programme. All rights reserved.
About the
Forest 500:
Funding
About the
Global
Canopy
Bold commitments to decouple commodity production from tropical deforestation are on the rise. These have included major collective commitments since 2010 by the Consumer Goods Forum on behalf of its more than 400 members, and by 40 countries and 57 companies and inancial institutions in their New York Declaration on Forests. Equally important are the steps being taken by numerous actors to map out their own individual paths towards removing deforestation risk from their jurisdictions, supply chains and inancial portfolios.
The third annual Forest 500 report asks the fundamental question: to what degree are the most inluential actors in the global palm oil, soya, cattle product and timber product supply chains committing to address deforestation? Through a systematic analysis of the 250 companies, 150 inancial institutions and 50 national and subnational jurisdictions selected for inclusion in the Forest 5001, this report reveals not only whether these powerbrokers have established policies to address deforestation, but also whether their policies are robust enough to produce meaningful change on the ground. It inds that:
Despite signs of improvement among leading companies, the rate of progress by most companies is inadequate to meet 2020 targets to address deforestation.
• Entire sectors lack action: The cattle industry continues to be the largest commodity driver of deforestation2 yet only 26% of companies operating in the cattle product supply chain have any policy to address environmental impacts, with even fewer (16%) including adequate commitments speciically on deforestation.
• The leaders continue to lead, and the laggards to lag: While a handful of companies have published new policies or improved existing ones, the majority of companies in the Forest 500 have weak policies or no policies at all.
• The rate at which new company policies are emerging is too low to meet 2020 targets, with an increase of only 5% in the last three years in the number of companies with policies for all commodities to which they are exposed. Many of these policies also lack robustness, omitting key environmental and social factors, processes for publicly reporting progress, or parts of the companies’ supply chains.
Executive Summary
1 The Forest 500 actors include 450 companies, inancial institutions, countries and subnational jurisdictions, plus 50 additional powerbrokers, such as industry
groups and civil society organisations, that are considered important for inluencing commodity production and tropical forest conservation. These 50 powerbrokers are not assessed. See Annex 1 (http://forest500.org/reports) for a list of powerbrokers.
2 See Henders, S. et al., 2015. ‘Trading forests: land-use change and carbon emissions embodied in production and exports of forest-risk commodities.’ Environmental
Demand for unsustainably produced commodities remains uncurbed by major importing countries, while producer countries are increasingly committing to address deforestation within their borders.
• Four countries that produce forest risk commodities have now established new national commitments on avoiding deforestation in priority forest types (including natural, intact or high conservation value forests) with two of these established in the last year. These countries are Colombia, the Democratic Republic of Congo, Ivory Coast and Liberia.
• However, major importing countries such as China and India have yet to address their role in the demand for commodities driving deforestation. While the EU and US have policies such as FLEGT and the Lacey Act to cover illegal timber sales, these importing jurisdictions also lack policies that address the full range of forest risk commodities.
Strong policies from a small number of leading inancial institutions are yet to be matched by their peers and client/investee companies.
• Only four investors and lenders (3%) in the Forest 500 have policies committing to remove deforestation arising from their inancing of companies in all four supply chains. A larger number (nearly a quarter) have policies that apply to one or more speciic supply chains.
• Among those inancial institutions with forest policies, many continue to inance clients and investees without such policies, indicating a lack of policy implementation. The 2016 assessment inds that 75% of lenders with forest policies have made loans - totalling over US $64 billion - to companies that have not published their own policies.
If 2020 goals for addressing commodity-driven deforestation are to be met, company, government, and inancial sector action requires great improvement in the following ways:
• Company policies need to address the largest drivers of deforestation such as cattle products and soya, and not just the commodities receiving the most public attention - timber products and palm oil.
• Companies need to close current policy loopholes by expanding policies to address all forest risk commodities in their supply chains, and to do so in all geographies from which these commodities are sourced, not just those under the most scrutiny.
• To address the impacts of growing demand, and to increase market signals for sustainable commodities, major importing countries can establish policies committing to sustainable sourcing.
Three years remain until 2020, by which time many government and
corporate commitments – such as those of the Consumer Goods Forum3 and
the New York Declaration on Forests4 - are set to achieve major milestones in
removing deforestation from global commodity supply chains.
Transparency on the intentions, methods and progress of public and private sector actors in working towards these goals will be critical to their accomplishment. For none could this be more important than for the powerbrokers of the Forest 500. These are the jurisdictions, companies, inancial institutions and other organisations5 with the greatest potential to
halt tropical deforestation associated with the production of the four major forest risk commodities: palm oil, soya, timber products (including pulp and paper)6, and cattle products (including beef and leather).
These actors have been systematically selected and assessed annually7 since
2014 by the Forest 500 rating agency, an initiative of the Global Canopy Programme, based on a detailed methodology published online at www.forest500.org.
The following report presents an analysis of the successes and failures of these actors to devise and publish8 policies to address deforestation linked
to their supply chains, portfolios, and landscapes. The report goes beyond asking what policies exist to investigate whether the scale and rate of progress is adequate to address the environmental and social challenges posed by commodity-driven deforestation.
The full list of powerbrokers and their 2016 scores can be accessed in the annex to this report, at http://forest500.org/reports.
Introduction
In the Forest 500 assessment, a distinction is made between two types of company policies: forest policies and sustainability policies. Forest policies include measures to avoid procuring commodities from priority forest types including primary, intact, natural and/or high conservation value (HCV) tropical forests, or commit to cover production
or procurement using a credible certiication
scheme. This type of policy is given preference in
the assessment as it is considered more relevant to addressing deforestation. Sustainability policies, in contrast, include more vague commitments to sustainability, sometimes referring to forests
speciically, but not excluding exploitation of
priority forest types or committing to the use of
credible certiication schemes. Companies with forest
policies are automatically awarded points for having sustainability policies.
3 In November 2010, the Board of the Consumer Goods Forum pledged to “mobilise resources within our respective businesses to help achieve zero net
deforestation by 2020.” See www.theconsumergoodsforum.com/sustainability-strategic-focus/sustainability-resolutions/deforestation-resolution.
4 The New York Declaration on Forests (NYDF) is a voluntary international declaration aiming to halt global deforestation. It was launched at the United Nations
Climate Summit in September 2014 and is endorsed by 190 governments, companies, inancial institutions, groups representing indigenous communities, and non-governmental organisations. See www.undp.org/content/dam/undp/library/Environment%20and%20Energy/Forests/New%20York%20Declaration%20on%20 Forests_DAA.pdf.
5 See footnote 1.
6 In this report ‘timber products’ includes timber and its products (such as building materials) as well as wood-based pulp and paper. However, pulp and paper are
treated separately from timber in company assessments due to differences in how they are processed and traded.
7 Assessment has taken place annually, and selection biennially, although some selection changes have been made annually due to mergers and acquisitions. 8 The Forest 500 assessment focuses on policies and information available publicly on the websites of the powerbrokers. See www.forest500.org for the
methodology.
Companies are exposed to tropical deforestation risk in their supply chains either directly by producing commodities in tropical forest areas, or by procuring commodities from deforested land. The impacts of this risk for the companies could include inancial losses through stranded assets or loss of market access as stricter environmental requirements are implemented, or damaged brand reputation if their activities are associated with
deforestation or the violation of local peoples’ rights.
While many are quick to celebrate the momentum of private sector action to address deforestation through such victories as Brazil’s Soy Moratorium9
or the New York Declaration on Forests, Forest 500 analysis reveals a lack of commitment, especially in the cattle product supply chain, among the companies with the most inluence over forests. Out of all 250 companies assessed, only 11 companies have gross zero deforestation policies that cover all forest risk commodities in their supply chains. Even among these 11 companies, only ive of them explain how they aim to protect priority forest types (see Box 1) or indicate that the policy applies to all of their operations and suppliers globally. The majority of companies (57%) have weak,
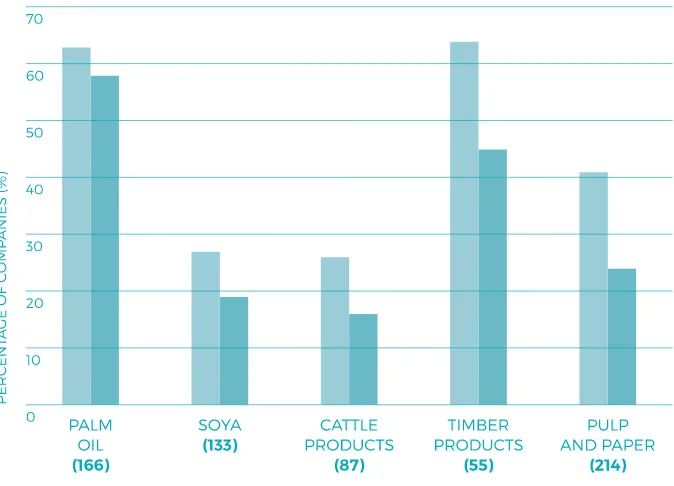
incomplete policies, or no policy at all despite their key role in forest risk commodity supply chains. Among the different commodity supply chains, there is great variation: over 60% of companies assessed for palm oil or for timber have sustainability policies for these commodities and over 40% have forest policies, while the pulp and paper, soya, and cattle supply chains are less well covered by either type of policy (see Figure 1).
The cattle product supply chain stands out as having a particularly large absence of company policies. Despite its role as the largest driver of tropical deforestation10, only 26% of companies in this supply chain have
a sustainability policy, and only 16% a forest policy. Soya is slightly better covered, with 27% having sustainability policy and 19% a forest policy,
The leaders
The Forest 500 powerbrokers include 250 companies
identiied as having the greatest inluence within
global palm oil, soya, timber product and cattle product supply chains. Companies are selected based on the scale of their commodity production, the volume of commodities they process or trade, and their market share within global manufacturing and
retail sectors. The companies are assessed for one or more commodities and are awarded 0 to 5 points based on the robustness and scope of their forest and related human rights policies, as well as progress reporting.
See the full methodology at www.Forest500.org
9 Brazil’s Soy Moratorium is a voluntary agreement among companies not to source soya from recently deforested areas in the Amazon. See http://www.abiove.org.
br/site/index.php?page=soy-moratorium&area=MTEtMy0x.
10 See footnote 2.
and the rate of growth for soya-related policies is greater than for other commodities, with an 8% growth in the number of forest policies for soya over the last three years (see Figure 2).
Beyond the rate of growth in soya policies, 11% of companies improved their Forest 500 score this year due to having a new policy or improving an existing one. Among these are three new companies – Colgate-Palmolive, Marks & Spencer, and Orkla Group – that now join the ranks of those scoring the maximum 5 out of 5 points available, due to policy improvements in the last year. However the total number of companies with maximum points remains only a fraction of all the companies, at only 5% overall.
Despite these positive developments, it is clear that the rate at which companies are devising and publishing deforestation policies is too slow. From 2014 to the present, the number of companies committing to address deforestation in all relevant supply chains only increased by 5%11. At this rate,
the majority of companies will still not have policies covering all relevant
Figure 2.
Change over three years (2014-2016) in percentage of companies assessed for each commodity that have published a forest policy for that commodity. Total number of companies assessed for each commodity appears in parentheses.
Note: many companies are assessed for more than one commodity.
Figure 1.
Percentage of companies with sustainability policies compared to percentage with forest policies. Total number of companies assessed for each commodity appears in parentheses.
Note: many companies are assessed for more than one commodity.
11 The increase is 4% for (weaker) sustainability policies and 5% for (stronger) forest policies. This analysis covers palm oil, soya, cattle products, and timber products
commodities by 2020, let alone be implementing them. This is a major concern given that the Forest 500 companies have been identiied as the most important in the world for addressing tropical deforestation.
Beyond substantial gaps in addressing entire commodity sectors, the Forest 500 assessment also reveals that many company forest policies do not cover all key geographies from which companies may be procuring forest risk commodities. Closer examination of the content of these policies, where they exist, inds that they are often limited to materials originating from a particular area, while ignoring other supplying regions, or are applicable only to a portion of a company’s suppliers or subsidiaries.
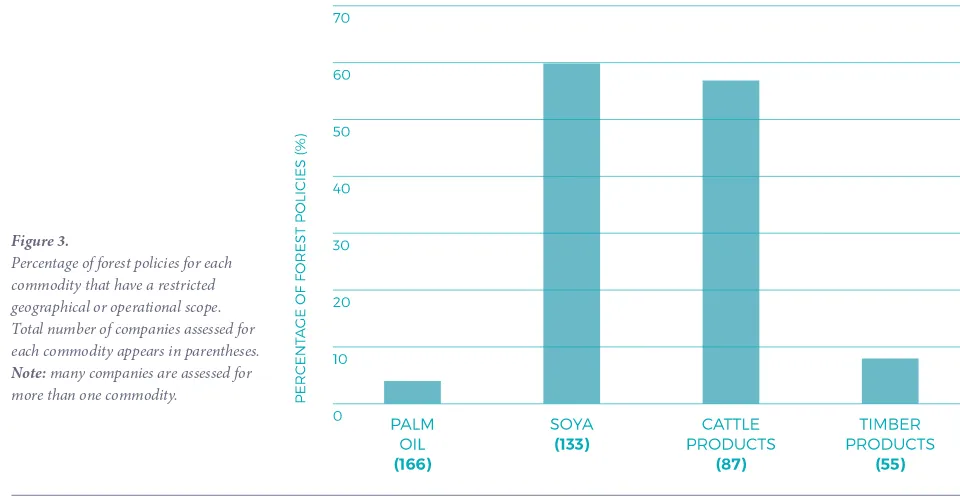
Limitations in geographical scope are especially true for cattle and soya policies. For example, 60% of company policies on soya are restricted in their scope of application (see Figure 3). The majority of these restricted soya policies focus on Brazil’s Soy Moratorium, a voluntary agreement among companies not to source soya from recently deforested areas in the Amazon, while neglecting to address impacts in other soya producing regions. While support for the Moratorium is important, this tendency is problematic due to the fact that the vast majority of soya12 is sourced from
areas outside the Amazon such as the biodiverse Cerrado biome. Indeed, the Cerrado continues to lose a sizeable amount of native vegetation due to soya expansion13. This limited focus on the Soy Moratorium was also identiied in
previous years’ assessments and still remains to be addressed.
The majority of the companies with policies restricted to the Soy Moratorium are commodity processors and traders. Despite operating across multiple regions and jurisdictions, their policies are limited in geographical scope, in comparison to manufacturers and retailers, largely located in Europe and North America, whose soya policies apply more globally. This disconnect between policies at different parts of the supply chain highlights the need for downstream companies to engage with their suppliers to ensure that their more extensive policies are respected.
Figure 3.
Percentage of forest policies for each commodity that have a restricted geographical or operational scope. Total number of companies assessed for each commodity appears in parentheses.
Note: many companies are assessed for more than one commodity.
12 See TRASE, 2016 at www.trase.earth.
Commodity production and procurement are driving rapid deforestation throughout the tropics, whose forests are well-known and valued for their biodiversity, carbon storage and water cycling, and their importance for the livelihoods of millions of people14. While many of these countries are seeing
economic beneits to expanding agricultural production into forested areas, many are also realising and acknowledging the hazards of doing so.
Countries in which commodity-driven deforestation is occurring have increasingly committed to mitigate these impacts. The 2016 assessment found that the majority of commodity-producing countries (18 out of 25) and subnational jurisdictions (7 out of 10) selected in the Forest 500 have policies to tackle forest loss - for example, to reduce the rate of deforestation, expand the area of forest under protection, or prevent deforestation in a particular biome. In addition, four countries – Colombia, the DRC, Ivory Coast and Liberia - have so far made overarching commitments that aim to end all agriculture-driven loss of priority forest types15. Encouragingly, all
25 forest jurisdictions were found to relect the importance of forests for environmental sustainability within their national development priorities.
However, the efforts of producer countries need to be supported by strong consumption policies among the actors at the opposite end of the supply chain: the importing countries. The Forest 500 actors include ifteen countries in the Asia-Paciic region, Europe and North America that are the greatest importers of palm oil, soya, cattle products and timber products directly from the 25 forest countries. Collectively, these 15 importing jurisdictions account for 75% of all globally reported imports
Importers
The Forest 500 powerbrokers include 25 priority countries in the tropics selected based on their relatively high forest cover, deforestation rates, and risk of deforestation driven by the production of the four commodities. Collectively, these countries account for 85% of the world’s remaining tropical and subtropical forests, and 86% of forest loss in these regions since 2010*. Ten subnational jurisdictions from within these countries are also
selected due to their own high forest cover and rates of loss. Also included are the 15 jurisdictions that are the greatest importers (by value) of the four commodities associated with deforestation in the 25 producer countries.
14 See Rautner, M. et al., 2013. The Little Book of Big Deforestation Drivers, Global Canopy Programme: Oxford. Available from: http://globalcanopy.org/sites/default/
iles/documents/resources/LittleBookofBigDeforestationDrivers_EN_0.pdf
15 See Box 1 for deinition of priority forest types.
Country selection and assessment
of these commodities from the 25 producer countries.16 With this volume
of consumption comes great potential to help stimulate a market shift towards sustainable commodities. Indeed the majority (80%) of these importing countries are supporting the shift to sustainable agriculture through inancial contributions to bi- and multi-lateral initiatives. Yet they lag in complementing this action with strong policies to address their own demand and promote deforestation-free domestic consumption.
Currently, ambitions by importing countries to address deforestation risk in the products they import are generally limited to government purchases. The majority - 8 of 15 - of importing countries assessed have a policy promoting sustainability criteria for government purchases of a subset of products produced from forest risk commodities – such as wooden furniture or paper. The Forest 500 assessment inds nearly no ambition among importing countries to address either deforestation associated with government purchases across all supply chains, or the broader imports coming into that country for general consumption. Only two countries formally support initiatives for sustainable imports of goods for general consumption, not just government use: Germany and the Netherlands, both of which support industry-led initiatives promoting sustainable palm oil. In December 2015, these two countries, along with three other EU member states, reinforced their efforts by signing the 2015 ‘Amsterdam Declaration in Support of a Fully Sustainable Palm Oil Supply Chain by 2020’17.
Emerging economies such as China and India, and the companies headquartered and operating within them, also play critical roles as major importers. However, besides the lack of sustainable national import and consumption policies, forest policies (and weaker sustainability policies) among companies also remain sparse. China is the largest global importer of soya from key producer countries Argentina, Bolivia, Brazil, and Paraguay18,
accounting for 40% of exports from these countries19. A total of 15 Forest
500 companies assessed for soya are headquartered20 in China, and only
one of these has a policy for soya: COFCO, a major trader and processor. But even COFCO has a policy of limited scope that applies to only part of the company’s supply chain.
Engagement by investors and lenders to Forest 500 companies could help stimulate progress in company policy-making especially in these important emerging markets. COFCO, for example, receives investment and lending from 30 Forest 500 inancial institutions headquartered in 11 different countries across the Asia-Paciic region, as well as Europe and North America, where environmental issues generally receive greater attention.
16 Calculated using data on value of imports of forest risk commodities, 2012-2014, from UN Comtrade. Data downloaded in November 2016.
17 The Amsterdam Declaration can be accessed at: www.euandgvc.nl/binaries/euandgvc/documents/publications/2015/december/7/declarations-palm-oil/
declaration-palm-oil-amsterdam.pdf
18 These are the four priority soya-producing countries included in the Forest 500 in 2016.
Financial institutions can contribute to tropical deforestation when they provide debt, equity and other forms of capital to companies in forest risk commodity supply chains. This can also expose them to risk, because such companies could be impacted by deforestation and related human rights issues associated with their activities. For example, company proits could diminish if they lose access to more sustainable markets and suffer from stranded assets, or their brand reputation may be impacted if their activities are associated with deforestation or the violation of local peoples’ rights. By establishing robust policies and engaging with companies to address risk, investors and lenders could beneit directly while also helping incentivise a market-wide shift towards more sustainable supply chains.
In response to this risk, 3% of inancial institutions assessed have committed to remove deforestation associated with all four commodities from their portfolios, while a quarter (36) have a policy for at least one commodity. Notably, far fewer inancial institutions have commodity-speciic policies in place for companies involved in the cattle product and soya supply chains than for those operating in palm oil and timber products (see Figure 4).
The content of these policies is also lacking in robustness. Fewer than 18% of them commit to the protection of priority forest types21 and the majority
of these (59%) only encourage, rather than require, clients and investees to protect these forest types as a prerequisite for receiving lending and investment. These inancial institution policies are also commonly limited in scope, such as by only being applicable when the loan exceeds a certain value threshold. Only a quarter of the 36 inancial institutions with commodity-speciic policies explicitly state that the policies apply across their entire inancing portfolios.
In addition, many inancial institutions with policies are inancing companies without similar policies. This can be illustrated by looking at loans to the
A trickle of
Among the powerbrokers of the Forest 500 are
150 inancial institutions selected due to their inancial relationships with Forest 500 companies,
in which they collectively hold over US $2.8 trillion in shareholdings, bondholdings, and lendings and
underwritings. The cohort of selected inancial institutions in 2016 difers from previous years due
to the new consideration of more types of direct
inancing. As a result, 54 inancial institutions have
been newly selected and assessed in 2016.
21 See Box 1 for deinition of priority forest types.
36 Forest 500 companies operating as producers, processors, or traders22
of forest risk commodities. In 2016, 29 Forest 500 inancial institutions with commodity-speciic policies were found to be lending to these companies, with their loans totalling more than US $64 billion. However, the majority (75%) of lenders are engaged in at least one loan deal where the client does not have an aligned policy.
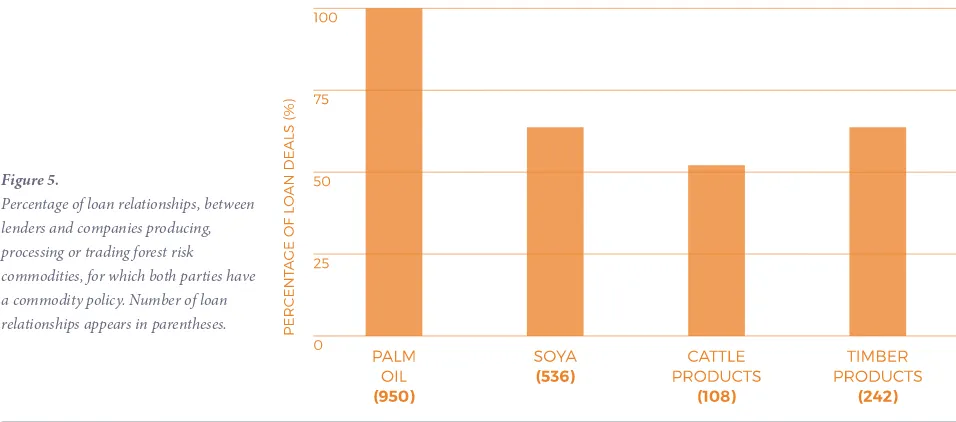
This incongruence is especially clear for the cattle product supply chain (see Figure 5). Of the 108 loan relationships between inancial institutions with cattle-speciic policies and companies assessed for cattle products, in less than 40% of cases the client also has a policy for cattle products. In contrast, of 950 loan relationships between inancial institutions and companies assessed for palm oil, only one loan relationship exists where a inancial institution has a palm oil policy but the palm oil producing and processing company that it lends to does not.
This is somewhat surprising given that 93% of lenders with commodity-speciic policies detail the process by which they will monitor company compliance23. If inancial institutions effectively implement their monitoring
processes and engage with companies without aligned policies they could not only mitigate the risks in their portfolios, but also act as a signiicant lever of change.
Figure 4.
Percentage of inancial institutions with a commodity-speciic lending or investment policy, by commodity.
Figure 5.
Percentage of loan relationships, between lenders and companies producing, processing or trading forest risk commodities, for which both parties have a commodity policy. Number of loan relationships appears in parentheses.
22 The ive supply chain stages considered in the Forest 500 are: production, processing, trading, manufacturing and retailing.
23 Multiple factors could inluence the level of coherence between inancial institution policies and those of companies, including the scope of the inancial
Despite signs of improvement, the rate of progress among countries, companies and the inancial sector is inadequate to meet deforestation targets for 2020 and beyond. Entire supply chains lack robust deforestation policies, as seen in the cattle product supply chain, where fewer than 30% of Forest 500 companies have published a sustainability policy, let alone one strong and speciic enough to tackle deforestation risk. Most inancial institutions lack cattle-speciic policies, and even when they have them, their clients do not have aligned policies. And all of this while the cattle product supply chain continues to be the largest driver of tropical deforestation.
While a handful of companies have published new policies or improved existing ones, the majority of companies (57%) in the Forest 500 have weak policies or no policies at all. Weak policies omit key elements for success, such as important environmental and social factors (including protection of priority forest types), meaningful reporting of progress, or parts of the company’s supply chain.
Meanwhile, growing commitment among producer countries can be seen from the fact that four countries exporting forest risk commodities have established overarching commitments to end all agriculture-driven loss of one or more priority forest types, including two made in the last year. While importing countries support efforts to address deforestation through bi-lateral and multi-lateral funding, they have yet to establish strong demand-side policies to address consumption across the commodities driving deforestation. Only two Forest 500 importing countries were found to formally support national-level initiatives that address consumer demand for, and use of, sustainable commodities. Market signals from these importing countries continue to spur demand for unsustainable goods, while simultaneously inancial institutions in the Forest 500 with policies continue to make over US $60 billion in loans to producers, processors and traders , the majority of which do not have policies to remove deforestation from their supply chains.
Recommended actions:
• Company policies need to address the largest drivers of deforestation such as cattle products and soya, and not just the commodities receiving the most public attention - timber products and palm oil.
• Companies need to close current loopholes by expanding their policies to address all forest risk commodities in their supply chains, and to do so in all geographies from which these commodities are sourced, not just those under the most scrutiny.
• Demand for forest risk commodities must be addressed together with production. To address the impacts of growing demand, and increase market signals for sustainable products, major importing countries can establish commitments to sustainable sourcing.