Company Registration Number: 199901152M
To: Shareholders
The DBS Group Holdings Ltd (“DBSH” or “the Company”) Board of Directors report audited financial results for the year ended December 31, 2004.
The Directors have recommended a gross final dividend of 12 cents for each DBSH non-voting convertible preference share (“CPS”) and each DBSH non-voting redeemable CPS, and 22 cents for each DBSH ordinary share. All final dividends will be paid less 20% Singapore income tax. Details of the proposed dividends in respect of the financial year ended December 31 are as follows:
In $ millions 2004 2003
DBSH Non-voting CPS
Interim dividend* of 18 cents less 20% tax (2003: 14 cents less 22% tax) (a) 2 Final dividend of 12 cents less 20% tax (2003: 16 cents less 20% tax) (a) 3
(a) 5
DBSH Non-voting redeemable CPS
Interim dividend* of 18 cents less 20% tax (2003: 14 cents less 22% tax) 9 7 Final dividend of 12 cents less 20% tax (2003: 16 cents less 20% tax) 6 8
15 15
DBSH Ordinary share
Interim dividend* of 18 cents less 20% tax (2003: 14 cents less 22% tax) 215 161 Final dividend of 22 cents less 20% tax (2003: 16 cents less 20% tax) 263 188
478 349
* Interim dividends were paid to entitled shareholders on August 27, 2004. (a) Amounts under $500,000
The proposed final dividends will be payable on May 20, 2005, subject to shareholders’ approval at the Annual General Meeting to be held on April 29, 2005. Notice is hereby given that the Share Transfer Books and Register of Members of the Company for ordinary shares will be closed from May 10, 2005 to May 11, 2005, both dates inclusive. Duly completed transfers received by the Company's Registrar, Barbinder & Co Pte Ltd of 8 Cross Street #11-00 PWC Building, Singapore 048424 up to 5.00 p.m. on May 9, 2005 will be registered to determine shareholders' entitlement to the proposed final dividends. In respect of ordinary shares in the securities accounts with The Central Depository (Pte) Limited (“CDP”), the final dividends will be paid by DBSH to CDP, which will in turn distribute the dividend entitlements to shareholders.
By order of the Board
Heng Lee Cheng (Ms) Group Secretary
Audited Financial Results
for Year 2004
Contents
Page
Financial Highlights 2
Financial Review 3
Net Interest Income and Net Interest Margin 5
Non-Interest Income 6
Operating Expenses 7
Provision Charge 7
Balance Sheet 8
Asset Quality 8
Customer Loans 10
Deposits 11
Capital Adequacy Ratio 12
Unrealised Valuation Surpluses 12
Geographical Segment Analysis 13
Business Segment Analysis 14
Comparatives 15
Appendix I: Audited Consolidated Profit and Loss Account Appendix II: Audited Consolidated Balance Sheet
Appendix III: Audited Balance Sheet of DBS Group Holdings Ltd
Appendix IV: Audited Consolidated and Unconsolidated Statements of Changes in Shareholders’ Equity Appendix V: Audited Consolidated Cash Flow Statement
Appendix VI: Selected Notes to the Accounts 1. Issuance of Ordinary Shares
2. Loan and Investment Exposures to Malaysia, Indonesia, Thailand, Korea, The Philippines (Regional Countries), Hong Kong and China
3. Non-Performing Loans and Provisions 4. Financial Derivatives
Financial Highlights
DBS Group Holdings Ltd (“DBSH”) prepares its consolidated DBSH Group (“Group”) financial statements in accordance with Singapore Financial Reporting Standards (“FRS”).
In $ millions
4th Qtr 2004
4th Qtr 2003
+/(-) %
3rd Qtr 2004
Year 2004
Year 2003
+/(-) % For the period
Operating income 1,022 1,053 (3) 1,087 4,928 4,198 17
Operating profit before goodwill amortisation
and provisions 492 571 (14) 596 2,922 2,357 24
Net profit before taxation 428 397 8 491 2,512 1,437 75
Net profit attributable to members 321 292 10 362 2,018 1,025 97
Net profit attributable to members (excluding
goodwill amortisation) 431 402 7 472 2,458 1,455 69
At period-end
Shareholders' funds 16,502 14,896 11 16,200 16,502 14,896 11
Interest bearing assets 148,113 133,451 11 140,025 148,113 133,451 11
Customer loans 1/ 69,664 64,335 8 67,221 69,664 64,335 8
Customer deposits 113,206 108,041 5 107,008 113,206 108,041 5
Total assets 175,553 159,595 10 166,087 175,553 159,595 10
Per share (in $)
Basic earnings excluding goodwill
amortisation 2/ 1.14 1.08 6 1.26 1.64 0.98 67
Basic earnings 2/ 0.85 0.78 9 0.96 1.34 0.68 97
Diluted earnings 2/ 0.82 0.75 9 0.93 1.30 0.66 97
Net asset value at period-end
(i) based on existing ordinary share capital 10.76 9.75 10 10.56 10.76 9.75 10 (ii) assuming non-voting convertible
preference shares (“CPS”) and non-voting redeemable CPS are converted to
ordinary shares 10.58 9.58 10 10.39 10.58 9.58 10
Performance ratios (%)
4th Qtr 2004
4th Qtr 2003
3rd Qtr 2004
Year 2004
Year 2003 On a GAAP basis
Return on assets 2/ 0.75 0.73 0.86 1.20 0.66
Return on equity 2/ 7.86 7.93 8.99 12.85 7.04
Excluding goodwill amortisation
Return on assets 2/ 1.01 1.01 1.12 1.47 0.94
Return on equity 2/ 10.54 10.91 11.72 15.66 9.99
Efficiency and revenue mix ratios Cost-to-income ratio (excluding goodwill
amortisation) 51.9 45.8 45.2 40.7 43.9
As a percentage of total operating income:
- net interest income 62.2 59.6 59.3 52.1 56.6
- non-interest income 37.8 40.4 40.7 47.9 43.4
Capital adequacy ratios (at period-end) 3/
- Tier 1 capital 11.3 10.5 11.8 11.3 10.5
- Total capital 15.8 15.1 15.4 15.8 15.1
Notes:
1/ After deducting cumulative provisions.
2/ Earnings per share, return on assets and return on equity for the quarters were computed on an annualised basis.
Financial Review
DBSH Group’s net profit attributable to members (“NPAM”) was $321 million for fourth quarter 2004, up 10% over fourth quarter 2003. Year-on-year, NPAM almost doubled to $2.018 billion. Excluding the one-time gains of $187 million from sale of the Group’s 10% stake in Wing Lung Bank and $310 million gain from sale of the Group’s 59% stake in DBS Thai Danu Bank Public Company Limited (“DTDB”) in year 2004, NPAM would show a 48% increase over the previous year to $1.521 billion. Lower provision charge and higher net interest income contributed to the better bottom-line profit.
• Operating income of $1.022 billion was 3% lower than fourth quarter 2003 mainly due to a 9% decline in non-interest income from lower treasury gains. For the full year, operating income (excluding one-time gains) rose 6%, largely due to higher net interest income from growth in customer loans and debt securities.
• Operating expenses rose 10% over fourth quarter 2003 to $530 million in fourth quarter 2004 mainly due to higher staff costs and advertising and promotion expenses. Year-on-year, operating expenses increased 9% to $2.006 billion.
• Cost-to-income ratio (excluding goodwill amortisation) was 51.9% for fourth quarter 2004 and 45.8% for fourth quarter 2003. Excluding one-time gains, cost-to-income ratio would have been 45.3% for year 2004 as compared to 43.9% for year 2003.
• Provision write-back of $31 million was recorded in fourth quarter 2004 as compared to a $82 million charge in the same quarter last year. The reduced provisions were due to: (a) a lower specific provision charge for loans arising from loan recoveries, improving asset quality and higher collateral valuations; (b) write-backs in provisions made previously for marketable securities as market prices improved; (c) adoption of a transitional general provisioning framework ahead of Basle II and in line with revised MAS provisioning guidelines (MAS Notice 612). Provision charge for the full year was $47 million as compared to $541 million a year ago.
Profit and Loss Account 1/
In $ millions
4th Qtr 2004
4th Qtr 2003
+/(-) %
3rd Qtr 2004
Year 2004
Year 2003
+/(-) %
Net interest income 636 628 1 645 2,566 2,375 8
Non-interest income 386 425 (9) 442 2,362 1,823 30
Operating income 1,022 1,053 (3) 1,087 4,928 4,198 17
Operating expenses (530) (482) 10 (491) (2,006) (1,841) 9
Operating profit before goodwill
amortisation and provisions 492 571 (14) 596 2,922 2,357 24
Goodwill amortisation (110) (110) - (110) (440) (430) 2
Operating profit before provisions 382 461 (17) 486 2,482 1,927 29
Provisions 31 (82) NM (17) (47) (541) (91)
Operating profit 413 379 9 469 2,435 1,386 76
Share of profits less losses of associated
and joint venture companies 15 18 (17) 22 77 51 51
Net profit before taxation 428 397 8 491 2,512 1,437 75
Taxation (94) (85) 11 (116) (442) (349) 27
Minority interests (13) (20) (35) (13) (52) (63) (17)
Net profit attributable to members 321 292 10 362 2,018 1,025 97
NPAM excluding goodwill amortisation 431 402 7 472 2,458 1,455 69
NM: Not meaningful Note:
1/ Excluding one-timegains of $497 million, the following profit and loss items would have been:
In $ millions
Year 2004
Year 2003
DBS Bank (Hong Kong) Limited
For fourth quarter 2004, net profit after taxation for DBS Bank (Hong Kong) Limited declined 10% from fourth quarter 2003 to $126 million. The decline was mainly due to lower operating income, higher operating expenses, partly offset by lower provision charge. Compared with 2003, net profit after taxation for the year 2004 increased 27% due to higher operating income and lower provisions. In the fourth quarter 2004, DBS Bank (Hong Kong) Limited divested part of its stake in Banco de Oro Universal Bank, a bank in the Philippines, recording a $12 million gain1/. The remaining stake was subsequently disposed in first quarter 2005.
• Net interest income was down 4% from fourth quarter 2003 mainly due to the narrower spread between the Prime rate and HIBOR2/, partly offset by a 12% rise in customer loans. Compared to third quarter 2004, net interest income decreased 2% due to continued competitive price pressures, negating a 3% increase in customer loans. Compared to 2003, net interest income for the year increased 5%, mainly due to the widening spread between the Prime rate and HIBOR and growth in customer loans, partly offset by price pressures.
• Non-interest income declined 10% from fourth quarter 2003 mainly due to lower income from sales of treasury investment products. Non-interest income for the year 2004 improved 3%, mainly due to increase in fee and commission income offset by lower income from sales of treasury investment products.
• Operating expenses were 10% higher compared to fourth quarter 2003 and 6% higher than third quarter 2004 due to ongoing investments in people and systems to capture business opportunities. Year-on-year, operating expenses were 8% higher.
• Provision charge decreased 24% compared to fourth quarter 2003. For the full year, provision charge was 47% lower than the year 2003, reflecting the stronger economic environment and property market.
Profit and Loss Account (Based on Hong Kong Generally Accepted Accounting Principles)3/
In $ millions
4th Qtr 2004
4th Qtr 2003
+/(-) %
3rd Qtr 2004
Year 2004
Year 2003
+/(-) %
Net interest income 194 203 (4) 197 804 767 5
Non-interest income 91 101 (10) 92 380 368 3
Operating income 285 304 (6) 289 1,184 1,135 4
Operating expenses (133) (121) 10 (126) (498) (463) 8
Operating profit before provisions 152 183 (17) 163 686 672 2
Provisions (19) (25) (24) (20) (91) (172) (47)
Operating profit 133 158 (16) 143 595 500 19
Net profit before taxation 147 161 (9) 147 620 501 24
Net profit after taxation 126 140 (10) 127 534 422 27
Notes:
1/ Net gain on disposal of non-trading securities are reported after Operating profit under Hong Kong Generally Accepted Accounting Principles.
2/ HIBOR: Hong Kong Interbank Offer Rate
Net Interest Income and Net Interest Margin
Exhibit 1
Group Net Interest Income and Net Interest Margin
634 651 645 636 2,566
2,039 2,257 2,645
2,375
628
1.871.991.78 1.79 1.81 1.79 1.79 1.83 1.75 2.02 0 500 1,000 1,500 2,000 2,500 3,000
2000 2001 2002 2003 2004 4Q03 1Q04 2Q04 3Q04 4Q04
$ m 0 1 2 3 (% )
Net Interest Income Net Interest Margin (%)
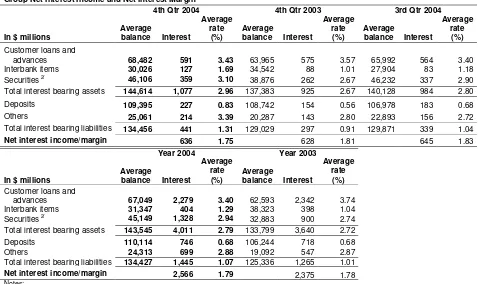
Net interest income grew 1% over fourth quarter 2003 but declined 1% from third quarter 2004 to $636 million in fourth quarter 2004.
• Excluding DTDB’s net interest income from fourth quarter 2003, net interest income increased 6% in fourth quarter 2004. This was largely due to growth in interest bearing assets especially in customer loans which grew 13% year-on-year (excluding DTDB), partially offset by lower net interest margin. • Net interest margin for fourth quarter 2004 was 1.75%, lower than 1.81% in fourth quarter 2003 and
[image:8.595.51.297.115.238.2] [image:8.595.50.528.429.713.2]1.83% in third quarter 2004. The decrease was mainly due to the costs of a growing deposit base in Singapore and higher borrowing costs in general in Hong Kong. In addition, short-term interbank-pegged deposit rates rose faster than loan yields. Additional funding costs were also contributed by higher carrying costs for subordinated debts, including a US$750 million issue that closed during the quarter.
Table 1
Group Net Interest Income and Net Interest Margin 1/
4th Qtr 2004 4th Qtr 2003 3rd Qtr 2004
In $ millions
Average balance Interest Average rate (%) Average balance Interest Average rate (%) Average balance Interest Average rate (%)
Customer loans and
advances 68,482 591 3.43 63,965 575 3.57 65,992 564 3.40
Interbank items 30,026 127 1.69 34,542 88 1.01 27,904 83 1.18
Securities 2/
46,106 359 3.10 38,876 262 2.67 46,232 337 2.90
Total interest bearing assets 144,614 1,077 2.96 137,383 925 2.67 140,128 984 2.80
Deposits 109,395 227 0.83 108,742 154 0.56 106,978 183 0.68
Others 25,061 214 3.39 20,287 143 2.80 22,893 156 2.72
Total interest bearing liabilities 134,456 441 1.31 129,029 297 0.91 129,871 339 1.04
Net interest income/margin 636 1.75 628 1.81 645 1.83
Year 2004 Year 2003
In $ millions
Average balance Interest Average rate (%) Average balance Interest Average rate (%)
Customer loans and
advances 67,049 2,279 3.40 62,593 2,342 3.74
Interbank items 31,347 404 1.29 38,323 398 1.04
Securities 2/ 45,149 1,328 2.94 32,883 900 2.74
Total interest bearing assets 143,545 4,011 2.79 133,799 3,640 2.72
Deposits 110,114 746 0.68 106,244 718 0.68
Others 24,313 699 2.88 19,092 547 2.87
Total interest bearing liabilities 134,427 1,445 1.07 125,336 1,265 1.01
Net interest income/margin 2,566 1.79 2,375 1.78
Notes:
Non-Interest Income
Table 2
Group Non-Interest Income
In $ millions
4th Qtr 2004
4th Qtr 2003 +/(-)%
3rd Qtr 2004
Year 2004
Year 2003
+/(-) %
Fee and commission income
Stockbroking 45 60 (25) 40 198 169 17
Investment banking 35 24 46 21 104 83 25
Trade and remittances 32 29 10 34 128 111 15
Loan related 39 43 (9) 45 183 155 18
Deposit related 24 26 (8) 24 99 103 (4)
Credit card 22 24 (8) 22 87 89 (2)
Fund management 10 9 11 9 43 40 8
Wealth management (unit trust distribution
and bancassurance) 32 23 39 42 132 90 47
Others 10 13 (23) 10 39 44 (11)
Total 249 251 (1) 247 1,013 884 15
Dividend and rental income 17 21 (19) 31 105 87 21
Other income
Net gain on treasury related activities
(including structured investment products) 93 120 (23) 145 590 650 (9)
Net gain on investment securities 25 28 (11) 20 644 185 248
Net gain on fixed assets - 3 (100) (1) 4 3 33
Others 2 2 - - 6 14 (57)
Total 120 153 (22) 164 1,244 852 46
Total non-interest income 386 425 (9) 442 2,362 1,823 30
Non-interest income as a percentage of
operating income (%) 37.8 40.4 40.7 47.9 43.4
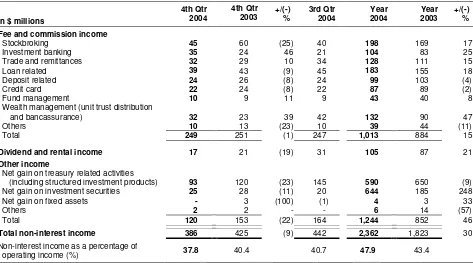
Non-interest income in fourth quarter 2004 declined 9% from fourth quarter 2003 and 13% from third quarter 2004 to $386 million. For the full year, non-interest income increased 30% to $2.362 billion. Excluding the $497 million one-time gains in year 2004, non-interest income was 2% higher.
• Fee and commission income remained strong in fourth quarter 2004. Compared to the year-ago quarter, lower stockbroking fees from quieter regional equity markets was offset by strong growth in investment banking and wealth management fees. Compared to the previous quarter, higher investment banking fees which included income from lead-managing real estate investment trusts was offset by lower wealth management fees. For the year, fee and commission income increased 15% to $1.013 billion contributed by higher wealth management, stockbroking, investment banking, loan related, and trade and remittance fees.
• Other income was $120 million in fourth quarter 2004, a 22% fall from the same quarter last year. Net gain on treasury related activities were lower due to lower profits from interest rate and credit derivatives in fourth quarter 2004. Excluding the one-time gains in 2004, other income declined 12% for the year due to lower income from sales of treasury structured investment products and lower net gain on investment securities.
Operating Expenses
Table 3
Group Operating Expenses
In $ millions
4th Qtr 2004
4th Qtr 2003
+/(-) %
3rd Qtr 2004
Year 2004
Year 2003
+/(-) %
Staff costs 253 217 17 241 970 865 12
Occupancy expenses 41 54 (24) 49 181 203 (11)
Technology-related expenses 82 74 11 74 312 287 9
Revenue-related expenses 55 53 4 45 202 183 10
Others 99 84 18 82 341 303 13
Total operating expenses 530 482 10 491 2,006 1,841 9
Cost-to-income ratio (%) (excluding goodwill
amortisation) 51.9 45.8 45.2 45.31/
43.9
Staff headcount number (at period-end) 11,454 12,144 11,083 11,454 12,144
Note:
1/ Excludes one-time gains arising from sale of Wing Lung shares and disposal of DBS Thai Danu Bank Public Company Limited.
• Excluding goodwill amortisation, operating expenses for fourth quarter 2004 increased 10% to $530 million over fourth quarter 2003 and 8% over third quarter 2004. The increase was mainly due to higher staff costs from bonus accrual in line with the stronger bottom-line performance this year and business expansion. Occupancy expenses were lower in fourth quarter 2004 largely due to write-offs arising from relocation in fourth quarter 2003. Spending on advertising and promotions for retails products were higher with new product launches and branding initiatives in fourth quarter 2004. For the year, operating expenses increased 9% to $2.006 billion mainly due to higher staff costs, advertising and promotion expenses and technology-related expenses.
• Staff headcount at end December 2004 was 11,454, a 3% increase over end September 2004 as DBS continues to invest in skilled resources to meet its expansion needs.
Provision Charge Table 4
Group Provision Charge
In $ millions
4th Qtr 2004
4th Qtr 2003
+/(-) %
3rd Qtr 2004
Year 2004
Year 2003
+/(-) % Specific provision
Loans
Singapore 26 53 (51) (18) 38 182 (79)
Hong Kong 1 24 (96) 15 54 169 (68)
Other countries 9 1 NM - (6) 1 NM
Sub-Total 36 78 (54) (3) 86 352 (76)
Securities, properties and other assets (53) (7) NM 4 (34) 100 NM
Total Specific Provision (17) 71 NM 1 52 452 (88)
1
General provision (14) 11 NM 16 (5) 89 NM
Total provision charge (31) 82 NM 17 47 541 (91)
SP (loans) / Average loan (basis point) 21 48 (0) 13 54
NM: Not meaningful
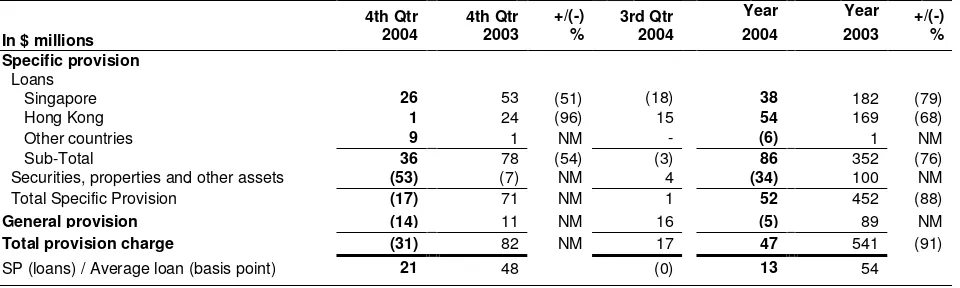
Net provision of $31 million was written back in fourth quarter 2004, as compared to a $82 million charge in fourth quarter 2003 and $17 million charge in third quarter 2004. For the year, total provision charge decreased 91% to $47 million.
• Specific provision charge for loans reduced 54% from fourth quarter 2003 to $36 million in fourth quarter 2004 due to better economic conditions and overall credit quality of the loan portfolio. There was a $53 million write-back in specific provision for securities, properties and other assets in fourth quarter 2004 due to improved valuations. For the year, total specific provision charge was reduced by 88% to $52 million.
[image:10.595.51.531.433.577.2]Balance Sheet
Table 5
Group Key Balance Sheet Items
In $ millions
Dec 31 2004 Sep 30 2004 Dec 31 2003
Total assets 175,553 166,087 159,595
Customer loans 1/ 69,664 67,221 64,335
Customer deposits 113,206 107,008 108,041
Loan-to-deposit ratio (%) 61.5 62.8 59.5
Loan and non-trading debt securities-to-deposit ratio (%) 82.0 84.2 79.7
Note:
1/ After deducting cumulative provisions.
At December 31, 2004, total assets were $176 billion.
• Net customer loans grew 4% from end September 2004 to $69.7 billion at end December 2004, mainly driven by housing loans and loans granted to general commerce sector and financial institutions, investment & holding companies.
• Compared to end September 2004, customer deposits grew 6% mainly due to savings and fixed deposits.
• The Group’s loan-to-deposit ratio at end December 2004 was 61.5%. Including DBSH Group’s portfolio of non-trading debt securities, the ratio of loan and non-trading debt securities to deposits was 82.0%.
Asset Quality
Exhibit 2
Group Non-Performing Loans
Table 6
Group Geographical NPL Rate (Based on MAS standard)
(%) Dec 31 2004 Sep 30 2004 Dec 31 2003
Singapore 2.2 2.2 3.3
Hong Kong 2.0 2.2 2.9
Regional countries2/
(excl. DTDB) 5.6 6.0 19.0
DTDB NA NA 28.8
Other countries 5.0 5.8 8.5
4 , 5 1 2 4 , 4 1 1 8 , 1 4 9
3 , 7 8 0
3 , 3 5 9
2 , 1 8 2 1 , 9 3 41 , 9 1 9 4 , 2 2 4
6 . 1
3 . 0 4 . 6 5 . 7
7 . 6 1 3 . 0
2 . 5 2 . 6 5 .2
0 2 , 0 0 0 4 , 0 0 0 6 , 0 0 0 8 , 0 0 0 1 0 , 0 0 0
D e c 9 9
D e c 0 0
D e c 0 1
D e c 0 2
D e c 0 3
M a r 0 4
J u n 0 4
S e p 0 4
D e c 0 4 0 5 1 0 1 5 2 0
S ' p o r e H o n g K o n g 5 R C (e x c l D T D B ) D T D B O t h e r C o u n t rie s N P L / L o a n s
NA : Not applicable Notes:
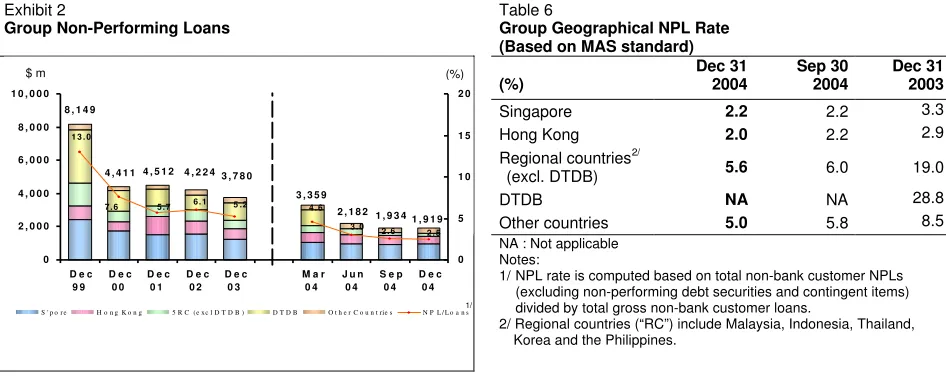
1/ NPL rate is computed based on total non-bank customer NPLs (excluding non-performing debt securities and contingent items) divided by total gross non-bank customer loans.
2/ Regional countries (“RC”) include Malaysia, Indonesia, Thailand, Korea and the Philippines.
• The volume of non-performing loans (“NPLs”) remained stable at $1.9 billion between end September 2004 and end December 2004. Out of the $1.9 billion NPLs, $0.4 billion or 22% were restructured NPLs.
• Singapore’s NPLs was $1 billion and accounted for 50% of the Group’s NPLs, while Hong Kong’s NPLs of $0.5 billion accounted for 25%.
• The ratio of NPLs to the total non-bank loans (“NPL rate”) further improved from 2.6% at end September 2004 to 2.5% at end December 2004. The NPL rates for Hong Kong, regional countries and other countries operations improved to 2.0%, 5.6% and 5.0% respectively, at end December 2004 due to a reduction in non-bank NPLs and a higher loan base.
(%) $ m
Loan Grading
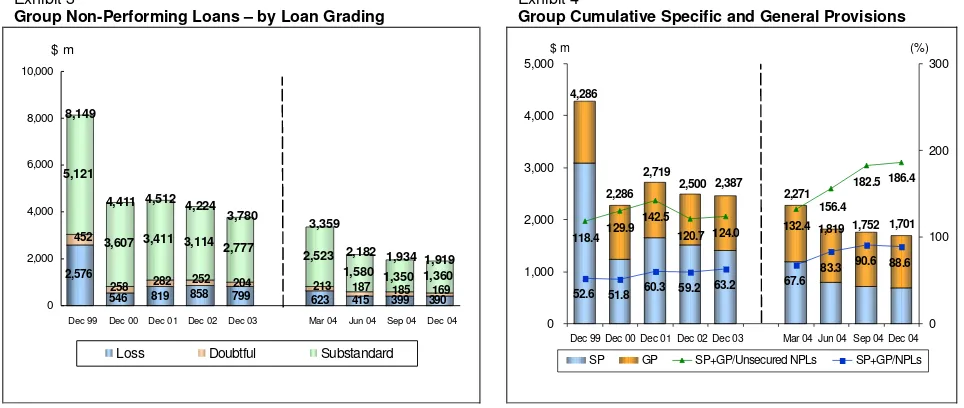
Of the total $1.9 billion NPLs at end December 2004, 71% were classified as substandard, 9% as doubtful and the remaining 20% in the loss category. 52% of the NPLs were secured by collateral.
Cumulative Specific and General Provisions
Total cumulative specific and general provisions at end December 2004 were 186.4% of unsecured NPLs, and 88.6% of total NPLs.
Exhibit 3
Group Non-Performing Loans – by Loan Grading
Exhibit 4
Group Cumulative Specific and General Provisions
$ m
2,576
5,121
3,607 3,411 3,114 2,777
2,523 1,580
546 819 858 799 623 415 399 390 282
169 452
258 252 204 213 187 1,350 1,360185
1,934 2,182 3,359 3,780
4,224 4,512 4,411 8,149
1,919
0 2,000 4,000 6,000 8,000 10,000
Dec 99 Dec 00 Dec 01 Dec 02 Dec 03 Mar 04 Jun 04 Sep 04 Dec 04
Loss Doubtful Substandard
1,752 1,701 4,286
2,286 2,719
2,500 2,387
2,271
1,819 118.4129.9
142.5
120.7 124.0 132.4
182.5
52.6 51.8 60.3 59.2 63.2
67.6
90.6 88.6 156.4
186.4
83.3
0 1,000 2,000 3,000 4,000 5,000
Dec 99 Dec 00 Dec 01 Dec 02 Dec 03 Mar 04 Jun 04 Sep 04 Dec 04 0 100 200 300
SP GP SP+GP/Unsecured NPLs SP+GP/NPLs
[image:12.595.49.531.198.402.2] [image:12.595.55.529.469.556.2]Restructured Loans
Table 7
Loans that were restructured and classified
Dec 31, 2004 Sep 30, 2004 Dec 31, 2003
In $ millions NPLs
Specific
provisions NPLs
Specific
provisions NPLs
Specific provisions
Substandard 351 34 375 33 1,094 125
Doubtful 10 10 13 13 70 54
Loss 58 58 78 78 245 243
Total 419 102 466 124 1,409 422
Table 8
Group Customer Loans
In $ millions
Dec 31 2004
Sep 30 2004
Dec 31 2003
Gross 71,021 68,694 66,414
Less:
Specific provisions 554 579 1,151
General provisions 803 894 928
Net total 69,664 67,221 64,335
Excluding DTDB:
Gross 62,938
Less:
Specific provisions 773
General provisions 745
Net total 61,420
Analysed by Industry
Manufacturing 7,268 6,983 6,434
Building & Construction 6,902 7,021 7,907
Housing Loans 24,091 23,746 22,918
General Commerce 7,297 6,910 6,634
Transportation, Storage & Communications 5,259 5,249 4,821
Financial Institutions, Investment & Holding Companies 7,467 5,739 5,020
Professionals & Private Individuals (except Housing Loans) 7,038 7,061 7,078
Others 5,699 5,985 5,602
Total (Gross) 71,021 68,694 66,414
Excluding DTDB:
Manufacturing 5,423
Building & Construction 7,679
Housing Loans 22,547
General Commerce 5,927
Transportation, Storage & Communications 4,658
Financial Institutions, Investment & Holding Companies 4,940
Professionals & Private Individuals (except Housing Loans) 6,739
Others 5,025
Total (Gross) 62,938
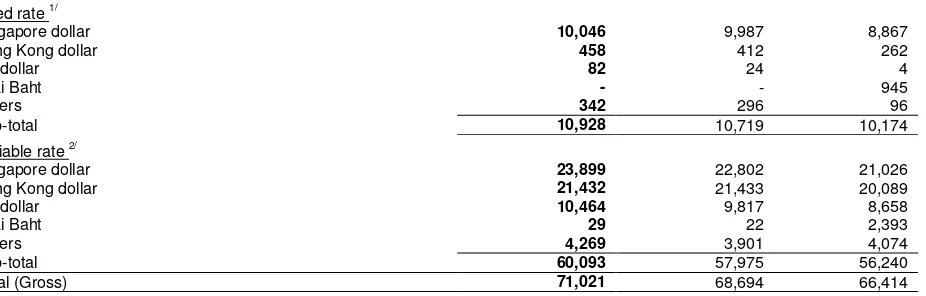
Analysed by Currency and Fixed / Variable Rates Fixed rate 1/
Singapore dollar 10,046 9,987 8,867
Hong Kong dollar 458 412 262
US dollar 82 24 4
Thai Baht - - 945
Others 342 296 96
Sub-total 10,928 10,719 10,174
Variable rate 2/
Singapore dollar 23,899 22,802 21,026
Hong Kong dollar 21,432 21,433 20,089
US dollar 10,464 9,817 8,658
Thai Baht 29 22 2,393
Others 4,269 3,901 4,074
Sub-total 60,093 57,975 56,240
Total (Gross) 71,021 68,694 66,414
Notes:
1/ Fixed rate loans refer to long-term loans where the interest rates are fixed for the initial 1 to 3 years for certain mortgage loans, and over the entire loan period for other loans.
Table 9
Total Group Deposits
In $ millions
Dec 31 2004
Sep 30 2004
Dec 31 2003
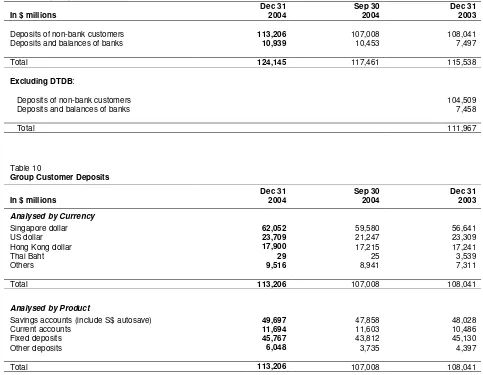
Deposits of non-bank customers 113,206 107,008 108,041
Deposits and balances of banks 10,939 10,453 7,497
Total 124,145 117,461 115,538
Excluding DTDB:
Deposits of non-bank customers 104,509
Deposits and balances of banks 7,458
Total 111,967
Table 10
Group Customer Deposits
In $ millions
Dec 31 2004
Sep 30 2004
Dec 31 2003
Analysed by Currency
Singapore dollar 62,052 59,580 56,641
US dollar 23,709 21,247 23,309
Hong Kong dollar 17,900 17,215 17,241
Thai Baht 29 25 3,539
Others 9,516 8,941 7,311
Total 113,206 107,008 108,041
Analysed by Product
Savings accounts (include S$ autosave) 49,697 47,858 48,028
Current accounts 11,694 11,603 10,486
Fixed deposits 45,767 43,812 45,130
Other deposits 6,048 3,735 4,397
Capital Adequacy Ratio
Exhibit 5
Group Capital Adequacy Ratio
11.8 11.3
4.1 3.6 4.5
14.4 12.2
10.5
10.3 10.4 11.6
5.2 5.2 4.6 4.5 4.0 18.9 17.4
15.5 15.1 14.5 15.6 15.4 15.8
0 5 10 15 20 Dec 00 Dec 01 Dec 02 Dec 03 Mar 04 Jun 04 Sep 04 Dec 04
Tier I Tier II
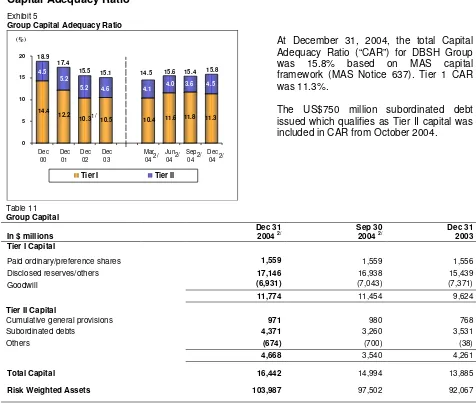
At December 31, 2004, the total Capital Adequacy Ratio (“CAR”) for DBSH Group was 15.8% based on MAS capital framework (MAS Notice 637). Tier 1 CAR was 11.3%.
[image:15.595.49.525.90.497.2]The US$750 million subordinated debt issued which qualifies as Tier II capital was included in CAR from October 2004.
Table 11
Group Capital
In $ millions
Dec 31 2004 2/
Sep 30 2004 2/
Dec 31 2003 Tier I Capital
Paid ordinary/preference shares 1,559 1,559 1,556
Disclosed reserves/others 17,146 16,938 15,439
Goodwill (6,931) (7,043) (7,371)
11,774 11,454 9,624
Tier II Capital
Cumulative general provisions 971 980 768
Subordinated debts 4,371 3,260 3,531
Others (674) (700) (38)
4,668 3,540 4,261
Total Capital 16,442 14,994 13,885
Risk Weighted Assets 103,987 97,502 92,067
Notes:
1/ Compared to end December 2001, the reduction in the Tier I CAR ratio was primarily due to the deduction of additional goodwill with DBS' purchase of the DBS Diamond Holdings Limited minority interest.
2/ Ratios for 2004 were computed based on MAS Notice 637 issued on May 28, 2004. Comparatives for 2003 were not restated and were computed using Bank for International Settlements (“BIS”) guidelines.
Unrealised Valuation Surpluses
Table 12
Group Unrealised Valuation Surpluses
In $ millions
Dec 31 2004 Sep 30 2004 Dec 31 2003
Properties 653 566 424
Quoted investments 531 402 436
Total 1,184 968 860
Unrealised valuation surpluses in properties and quoted investment securities not recognised in the accounts amounted to $1.2 billion at end December 2004.
(%)
1/
2/ 2/ 2/
[image:15.595.51.529.611.676.2]Geographical Segment Analysis
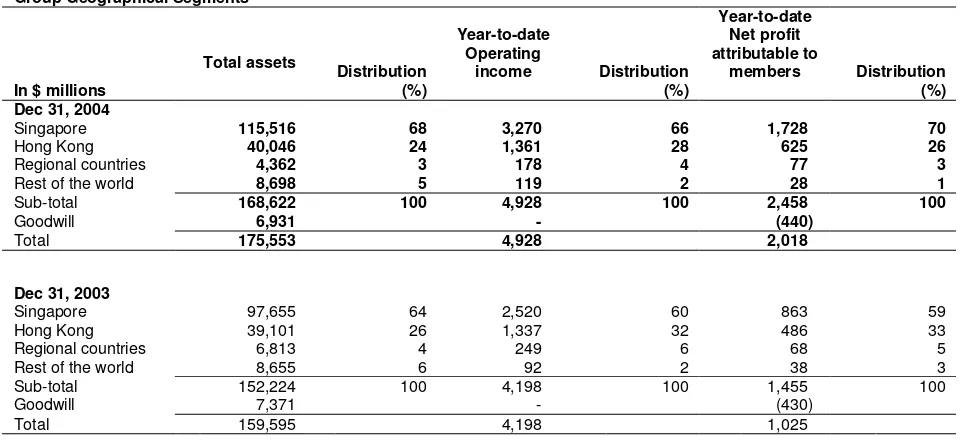
[image:16.595.49.529.163.383.2]The following table analyses total assets, operating income and net profit attributable to members by geographical segments. Unless otherwise stated, the analysis of geographical segments is generally based on the location of the office recording the transactions.
Table 13
Group Geographical Segments
In $ millions
Total assets
Distribution (%)
Year-to-date Operating
income Distribution
(%)
Year-to-date Net profit attributable to
members Distribution
(%) Dec 31, 2004
Singapore 115,516 68 3,270 66 1,728 70
Hong Kong 40,046 24 1,361 28 625 26
Regional countries 4,362 3 178 4 77 3
Rest of the world 8,698 5 119 2 28 1
Sub-total 168,622 100 4,928 100 2,458 100
Goodwill 6,931 - (440)
Total 175,553 4,928 2,018
Dec 31, 2003
Singapore 97,655 64 2,520 60 863 59
Hong Kong 39,101 26 1,337 32 486 33
Regional countries 6,813 4 249 6 68 5
Rest of the world 8,655 6 92 2 38 3
Sub-total 152,224 100 4,198 100 1,455 100
Goodwill 7,371 - (430)
Total 159,595 4,198 1,025
DBSH Group operates in four main geographical areas :
• “Singapore”,which includes the operations of the Asian Currency Unit. • “Hong Kong”, which includes branch and subsidiary operations in Hong Kong.
• “Regional countries”, which includes branch and subsidiary operations in Malaysia, Indonesia, Thailand, South Korea and the Philippines.
• “Rest of the world”, which are mainly branch operations in China, India, Taiwan, United States and United Kingdom.
Business Segment Analysis
The business segment results represent the customer segments of the respective businesses and are determined by:
• Income and direct expenses attributable to each customer and other segment; and
• Management accounting policies relating to the allocation of indirect expenses and funds transfer pricing between the central treasury unit and the customer/other segments.
The various customer segments are described below, along with a description of the change in net profit after taxation for fourth quarter 2004 over fourth quarter 2003.
• Consumer Banking
Consumer Banking focuses on providing products and services to individual customers. The products and services offered to customers include credit facilities (mortgage, personal loans, etc.), credit cards, deposit collection, remittance services and asset management products.
The net profit after taxation was in line with fourth quarter 2003. • Enterprise Banking
Enterprise Banking focuses on providing products and services to small and medium enterprises. The products and services offered to customers include credit facilities (overdraft, factoring/accounts receivable purchase, trade financing, commercial/industrial property financing, hire purchase and government financing and assistance schemes), deposit, payment and collection services and treasury products.
The increase in net profit after taxation ($7 million, 10%) was mainly attributable to higher interest income from increased loan and deposit volumes and higher deposit margins.
• Investment Banking
Investment Banking caters to the business needs of large corporate customers and financial institutions. The products and services offered to customers include direct lending, advisory banking services, bond issuance, equity financing, syndicated financing, mergers and acquisitions advisory services, debt restructuring advisory services, private equity, nominee and trustee services and cash management services.
The decrease in net profit after taxation ($23 million, 24%) was mainly due to lower gains from investment securities.
• Treasury and Markets
Treasury and Markets is primarily involved in market making, structuring and trading of financial products including foreign exchange, securities and interest rate/ credit/ equity/ foreign exchange derivatives. Income from treasury products and services relating to customers of other segments is reflected in the respective customer segments.
The decrease in net profit after taxation ($14 million, 56%) was mainly due to lower treasury gains from interest rate and credit derivatives.
The other segments of the analysis are: • Funding Portfolio
• Central Operations
Central Operations encompasses a range of activities resulting from central corporate decisions and the related income and expenses not attributed to business segments. These include the central treasury unit, funding costs of DBSH Group’s associated and subsidiary companies and gains/losses on properties as well as certain subsidiaries including stock brokerage and asset management.
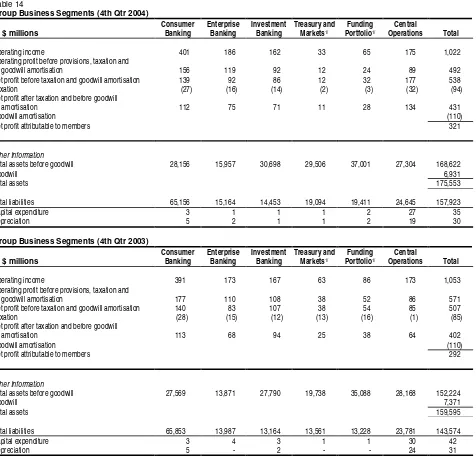
[image:18.595.55.531.167.624.2]The following table analyses the results, total assets and total liabilities by business segments:
Table 14
Group Business Segments (4th Qtr 2004)
In $ millions
Consumer Banking
Enterprise Banking
Investment Banking
Treasury and Markets1/
Funding Portfolio1/
Central
Operations Total
Operating income 401 186 162 33 65 175 1,022
Operating profit before provisions, taxation and
goodwill amortisation 156 119 92 12 24 89 492
Net profit before taxation and goodwill amortisation 139 92 86 12 32 177 538
Taxation (27) (16) (14) (2) (3) (32) (94)
Net profit after taxation and before goodwill
amortisation 112 75 71 11 28 134 431
Goodwill amortisation (110)
Net profit attributable to members 321
Other Information
Total assets before goodwill 28,156 15,957 30,698 29,506 37,001 27,304 168,622
Goodwill 6,931
Total assets 175,553
Total liabilities 65,156 15,164 14,453 19,094 19,411 24,645 157,923
Capital expenditure 3 1 1 1 2 27 35
Depreciation 5 2 1 1 2 19 30
Group Business Segments (4th Qtr 2003)
In $ millions
Consumer Banking
Enterprise Banking
Investment Banking
Treasury and Markets1/
Funding Portfolio1/
Central
Operations Total
Operating income 391 173 167 63 86 173 1,053
Operating profit before provisions, taxation and
goodwill amortisation 177 110 108 38 52 86 571
Net profit before taxation and goodwill amortisation 140 83 107 38 54 85 507
Taxation (28) (15) (12) (13) (16) (1) (85)
Net profit after taxation and before goodwill
amortisation 113 68 94 25 38 64 402
Goodwill amortisation (110)
Net profit attributable to members 292
Other Information
Total assets before goodwill 27,569 13,871 27,790 19,738 35,088 28,168 152,224
Goodwill 7,371
Total assets 159,595
Total liabilities 65,853 13,987 13,164 13,561 13,228 23,781 143,574
Capital expenditure 3 4 3 1 1 30 42
Depreciation 5 - 2 - - 24 31
Note:
1/ Operating expenses have been determined by pro-rating between Treasury and Markets and the Funding Portfolio based on the share of operating income.
Comparatives
DBS GROUP HOLDINGS LTD AND ITS SUBSIDIARY COMPANIES
Audited Consolidated Profit and Loss Account
In $ millions
4th Qtr 20041/
4th Qtr 20031/
+/(-) %
3rd Qtr 20041/
Year 2004
Year 2003
+/(-) %
Interest income 1,077 925 16 984 4,011 3,640 10
Less: Interest expense 441 297 48 339 1,445 1,265 14
Net interest income 636 628 1 645 2,566 2,375 8
Fee and commission income 249 251 (1) 247 1,013 884 15
Dividend income 9 10 (10) 22 72 51 41
Rental income 8 11 (27) 9 33 36 (8)
Other income 120 153 (22) 164 1,244 852 46
Operating income 1,022 1,053 (3) 1,087 4,928 4,198 17
Less: Staff costs 253 217 17 241 970 865 12
Depreciation 30 31 (3) 35 147 168 (13)
Other operating expenses 247 234 6 215 889 808 10
Goodwill amortisation 110 110 - 110 440 430 2
Operating expenses 640 592 8 601 2,446 2,271 8
Operating profit before provisions 382 461 (17) 486 2,482 1,927 29
Less: Provision for possible loan losses and
diminution in value of other assets (31) 82 NM 17 47 541 (91)
Operating profit 413 379 9 469 2,435 1,386 76
Add: Share of profits less losses of associated and
joint venture companies 15 18 (17) 22 77 51 51
Net profit before taxation 428 397 8 491 2,512 1,437 75
Less: Taxation 90 80 13 110 423 337 26
Share of taxation of associated and joint
venture companies 4 5 (20) 6 19 12 58
Net profit after taxation 334 312 7 375 2,070 1,088 90
Less: Minority interests 13 20 (35) 13 52 63 (17)
Net profit attributable to members 321 292 10 362 2,018 1,025 97
NM: Not meaningful Note:
DBS GROUP HOLDINGS LTD AND ITS SUBSIDIARY COMPANIES
Audited Consolidated Balance Sheet as at
Dec 31 Sep 30 Dec 31 In $ millions 2004 20041/ 2003SHARE CAPITAL
Share capital 1,559 1,559 1,556
RESERVES
Share premium account 2,208 2,201 2,171
Other reserve 4,271 4,271 4,271
Capital redemption reserve 28 28 28
Capital reserve (41) (15) (30)
General reserve 2,327 2,230 2,230
Revenue reserve 6,150 5,926 4,670
14,943 14,641 13,340
SHAREHOLDERS' FUNDS 16,502 16,200 14,896
MINORITY INTERESTS 1,128 1,137 1,125
LIABILITIES
Deposits and balances of
banks 10,939 10,453 7,497
Deposits and other accounts
of non-bank customers 113,206 107,008 108,041
Bills payable 350 389 363
Current taxation 635 662 500
Deferred tax liabilities 63 71 104
Other liabilities 18,833 17,976 15,772
Other borrowings and debt
securities in issue 2/ 7,533 6,918 5,604
- due within one year 3,054 2,459 1,882
- due after one year 4,479 4,459 3,722
Subordinated term debts
(unsecured) 6,364 5,273 5,693
- due within one year - - 25
- due after one year 6,364 5,273 5,668
TOTAL LIABILITIES AND SHAREHOLDERS’
FUNDS 175,553 166,087 159,595
OFF BALANCE SHEET ITEMS
Contingent liabilities 8,529 7,960 6,984
Commitments 70,774 70,182 60,173
Financial derivatives 1,518,507 1,664,247 1,256,240
Notes: 1/ Unaudited.
2/ Includes secured amount of $1,814 million as at December 31, 2004 (September 30, 2004: $1,550 million; December 31, 2003: $1,106 million). These are mainly secured by properties and securities.
Dec 31 Sep 30 Dec 31 In $ millions 2004 20041/ 2003
ASSETS
Cash, and balances and
placements with central banks 10,479 5,699 5,007
Singapore Government securities
and treasury bills 11,194 13,431 11,438
Trading securities 11,695 10,980 6,433
Balances, placements with, and
loans and advances to banks 25,168 23,176 27,472
Bills receivable from non-bank
customers 2,333 2,325 1,481
Loans and advances to non-bank
customers 67,331 64,896 62,854
Investment securities 24,208 23,985 22,828
Associated and joint venture
companies 517 546 547
Goodwill 6,931 7,043 7,371
Fixed assets 1,798 1,832 2,016
Deferred tax assets 103 128 129
Other assets 13,796 12,046 12,019
DBS GROUP HOLDINGS LTD AND ITS SUBSIDIARY COMPANIES
Audited Balance Sheet of DBS Group Holdings Ltd as at
Dec 31 Sep 30 Dec 31In $ millions 2004 20041/ 2003
SHARE CAPITAL
Share capital 1,559 1,559 1,556
RESERVES
Share premium account 2,208 2,201 2,171
Capital redemption reserve 28 28 28
Revenue reserve 3,000 3,000 3,001
5,236 5,229 5,200
SHAREHOLDERS' FUNDS 6,795 6,788 6,756
LIABILITIES
Current liabilities 5 8 9
Deferred tax liabilities # # #
TOTAL LIABILITIES AND
SHAREHOLDERS’ FUNDS 6,800 6,796 6,765
Other Information
Net asset value per ordinary share ($)
(i) Based on existing ordinary
share capital 4.50 4.50 4.53
4.36 4.35 4.34 (ii) Assuming non-voting
convertible preference shares (“CPS”) and non-voting redeemable CPS are converted to ordinary shares
Notes:
1/ Unaudited. 2/ #: Insignificant
Dec 31 Sep 30 Dec 31 In $ millions 2004 20041/ 2003
ASSETS
Balances, placements with, and loans and advances to non-bank
customers 3 3 3
Investment in subsidiary companies 6,797 6,793 6,762
DBS GROUP HOLDINGS LTD AND ITS SUBSIDIARY COMPANIES
Audited Consolidated Statement of Changes in Shareholders' Equity
In $ millions
Share Capital
Share Premium
Other Reserve
Capital Redemption Reserve
Capital Reserve
General Reserve
Revenue Reserve
Total Reserves
Balance at January 1, 2004 1,556 2,171 4,271 28 (30) 2,230 4,670 13,340
Exercise of share options pursuant to the DBSH
Share Option Plan 3 37 37
Net exchange translation adjustments during the
period (29) (29)
Appropriation from profit and loss account 97 (97)
-Net profit attributable to members 2,018 2,018
Final dividends paid on ordinary and preference
shares for the previous year (199) (199)
Interim dividends paid on ordinary and
preference shares for the current year (224) (224)
Goodwill transferred on disposal of subsidiary
company 18 (18)
-Balance at December 31, 2004 1,5591/ 2,208 4,271 28 (41) 2,327 6,150 14,943
Balance at January 1, 2003 1,555 2,163 4,271 28 (19) 2,044 4,195 12,682
Exercise of share options pursuant to the DBSH
Share Option Plan 1 8 8
Net exchange translation adjustments during the
period (11) (11)
Appropriation from profit and loss account 186 (186)
-Net profit attributable to members 1,025 1,025
Final dividends paid on ordinary and preference
shares for the previous year (194) (194)
Interim dividends paid on ordinary and
preference shares for the current year (170) (170)
Balance at December 31, 2003 1,556 2,171 4,271 28 (30) 2,230 4,670 13,340
Note:
DBS GROUP HOLDINGS LTD AND ITS SUBSIDIARY COMPANIES
Audited Statement of Changes in Shareholders' Equity of DBS Group Holdings Ltd
In $ millions Share Capital
Share Premium
Capital Redemption Reserve
Revenue Reserve
Total Reserves
Balance at January 1, 2004 1,556 2,171 28 3,001 5,200
Exercise of share options pursuant to the DBSH Share Option Plan 3 37 37
Net profit after taxation 422 422
Final dividends paid on ordinary and preference shares for the
previous year (199) (199)
Interim dividends paid on ordinary and preference shares for the
current year - - - (224) (224)
Balance at December 31, 2004 1,5591/ 2,208 28 3,000 5,236
Balance at January 1, 2003 1,555 2,163 28 3,201 5,392
Exercise of share options pursuant to the DBSH Share Option Plan 1 8 8
Net profit after taxation 164 164
Final dividends paid on ordinary and preference shares for the
previous year (194) (194)
Interim dividends paid on ordinary and preference shares for the
current year - - - (170) (170)
Balance at December 31, 2003 1,556 2,171 28 3,001 5,200
Note:
DBS GROUP HOLDINGS LTD AND ITS SUBSIDIARY COMPANIES
Audited Consolidated Cash Flow Statement
In $ millions
Year 2004
Year 2003
Cash flows from operating activities
Net profit before taxation 2,512 1,437
Adjustments for non-cash items:
Provision for possible loan losses and diminution in value of other assets 47 541
Depreciation of fixed assets 147 168
Goodwill amortisation 440 430
Share of profits of associated and joint venture companies (77) (51)
Net gain on disposal of fixed assets (4) (3)
Net gain on disposal of investment securities (644) (185)
Operating profit before changes in operating assets & liabilities 2,421 2,337
Increase in:
Deposits and other accounts of non-bank customers 8,599 6,726
Deposits and balances of banks 3,590 2,620
Other liabilities including bills payable 3,086 3,082
(Increase)/Decrease in:
Singapore Government securities and treasury bills 244 (2,431)
Trading securities (5,286) (2,761)
Accounts receivable and other assets (1,619) (2,332)
Balances, placements with, and loans and advances to other banks 2,232 11,277
Loans and advances to non-bank customers including bills receivable (8,603) (4,008)
Tax paid (284) (272)
Net cash generated from operating activities (1) 4,380 14,238
Cash flows from investing activities
Dividends from associated companies 33 32
Purchase of fixed assets (100) (85)
Net increase in investment securities (1,285) (7,961)
Cash of subsidiary company disposed (69)
-Proceeds from disposal of fixed assets 40 82
Acquisition of additional interest in subsidiary companies - (3,654)
Net cash used in investing activities (2) (1,381) (11,586)
Cash flows from financing activities
Increase in share capital and share premium 40 9
Net increase in debt securities and borrowings 2,938 602
Dividends paid to shareholders of DBSH (423) (364)
Dividends paid to minority shareholders of subsidiary companies (53) (68)
Net cash generated from financing activities (3) 2,502 179
Exchange translation adjustments (4) (29) (11)
Net change in cash, and balances and placements with central banks (1)+(2)+(3)+(4) 5,472 2,820
Cash, and balances and placements with central banks as at January 1 5,007 2,187
DBS GROUP HOLDINGS LTD AND ITS SUBSIDIARY COMPANIES
Selected Notes to the Accounts
1. Issuance of Ordinary Shares
There were 1,469,965,595 issued and fully paid-up ordinary shares at December 31, 2003. During the year ended December 31, 2004, 22,764,841 ordinary shares were issued upon the conversion of non-voting convertible preference shares and the exercise of executive share options, bringing the total outstanding number of ordinary shares to 1,492,730,436 at December 31, 2004. The weighted average number of ordinary shares was 1,488,572,311 for Year 2004.
Details of issue of new ordinary shares of $1.00 each are as follows:
Particulars
Number of new ordinary shares issued between
October 1, 2004 and December 31, 2004
Number of new ordinary shares that would have been issued upon the conversion/exercise of all outstanding non-voting convertible preference
shares (“CPS”)/non-voting redeemable CPS/executive share options
Dec 31, 2004 Sep 30, 2004 Dec 31, 2003
Conversion of non-voting CPS - 120,436 120,436 19,595,605
Conversion of non-voting redeemable CPS - 66,475,374 66,475,374 66,475,374 Exercise of executive share options 613,210 46,749,383 48,215,063 46,155,436
2.
Loan and Investment Exposures to Malaysia, Indonesia, Thailand, Korea, The
Philippines (Regional Countries), Hong Kong and China
At December 31, 2004, DBSH Group has exposures to certain countries in the Asia Pacific Region. The exposures are determined based on the location of the credit risk of the customers and counter-parties regardless of where the transactions are booked.
The Group’s net exposure in the 5 Regional Countries was $11.1 billion at December 31, 2004. Exposure to the 5 Regional Countries amounted to 6.3% of the Group’s Total Assets.
The DBSH Group’s exposures (assets and non-performing loans) to the Regional Countries, Hong Kong and China at December 31, 2004 are as follows:
Loans and debt securities Net Exposure
In $ millions
Assets in Bank
Central Banks &
Govt. Securities
Non-Bank 1/
Investments
Less: Intercompany
Loans/ Investments in
Financial Subsidiaries/
Overseas
Branches Amount
As a % of Total
Assets NPLs2/
(a) (b) (c) (d) (e) (f)=(a+b (g)
+c+d-e)
Total Regional Countries 6,092 1,999 3,808 1,307 2,137 11,069 6.3% 195
Malaysia 2,064 255 1,794 81 1,357 2,837 1.6% 136
Indonesia 464 285 673 68 165 1,325 0.7% 25
Thailand 184 49 81 406 39 681 0.4% 34
Korea 3,194 1,230 1,144 18 575 5,011 2.9%
-The Philippines 186 180 116 734 1 1,215 0.7% #
Hong Kong 3,628 2,500 24,842 11,323 13,431 28,862 16.5% 471
DBS GROUP HOLDINGS LTD AND ITS SUBSIDIARY COMPANIES
2.
Loan and Investment Exposures to Malaysia, Indonesia, Thailand, Korea, The
Philippines (Regional Countries), Hong Kong and China (Continued)
The DBSH Group’s exposures (assets and non-performing loans) to the Regional Countries, Hong Kong and China at September 30, 2004 are as follows:
Loans and debt securities Net Exposure
In $ millions
Assets in Bank
Central Banks &
Govt. Securities
Non-Bank 1/
Investments
Less: Intercompany
Loans/ Investments in
Financial Subsidiaries/
Overseas
Branches Amount
As a % of Total
Assets NPLs2/
(a) (b) (c) (d) (e) (f)=(a+b (g)
+c+d-e)
Total Regional Countries 4,825 1,500 3,800 1,193 1,692 9,626 5.8% 205
Malaysia 1,518 295 1,711 89 1,124 2,489 1.5% 145
Indonesia 231 165 649 68 165 948 0.6% 26
Thailand 136 167 85 401 44 745 0.4% 34
Korea 2,875 629 1,267 10 358 4,423 2.7%
-The Philippines 65 244 88 625 1 1,021 0.6%
-Hong Kong 4,036 2,747 25,053 11,734 14,172 29,398 17.7% 516
China 2,091 24 1,104 32 729 2,522 1.5% 73
TOTAL 10,952 4,271 29,957 12,959 16,593 41,546 25.0% 794
The DBSH Group’s exposures (assets and non-performing loans) to the Regional Countries, Hong Kong and China at December 31, 2003 are as follows:
Loans and debt securities Net Exposure
In $ millions
Assets in Bank
Central Banks &
Govt. Securities
Non-Bank 1/
Investments
Less: Intercompany
Loans/ Investments in
Financial Subsidiaries/
Overseas
Branches Amount
As a % of Total
Assets NPLs2/
(a) (b) (c) (d) (e) (f)=(a+b (g)
+c+d-e)
Total Regional Countries 5,016 1,104 6,395 955 1,954 11,516 7.3% 1,545
Malaysia 1,280 13 1,356 90 1,034 1,705 1.1% 233
Indonesia 126 56 365 73 128 492 0.3% 55
Thailand (excluding DTDB) 231 9 221 63 214 310 0.2% 188
Korea 3,326 531 885 1 577 4,166 2.6% 17
The Philippines 46 149 103 604 1 901 0.6% 8
DTDB 3/
7 346 3,465 124 - 3,942 2.5% 1,044
Hong Kong 2,457 2,013 23,235 11,935 13,238 26,402 16.5% 643
China 965 24 692 21 393 1,309 0.8% 130
TOTAL 8,438 3,141 30,322 12,911 15,585 39,227 24.6% 2,318
Notes:
1/ Non-bank loans include loans to government and quasi-government entities.
DBS GROUP HOLDINGS LTD AND ITS SUBSIDIARY COMPANIES
3. Non-Performing Loans and Provisions
At December 31, 2004, DBSH Group’s total non-performing loans (“NPLs”) amounted to $1.919 billion. Out of the total NPLs of $1.919 billion, $1.007 billion (52%) were secured by collateral.
Details of DBSH Group’s NPLs and provisions at December 31, 2004 are as follows:
In $ millions Singapore
Hong Kong
Regional Countries2/
Other
Countries Total
Non-Performing Loans 958 471 195 295 1,919
- Substandard 674 341 107 238 1,360
- Doubtful 80 51 - 38 169
- Loss 204 79 88 19 390
NPLs as a % of Group total assets 0.5% 0.3% 0.1% 0.2% 1.1%
Non-bank NPLs as a % of non-bank loans in the
respective countries 1/ 2.2% 2.0% 5.6% 5.0% 2.5%
Total Cumulative Provisions 905 443 155 198 1,701
- Specific provisions 359 159 92 76 686
- General provisions 546 284 63 122 1,015
Total Cumulative Provisions as a % of:
- Group total assets 0.5% 0.3% 0.1% 0.1% 1.0%
- NPLs in the respective countries 94% 94% 80% 67% 89%
- Unsecured NPLs in the respective countries 221% 257% 149% 87% 186%
Details of DBSH Group’s NPLs and provisions at September 30, 2004 are as follows:
In $ millions Singapore
Hong Kong
Regional Countries2/
Other
Countries Total
Non-Performing Loans 935 516 205 278 1,934
- Substandard 645 370 114 221 1,350
- Doubtful 99 47 1 38 185
- Loss 191 99 90 19 399
NPLs as a % of Group total assets 0.6% 0.3% 0.1% 0.2% 1.2%
Non-bank NPLs as a % of non-bank loans in the
respective countries 1/ 2.2% 2.2% 6.0% 5.8% 2.6%
Total Cumulative Provisions 764 420 340 228 1,752
- Specific provisions 368 178 95 74 715
- General provisions 396 242 245 154 1,037
Total Cumulative Provisions as a % of:
- Group total assets 0.5% 0.3% 0.2% 0.1% 1.1%
- NPLs in the respective countries 82% 81% 167% 82% 91%
- Unsecured NPLs in the respective countries 194% 217% 320% 86% 183%
Notes:
DBS GROUP HOLDINGS LTD AND ITS SUBSIDIARY COMPANIES
3. Non-Performing Loans and Provisions (Continued)
Details of DBSH Group’s NPLs and provisions at December 31, 2003 are as follows:
Regional Countries2/
In $ millions Singapore
Hong
Kong DTDB 3/ Others
Other
Countries Total
Non-Performing Loans 1,255 643 1,044 501 337 3,780
- Substandard 842 475 839 352 269 2,777
- Doubtful 42 66 20 49 27 204
- Loss 371 102 185 100 41 799
NPLs as a % of Group total assets 0.8% 0.4% 0.7% 0.3% 0.2% 2.4%
Non-bank NPLs as a % of non-bank loans
in the respective countries 1/ 3.3% 2.9% 28.8% 19.0% 8.5% 5.2%
Total Cumulative Provisions 851 418 561 389 168 2,387
- Specific provisions 475 190 378 193 87 1,323
- General provisions 376 228 183 196 81 1,064
Total Cumulative Provisions as a % of:
- Group total assets 0.5% 0.3% 0.4% 0.2% 0.1% 1.5%
- NPLs in the respective countries 68% 65% 54% 78% 50% 63%
- Unsecured NPLs in the respective countries 173% 180% 105% 111% 53% 124%
Notes:
1/ Computed based on total non-bank customer NPLs (excluding non-performing debt securities and contingent items) divided by total gross non-bank customer loans. 2/ Regional countries include Malaysia, Indonesia, Thailand, Korea and the Philippines
3/ Includes special general provision for regional exposures and additional specific provision for DBS Thai Danu Public Company Limited (“DTDB”)’s loans.
Analysis of Non-Performing Loans by Industry
The following table shows the industry breakdown of the non-performing loans of DBSH Group:
December 31, 2004 September 30, 2004 December 31, 2003
In $ millions NPLs
Specific
Provisions NPLs
Specific
Provisions NPLs
Specific Provisions
Customer loans
Manufacturing 365 175 409 180 894 360
Building and Construction 237 58 239 60 414 98
Housing Loans 253 67 266 73 333 90
General Commerce 186 75 187 79 573 287
Transportation, Storage and
Communications 27 10 31 9 98 25
Financial Institutions, Investment and
Holding Companies 201 58 122 46 199 65
Professionals and Private Individuals
(except Housing Loans) 239 105 227 103 276 133
Others 255 78 282 88 695 165
Sub-total 1,763 626 1,763 638 3,482 1,223
Debt securities 138 52 145 65 184 73
Contingent items 18 8 26 12 114 27
DBS GROUP HOLDINGS LTD AND ITS SUBSIDIARY COMPANIES
3. Non-Performing Loans and Provisions (Continued)
Analysis of Non-Performing Loans by Period Overdue
In $ millions December 31, 2004 September 30, 2004 December 31, 2003
Non-default 744 646 1,695
Default loans 1,175 1,288 2,085
Less than 3 months 339 288 448
3 to 6 months 157 242 255
Over 6 months 679 758 1,382
DBS GROUP HOLDINGS LTD AND ITS SUBSIDIARY COMPANIES
4.
Financial Derivatives
Financial derivatives are financial instruments whose characteristics are derived from the underlying assets, or from interest and exchange rates or indices. These include forwards, swaps, futures and options.
The following tables summarise the contractual or underlying principal amounts of derivative financial instruments held or issued for trading and non-trading purposes. The notional or contractual amounts of these instruments indicate the volume of transactions outstanding at the balance sheet date; they do not represent amounts at risk. In the financial statements, trading derivative financial instruments are revalued on a gross position basis and the unrealised gains or losses are reflected in “Other assets” or “Other liabilities” respectively. Non-trading derivative financial instruments are accounted for on an accrual basis.
December 31, 2004
Trading Non-Trading
In $ millions
Underlying Notional
Positive Fair Value
Negative Fair Value
Underlying Notional
Positive Fair Value
Negative Fair Value
Interest Rate Derivatives 1,128,191 6,900 6,606 17,717 659 220
Foreign Exchange Derivatives 328,245 3,431 3,047 12,730 75 350
Equity Derivatives 13,514 124 342 - -
-Credit Derivatives 15,697 87 121 2,413 12
-Total 1,485,647 10,542 10,116 32,860 746 570
September 30, 2004
Trading Non-Trading
In $ millions
Underlying Notional
Positive Fair Value
Negative Fair Value
Underlying Notional
Positive Fair Value
Negative Fair Value
Interest Rate Derivatives 1,269,871 6,299 5,745 20,550 766 249
Foreign Exchange Derivatives 337,607 1,788 1,752 5,265 55 70
Equity Derivatives 12,923 119 495 - -
-Credit Derivatives 15,610 79 117 2,421 37
-Total 1,636,011 8,285 8,109 28,236 858 319
December 31, 2003
Trading Non-Trading
In $ millions
Underlying Notional
Positive Fair Value
Negative Fair Value
Underlying Notional
Positive Fair Value
Negative Fair Value
Interest Rate Derivatives 994,037 6,733 6,118 24,658 852 237
Foreign Exchange Derivatives 211,723 2,014 1,822 5,664 34 137
Equity Derivatives 8,444 36 196 - -
-Credit Derivatives 9,292 82 109 2,422 77
DBS GROUP HOLDINGS LTD AND ITS SUBSIDIARY COMPANIES
5. Daily Earnings at Risk and Trading Income
The Group uses a Daily Earnings at Risk (“DEaR”) measure as one mechanism for controlling trading risk. The DEaR is calculated using a one-day time horizon and a 99% confidence interval. The following table shows the period-end, average, high and low DEaR for the trading risk exposure of the DBSH Group for the period from January 1, 2004 to December 31, 2004.
January 1, 2004 to December 31, 2004
In $ millions As at December 31, 2004 Average High 1/ Low 1/
Interest rate 24.6 28.2 39.8 21.5
FX 3.7 6.2 14.2 2.7
Equity 5.5 5.5 8.7 3.1
Diversification effect (11.8) (14.0) -
-Total 22.0 25.9 38.4 19.9
Note:
1/ The high (& low) DEaR figures reported for each risk class did not necessarily occur on the same day as the high (& low) reported for total. A
corresponding diversification effect cannot be calculated and is therefore omitted from the table.
The charts below provide the range of DEaR and the daily distribution of trading income in the trading portfolio for the period from January 1, 2004 to December 31, 2004.
Daily Distribution of Group Trading Incom e
0 5 10 15 20 25 30 35 40 45 50
No. of days
Gr ou p D Ea R for Tr a din g Book
0 5 10 15 20 25 30 35 40 45 > 1 8 -1 9 > 1 9 -2 0 > 2 0 -2 1 > 2 1 -2 2 > 2 2 -2 3 > 2 3 -2 4 > 2 4 -2 5 > 2 5 -2 6 > 2 6 -2 7 > 2 7 -2 8 > 2 8 -2 9 > 2 9 -3 0 > 3 0 -3 1 > 3 1 -3 2 > 3 2 -3 3 > 3 3 -3 4 > 3 4 -3 5 > 3 5 -3 6 > 3 6 -3 7 > 3 7 -3 8 > 3 8 -3 9 > 3 9 -4 0
D Ea R ( $ m illion s)