Daniel Santoso 1, Yuh-Show Tsai 2
1
52 – 60 Diponegoro Rd., Salatiga, Indonesia 50711
Department of Electronics and Computer Engineering, Satya Wacana Christian University
2
200 Chung Pei Rd., Chung-Li, Taiwan R.O.C. 32023
Department of Biomedical Engineering, Chung Yuan Christian University Email: [email protected] 1, [email protected] 2
ABSTRACT
The paper introduces a healthcare integration platform, which can provide non-critical physiological values measurement and estimation. The primary objective of this healthcare platform is to facilitate the family members maintain and manage the body health against the overweight and obesity using body mass index (BMI) and body impedance analysis (BIA). The system consists of two sub-systems, the stand-alone system and home gateway system. Functions related to users enrollment and verification, data acquisition, and wireless data transmission are performed by stand-alone system. In other side, home-gateway serves as passive system, which remains stand-by for incoming data from stand-alone system. In addition, the system also equipped with fingerprint module to facilitate automatic personal recognition. Preliminary prototype has been developed and the performance has been evaluated. The system can accommodate up to eight users, represented by their fingerprint. The maximum distance for wireless communication is approximately 10 meters. The focus of the evaluation is the reproducibility and repeatability of the measurement results over certain period. The system is tested on the subject repeatedly and the gathered data set is analyzed. The data analysis indicates that weight measurement has 0.85% maximum standard error while BF, TBW, and BM estimation has 2.82%, 0.65%, and 0.88% respectively.
Keywords: healthcare platform, BMI, BIA,
wireless communication, fingerprint identification.
1
INTRODUCTION
As in all decision making, availability of adequate information is also fundamental in medical care. In this context, the decision-related information basically consists of background information that is medical facts provided by
data that is measured from the subject. Collection of this data, that is the values of health-related variables, is called health monitoring.
Depending on the outlining of the concept, health monitoring incorporates measurement of physiological and psychosocial data from subjects, means of transferring and storing the data and, conceivably, interpretation of the data and feedback. Although term “monitoring” subliminally refers to unconscious observation of the subject (which is indeed one domain of health monitoring), health monitoring means, in scope of this paper collection of health-related data in such manner, which the subject (or user) may actively participate. There are several facts in favor of changing health monitoring from the conventional hospital visits to remote (home) monitoring, e.g. the fact that there is no need to leave home and step into hospital which could sometimes be inconvenient and impractical. This method is especially suitable for constant, long-term, and non-critical physiological values monitoring [1]. Therefore, this method is suitable for monitoring obesity symptoms in a house.
The prevalence of obesity is increasing globally, with nearly half a billion of the World’s population now considered to be overweight or obese [2]. Regardless of its cause, obesity may be associated with a variety of risks. Obesity causes or exacerbates many health problems, both independently and in association with other diseases. In particular, obesity is associated with the development of type-II diabetes mellitus or non-insulin dependent diabetes mellitus (NIDDM) [3, 4], coronary heart disease (CHD) [5, 6, and 7], respiratory complications, dyslipidaemia, gout, osteoarthritis of large and small joints, sleep apnea and other degenerative conditions associated with higher mortality [8]. Obesity has been implicated as a risk factor in the development of hypertension (HT) [9, 10].
height and weight, estimating body fat (BF), total body water (TBW), and body muscle (BM). In addition, the platform also provides fingerprint module to facilitate automatic personal recognition and wireless communication module to facilitate measurement result data transmission to PC.
The research aims to design and implement an integrated health monitoring system for home use. By operating this system at home, it may be expected that the users will be motivated to take a more central role in their own health management. In conjunction, through regular use of an electronic personal health record system, users become more educated and actively involved in their own healthcare.
Some existing monitoring systems with different system architectures are introduced in following section. These specific examples were chosen to provide background information for the current research project.
The first system called TERVA [11]. It was carried out in Finland to provide the user with a general view of development of the subject’s health status and the factors influencing on it by long-term monitoring of physiological and psychosocial variables [12]. The TERVA system consists of different measurement devices connected to a laptop computer which stores the measured data and provides simple feedback.
The results of the project showed that long-term home monitoring affords completely new type of information about behavior of physiological and psychosocial variables and that it is feasible and
useful in medical applications. Currently the system is used as a tool in medical research projects.
Figure 1. Schematic diagram of TERVA system
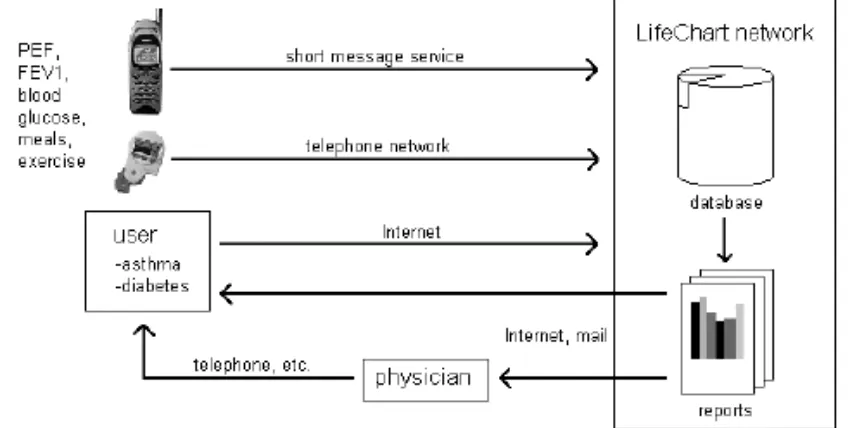
The second system called LifeChart [13]. It is a comprehensive service designed to help persons with such chronic conditions as asthma and diabetes to manage their health. LifeChart is based on the idea that patients can take greater responsibility for their own health when up to date measurement data and thereby better information for care support is constantly available.
Currently the commercial LifeChart network provides support for diabetics and asthma patients. Other potential LifeChart application areas include obesity and weight control, drug delivery monitoring and sleep disorders.
It should be kept in mind, that the introduction of monitoring systems presented here gives only a glance at the spectrum of applications being developed in this area and not all possible solutions are present. Comprehensive systems, conceivably integrated into the living environment, for long-term monitoring of several parameters are under research and development. Many of these are designed to support telecare of the elderly and the disabled. To gain the most from long-term health monitoring, advanced and user-friendly monitoring systems designed for general, everyday use should be developed and conducted into people’s common knowledge and usage.
2
THEORETICAL REVIEW,
DESIGN, AND
IMPLEMENTATION
In this chapter, the fundamental theories are reviewed first in order to enable better understanding upon design and implementation section that will be described later.
2.1
Theoretical Review
There are some functions that are common to most monitoring systems. Depending on its purpose, a monitoring system usually implements some combination of these. Data flow between components is illustrated in Figure 3. As it can be seen, the flow begins from data acquisition and ends in feedback. Various forms of communications can be used in data transfer between these components.
data acquisition
data storing
feedback
automatic data analysis
Figure 3. Data flow in monitoring system
The primary objective of this healthcare is to facilitate the family members maintain and manage the body health against the overweight and obesity using body mass index (BMI) and body impedance analysis (BIA).
BMI is defined as weight/height2 (kg/m2); it is the most commonly used measure of overall obesity (generalized obesity). In recent years, the
standard used to measure overweight and obesity. Most health organizations and published information on overweight and its associated risk factors use BMI to measure and define overweight and obesity. WHO advised the use of BMI cut-off points [14]. A BMI value of 30 or more is now widely accepted as denoting obesity. The table shows a simplistic relationship between BMI and the risk of morbidity.
Table 1. Classification of adult obesity according to BMI
In addition to the anthropometric assessment, other sophisticated tool such as bioelectrical impedance analysis (BIA) is useful for measuring body fat in certain clinical situations especially medical treatment and in obesity research. By using BIA obese individuals can be characterized by measuring body composition, anatomical distribution of fat and energy intake. The basic principles of BIA will be briefly introduced in the following paragraph.
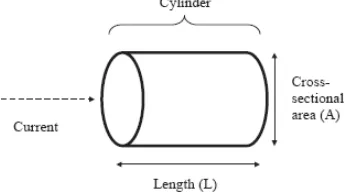
The resistance (R) of a length of homogeneous conductive material of uniform cross sectional area is proportional to its length (L) and inversely proportional to its cross sectional area (A), as illustrated in figure below.
Figure 4. Cylinder model for the relationship between impedance and geometry
R = ρL/A = ρL2/V (1)
and volume
V = ρL2/R (2)
where ρ is the resistivity of the conducting materials and V equals AL. Although the body is not a uniform cylinder and its conductivity is not constant, an empirical relationship can be established between the impedance quotient (length2/R) and the volume of water, which contains electrolytes that conduct the electrical current through the body. In practice, it is easier to measure height than the conductive length, which is usually from wrist to ankle. Therefore, the empirical relationship is between lean body mass (typically 73% water) and height2
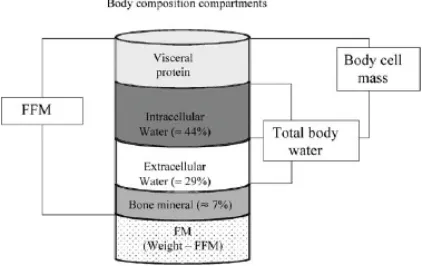
Figure 5. Diagram of fat-free mass (FFM), total body water (TBW), intra-cellular water (ICW), extra-cellular water (ECW),
and body cell mass (BCM)
According to the Figure 5, human body can be divided into two major partitions, fat mass (FM) and fat-free mass (FFM). FFM is everything that is not body fat. It is mainly composed of body water and small portion of protein and mineral. This portion will be used to derive body water and body muscle percentages. Whereas FFM is everything that is not body fat, there is no consensus on the physiological meaning of measures of body cell mass (BCM). The BCM is the protein rich compartment, which is affected in catabolic states, and estimating the size is difficult because it is a complex compartment, comprising all non-adipose cells as well as the aqueous compartment of adipocytes.
/R.
The cylinder model in Figure 4, which is representation of human body, can be partitioned into several compartments as illustrated below.
Several electrical circuits have been used to describe the behavior of biological tissues in vivo
[15]. A circuit that is commonly used to represent biological tissues in vivo is one in which the R of extra-cellular fluid is arranged in parallel to the second arm of the circuit, which consists of capacitance and R of intra-cellular fluid in series, as illustrated below.
Figure 6. The human body consists of resistance and capacitance connected in parallel or in series
R and capacitance can all be measured over a range of frequencies. At zero (or low) frequency, the current does not penetrate the cell membrane, which acts as an insulator, and therefore the current passes through the extra-cellular fluid, which is responsible for the measured R of the body R0. At
infinite frequency (or very high frequency) the capacitor behaves as a perfect (or near perfect) capacitor, and therefore the total body R (R∞
2.2
Design and Implementation
) reflects the combined of both intra-cellular and extra-cellular fluid.
The rest of the cylinder is occupied by FM. By having information about body weight and FFM portion, FM can be determined. The percentage of this portion will be one of the obesity and overweight indicators.
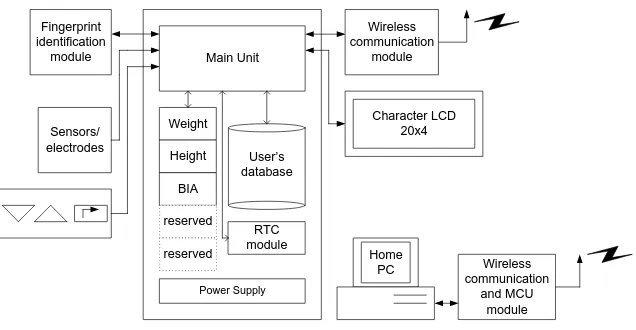
This platform is a microcontroller – based system. MPC82G516A, 8-bit microcontroller from Megawin Technology Co. Ltd. has been selected as the main controller of the system. The system consists of two sub-systems, the stand-alone system and home-gateway system, as illustrated in Figure 7.
Main Unit
Figure 7. Stand-alone system and home gateway system
• Weight scale is capable to weigh human body up to 150 kg.
• Electronic ruler is capable to measure human body height up to 180 cm.
• Bioelectrical impedance analyzer is capable to estimate body impedance using tetra-polar, multi-frequency method based on 300 and 600 Ω reference impedance.
• Fingerprint identification system has enrollment, verification, and template storage functions for eight users.
• Wireless communication module is built based on CC2500, single chip 2.4 GHz low power RF transceiver from Texas Instrument. The desired minimum transmission range is approximately five meters.
• Equipped with clock/calendar function based on Real Time Clock (RTC) chip, DS1307 from Dallas Semiconductor. This function is used to perform automatic user’s age adjustment and provide timestamp for transmitted data.
• The system functions and measurement results can be accessed by the users using simple user interface. This interface consists of three buttons keypad and character LCD 20 columns by 4 lines (20 x 4).
• Simple graphical user interface (GUI) on PC is designed using Microsoft Visual Basic 6 to display the received data from stand-alone system.
The stand-alone system is a complex system consists of analog and digital circuits. It is a microcontroller-based system that integrates various sensing, timekeeping, fingerprint identification, wireless communication, and user interface modules. In order to clarify overall operation of this sub-system, a flowchart with emphasize on user’s perspective is presented below.
Clock
Figure 8. Overall operation of stand-alone system
Rulemeter
d
h
Figure 9. Platform design of stand-alone system
Unlike the stand-alone system, the home-gateway system is much simpler both the hardware and the software. Most of the time, the system is put on receive mode, prepared for incoming data packet. It consists of RF transceiver along with the microcontroller system and a PC. The main task of the software inside the microcontroller is to read received data packet from TI CC2500 RX FIFO, check the CRC flag, and pass the data packet to the serial port if CRC check succeeded. The data packet is then displayed on the PC monitor. The development in this section is still in the preliminary stage. Only very basic features provided. However, the successful data reception and display in this section paves the way for future works such as data logging and data broadcast over internet.
3
RESULT AND ANALYSIS
The brief discussion regarding stand-alone system and home gateway system design has been concluded in previous sub-chapter. In the final development stage, a prototype for stand-alone system and home gateway system has been successfully realized and tested. All functions and modules mentioned in the design specification have been properly built and integrated. The real prototype for stand-alone system is illustrated below.
Figure 10. Stand-alone system prototype
The home gateway system is realized in much simpler prototype. It only physically consists of Megawin ISP-ICP Demoboard, RF transceiver module and RS232 module.
Most of the developing time was allocated to work on weight scale and BIA device thus the test will focus on these two stuffs. In addition, the overall system performance will also be tested and summarized because the main goal of this project is to realize workable and reliable system.
In order to perform simple clinical test, the system was really applied to subjects. The focus of this test is the reproducibility and repeatability of the measurement result over certain period. The purpose of this test is to validate reproducibility and repeatability of the measurements. The measure for reproducibility and repeatability in this experiment is standard error in percentage (SE%
The author played a role as a subject is this experiment. This test was conducted in 10 consecutives days. Each day, the test was conducted in two sessions, morning and evening, repeated for 10 times per session. It is assumed that during repetition, the environmental factors will not change drastically thus any variation on the result shall be caused by the internal mechanism of the system. In average, one session takes 15 minutes. Totally, the system has been tested at least for 200 times thus it also provides reliability information of the overall system. The subject is male, 26 years old, with weight approximately 72 kg and 175 cm tall based on the reading on traditional weight scale and ruler. The results are based on the reading on the LCD screen as illustrated in the Figure 11.
). The test is discussed in the following section.
According to test scheme, there are vast amount of data set that can be analyzed to evaluate the performance of the system. However, those data are not shown in this paper because of the limited space.
Figure 11. LCD display when measuring weight, height, BF, TBW, and BM
The reference system is also accompanied with manual, which contains recommendation [Table 2] from health experts regarding the percentages of BF, TBW, and BM. Assuming that the redesigned system can approach the performance of reference system, the recommendation can serve as comparison table for the experiment results above.
Table 2. Body composition recommendation [16]
Based on that table, the reading of the redesigned is plausible considering the first subject’s posture. Only the TBW is little bit lower than lower boundary, 56% compared to 62.5%. The low reading on TBW does not imply that the system does not work properly. It indicates that subjects are lightly dehydrated.
This project is a system development and integration thus the overall system performance and behavior should be evaluated as well. The evaluation in this section will be brief and concise, based on author experience while conducting the experiment on the system. Both stand-alone system and home gateway system are still in preliminary prototype but they are fully functional. The system is designed to accommodate eight users, represented by their unique fingerprint images. A simple test has been performed to validate the ability of the algorithm to limit the user number and to assign proper ID number after deletion. The author enrolled eight of his fingerprints to the system, simulated eight different users. Each enrolled fingerprint was then verified and system could return the associated ID correctly for each fingerprint. Whenever author attempted to enroll additional fingerprint, the system denied. The ID no 04 then was deleted. The author attempted to enroll again, it was successful and the given ID is 04. The wireless communication was not evaluated thoroughly. The communication reliability only depends on the inherent CRC check of transceiver chip. If the CRC check passed, the data displayed [Figure 12], if it is failed the data discarded and the user notified. The longest transmission range ever
tested successfully was approximately 10 meters, using maximum power setting.
Figure 12. Successful reception is displayed in PC GUI
The power consumption is also out of consideration in this project. Therefore, no power saving scheme is incorporated into the system. The current reading on the power supply panel indicates that the current drawn by stand-alone system is relatively high, approximately 250 mA. Further investigation reveals that LCD module along with its backlight is responsible for this power wasting.
In a system development, durability in real utilization and environment is also cannot be omitted as well as long-term reliability and stability. However, due to time and resources limitation those factors could not be well examined.
4
CONCLUSION AND FUTURE
DIRECTIVES
An In-House Health Monitoring System prototype has been designed and implemented based on Megawin 82G5126A microcontroller. The prototype has capability of measuring general physiological parameters, body height and body weight and also estimating body composition based on BIA. In addition, supporting modules such as fingerprint identification, wireless RF transceiver, and RTC have been integrated and work properly.
with the user’s active involvement in monitoring his/her health and expert advice from physician, a sophisticated health management system can be established in the ordinary households.
There are several possibilities to improve current performance of the system. In order to address power consumption issue, the LCD module can be replaced with the advanced module, which has lower power consumption with equal or better appearance. The other approach, the current LCD module can be maintained with the backlight software-controlled. By doing this way, the backlight will only be turned on whenever necessary to reduce power consumption. The next readily improvement is on the wireless communication scheme. The improvement to duplex mode can give advantage to communication reliability. In case of CRC check error detected on home gateway, it can give feedback to stand-alone system to request re-transmission. The stand-alone system is then may repeat data transmission with higher RF power since it is programmable.
The successful data reception on the home gateway paves the way for future improvements. Data storing, data analysis and long-term health monitoring are the most readily features that can be integrated to this system. Furthermore, the health record can be regularly sent to the affiliated clinic over internet to be remotely analyzed by physician and the proper advice can be given to the user through email.
REFERENCES
[1] Williams G, Doughty K, & Bradley DA (2008) A systems approach to achieving CarerNet - an integrated and intelligent telecare system. IEEE Transactions on Information Technology in Biomedicine 2(1): 1-9
[2] Rossner S (2002) Obesity; the disease of the twenty-first century. International Journal of Obesity 26: S2-S4.
[3] Gordon T, Castelli WP, Hjortland MC, Kannel WB, & Dawber T R (1977) Diabetes, blood lipids and the role of obesity in coronary heart disease risk for women: The Framingham Study. Annals of Internal. Medicine 87: 393-397.
[4] Bose K (1992) Non-insulin-dependent (type II) diabetes mellitus and obesity in Asian in UK; Scope for Future Studies. Journal of The Royal Society of Health 112: 291-293. [5] Foster WR and Burton BT (1985) Health
implications of obesity. Annals of Internal Medicine 103: 1055-1065.
[6] Ghosh A, Bose K, & Das Chaudhuri AB (2003) Association of food patterns, central obesity measures and metabolic risk factors for coronary heart disease (CHD) in middle aged Bengalee Hindu men, Calcutta, India. Asia Pacific Journal of Clinical Nutrition 12: 166-171.
[7] Ghosh A, Bose K, Chakravarti S, Das Chaudhuri AB, Chattopadhyay J, Dasgupta G, & Sengupta S (2004) Relationship of waist circumference and waisthip ratio with metabolic risk factors of coronary heart disease among Bengalee Hindu men of Kolkata, India. Journal of The Royal Society of Health 124: 86-91.
[8] Seidell JC & Bouchard C (1997) Visceral fat in relation to health; Is it a major culprit or simply an innocent bystander ? International Journal of Obesity 21: 626-631.
[9] Bose K & Mascie-Taylor CGN (1998) Conicity index and waist-hip ratio and their relationship with total chole-sterol and blood pressure in middle-aged European and migrant Pakistani men. Annals of Human Biology 25: 11-16.
[10] Vague J (1956) The degree of masculine differentiation of obesities; A factor determining predisposition to diabetes, atherosclerosis, gout and uric calculous disease. American Journal of Clinical Nutrition 4: 20-34.
[11] Korhonen I, Lappalainen R, Tuomisto R, et al. (1998) TERVA: Wellness Monitoring System : Proceedings of the 20th
[12] Korhonen I, Iivainen T, Lappalainen R, et al (2001) TERVA: System of Long-Term Monitoring of Wellness at Home. Telemedicine Journal and e-Health, 7(1): 61-72.
Annual International Conference of the IEEE Engineering in Medicine and Biology Society. Hongkong, November, 1998, pp. 1988-1991.
[13] Springer J (1999) LifeChart [Online] Available a [Accessed: 15 Mar 2008].
[14] World Health Organization (1998) Report of a WHO consultation on obesity. Geneva: WHO. [15] Gudivaka R, Schoeller DA, Kushner RF, Bolt
MJ (1999) Single- and multifrequency models for bioelectrical impedance analysis of body water compartments. Journal of Applied Physiology 87: 1087–96.

![Table 2. Body composition recommendation [16]](https://thumb-ap.123doks.com/thumbv2/123dok/1110805.647743/7.595.337.531.119.283/table-body-composition-recommendation.webp)
