Nutrition During Life cycle Childhood
King Abdul-Aziz University
Faculty of Applied Medical Science
Second Year –
Clinical Nutrition Department
Growth & Development & Assessment
Growth patterns :
● The rate of growth slows after the first year of life.
● Growth is steady and slow during the preschool
and school-age years, but it can be erratic in individual children with periods of no growth followed by growth spurts.
Growth patterns :
● These patterns usually parallel with changes in appetite and food intake.
Head growth is minimal,
Trunk growth slows substantially,
limbs lengthen considerably,
The legs straighten,
The abdominal and back muscles strengthen to support now erect child.
● All of which create more mature body proportions, Because of walking and increased physical activity .
Growth patterns :
● Sex differences in body
composition become
increasingly apparent, boys
have more lean body mass per
centimeter of height than girls.
Growth patterns :
● These changes are gradual and subtle, occurring over years.
● Fat
gradually decreases during the early childhood years, reaching a minimum between 4 and 6 years of age.Growth patterns (cont) :
●
Girls have a higher percentage of weight as fat than boys, even in the preschool years, but these differences in lean body mass and fat do not become significant until adolescence.Catch up growth:
Many infants' born at or below the tenth (10th) percentile for
length may not reach their genetically appropriate growth channel until 1 year of age.
Lag-down growth:
Larger infants at birth who are genetically determined to be smaller grow at their fetal rate to several months and often do not reach their growth channel until 13 months
of age .This phenomenon during the first year of life .
A child who is recovering from an illness or undernutrition and whose growth has slowed or ceased.
This recovery is referred to as catch-up growth, a period during which the body strives to return to the child's normal growth channel.
Catch-Up Growth:
●
More of nutrient requirements are important of children to catch- up growth. For instance, more protein, energy, and other nutrients including; vitamin A, iron, and zinc.Catch-Up Growth:
Assessing Growth:
●Because children are growing and changing, periodic assessments allow any problems to be detected and treated
early.
Assessing Growth include;
Anthropometric assessment
Biochemical assessment ( HCT/Hb )
Clinical assessment
Dietary assessment
Assessing Growth:
● A complete assessment of nutritional status includes the collection of anthropometric data. This includes ;
1) length or standing height, 2) weight,
3) weight for length or BMI , 4) upper arm circumference .
5) Triceps skin fold measurement
● All of which are plotted as percentiles on the Centers for Disease Control and Prevention (CDC).
● Measurements that are less commonly used but that provide estimates of body composition include upper arm circumference and triceps skin fold
Assessing Growth:
● Weight that increases rapidly and crosses growth channels suggests the development of obesity.
● Lack of weight gain or loss of weight over a period of months may be a result of;
Undernutrition,
An acute illness,
An undiagnosed chronic disease, or
Significant emotional or family problems.
1. The child should be bare footed.
2. Stand with, heels together, arms to the side, legs straight, shoulders relaxed.
3. Position the head in the horizontal plane.
4. Heels, buttocks, scapulae (shoulder blades), and back of the head should be against the vertical board of the stadiometer.
Height,
5. Child should inhale deeply, hold the breath, and stand tall while the headboard is lowered upon the highest point of the head with enough pressure to compress the hair.
6. The measurement should be read to the nearest 0.1 cm. and the eye level parallel with the headboard to avoid errors due to parallax.
Height,
1. Body weights using a balance beam scale. The zero weight on the scale’s.
2. Scales must be placed on a flat, hard surface.
3. The child should stand still in the middle of the scale’s platform without touching anything .
4. The weight should be read to the nearest 100 g (0.1 kg)
5. Ideally, child should be weighed with minimal underclothing .
Weight,
Weight,
Balance Beam Scale
BMI (Body Mass Index)
• An anthropometric index of weight and height measurements
• Measures of body fat.
• Body mass index (BMI) = weight (kg) / height (m)².
BMI (Body Mass Index)
Advantages of using body mass index;
1. An indirect measure of body fatness, (BMI can be considered a proxy for measures of body fat).
2. BMI-for-age relates to health risks,
(correlates with clinical risk factors for cardiovascular disease including hyperlipidemia, elevated insulin, and high blood
pressure) .
3. Compares well both of weight-for-stature measurements and measures of body fat.
BMI (Body Mass Index)
BMI for Children,
Differs by Age and Gender
Because adiposity varies with age and gender during childhood and adolescence,
BMI is specific.
Example:
95th Percentile Tracking Age BMI
2 yrs 19.3 4 yrs 17.8 9 yrs 21.0 13 yrs 25.1
BMI (Body Mass Index)
Adiposity:
The amount of fat in the body, expressed either as total fat mass (in kg) or the fraction as a percentage of total body fat.
Shape of BMI-for-Age Growth Curve:
“Adiposity Rebound ”(AR) Example: Early AR
Age (mos) BMI 26 18.2 32 17.4 38 18.5 41 18.7
Body Mass Index (BMI) for age
Using BMI-for-age Percentiles to Assess the Risk
> 95th percentile Obesity
85th to < 95th percentile Overweight
< 5th percentile Underweight Body Mass Index (BMI) for age
Using BMI-for-age Percentiles to Assess the Risk
These percentiles indicate the rank of BMI in a group of 100 children of the same gender and age.
Body Mass Index (BMI) for age
Using BMI-for-age Percentiles to Assess Risk
For example, in a group of 100 children:
5 children will have a BMI-for-age that is at or above the 95th percentile.
10 will have a BMI-for-age that is between the 85th and 95th percentiles.
5 will have a BMI-for-age less than the 5 percentile, and
80 children will have a BMI-for-age that is within the normal range.
Body Mass Index (BMI) for age
Using BMI-for-age Percentiles to Assess Risk
Note:
Charts designed for birth to 36 months of age are based on recumbent length measurements and nude weights,
Also, charts used for 2 to 20 year-olds are based on standing height and weight with light clothing and without shoes.
Growth channel:
A curve of weight and length or height gain throughout the period of growth, between 3 and 6 months of age.
Area between any 2 percentiles on the growth chart is referred to as growth channel
Percentiles rank
Percentile is a measure that tells us what percent of the total
frequency scored at or below that measure. A percentile rank is the percentage of scores that fall at or below a given score.
These percentiles indicate the rank of BMI in a group of 100 children of the same gender and age.
Percentiles rank
Percentiles rank
About Percentile Ranks:
Percentile rank is a number between 0 and 100 indicating the percent of cases falling at or below that score.
Percentile ranks are usually written to the nearest whole percent: 74.5% = 75% = 75th percentile.
Scores are divided into 100 equally sized groups.
There is no 0 percentile rank - the lowest score is at the first percentile.
There is no 100th percentile - the highest score is at the 99th percentile.
Available CDC Growth Charts
Birth to 36 months Weight-for-length
Length-for-age
Weight-for-age
Head circumference-for-age
Available CDC Growth Charts
2 to 20 years BMI-for-age
Stature-for-age
Weight-for-age
Weight-for-height
Steps to Plot and Interpret BMI-for-Age
The six steps to plot and interpret BMI-for-age;
1. Obtain accurate weights and height measurements.
2. Select the appropriate growth chart,
Weight-for-age , stature-for-age , BMI-for-age 3. Calculate BMI.
4. Record the data.
5. Plot measurements.
6. Interpret the plotted measurements.
Case Study: “Sam”
Name: Sam
Weight: 37 lb 4 oz (16.9 kg)
Height: 41.5 inches (105 cm)
DOB (date of birth): 9/15/1994
DOV (date of visit): 4/4/1998
1. Obtain accurate weights and height measurements.
Boys: 2 to 20 years
BMI BMI
Accurate Measurements are Critical
5.6 year old boy
Weight: 41.5 lb Height: 43 in BMI= 15.8
BMI-for-age=50th %tile
Inaccurate height measurement:42.25 BMI=16.3
BMI-for-age=75th %tile
2. Select the appropriate growth chart,
Weight-for-age stature-for-age BMI-for-age
2. Select the appropriate growth chart,
Weight-for-age
stature-for-age
BMI-for-age
BMI = weight (kg)/[height (m)]2 Calculation:
[weight (kg)/ height (cm)/ height (cm)] x 10,000
3. Calculate BMI with The Metric system
Example:
A child’s weight= 16.9 kg and, height= 105.4 cm
BMI = [16.9 kg / 105.4 cm / 105.4 cm] x 10,000 = 15.2 kg/m2
4. Record the data;
4. Record the data
4/4/98
Mother’s Height________
Father’s Height________
Age
3 1/2
Gestational
Age________ Weeks
Weight
37 lb 4 oz
Comment
15.2
Date Height BMI
41.5 in
5. Plot measurements
Sam’s BMI Plotted on Boy’s BMI-for-Age Chart
6. Interpretation:
• Sam’s BMI-for-age is slightly below the 25th
%tile so it falls within the normal range.
• Of 100 boys who are the same age, fewer than 25 have a BMI-for-age lower than Sam’s.
Boys: 2 to 20 years
BMI BMI
Can you see the risk
This girl is 4 years, 4 weeks old.
Is her BMI-for-age
below the 5th percentile?
5th to <85th percentile: normal?
>85th to <95th percentile: at risk for overweight?
>95th percentile: overweight?
Girls: 2 to 20 years
BMI BMI
Measurements:
Plotted BMI-for-Age
Age = 4 y 4 wks
Height =106.4 cm =(41.9 in)
Weight =15.7 kg =(34.5 lb)
BMI =13.9
BMI-for-age = 10th percentile
Normal
This girl is 4 years old.
Is her BMI-for-age ?
● below the 5th percentile?
● 5th to <85th percentile: normal?
● >85th to <95th percentile: at risk for overweight?
● >95th percentile: overweight?
Can you see the risk
Measurements:
Age=4 y
Height=99.2 cm (39.2 in)
Weight=17.55 kg (38.6 lb)
BMI=17.8
BMI-for-age= 94thpercentile At at the high risk for overweight
Girls: 2 to 20 years
BMI BMI
Plotted BMI-for-Age
• This boy is 3 years, 3 weeks old.
• Is his BMI-for-age
- below the 5th percentile?
- 5th to <85th percentile: normal?
- >85th to <95th percentile: at risk for overweight?
- >95th percentile: overweight?
Photo from UC Berkeley Longitudinal Study, 1973
Plotted BMI-for-Age
Boys: 2 to 20 years
BMI BMI
Can you see risk?
Measurements:
Age=3 y 3 wks
Height=100.8 cm (39.7 in) Weight=18.6 kg (41 lb)
BMI=18.3
BMI-for-age=>95thpercentile overweight
Upper Arm Circumference
Circumferences are measures of specific muscle groups and locations recorded in centimeters.
It can be used as a reliable and valid indicator of muscle size and body shape.
It is a simple and inexpensive way of tracking muscle growth over time.
Skin Fold Measurements
skinfold_caliper
It helps estimate the body composition of children whose weight for height percentiles are
• > 90th (at risk of overweight)
• or <10th(at risk of wasting)
Biochemical Assessment
• Laboratory measurements used for assessment of nutritional . Laboratory tests typically completed during child check-ups are usually quite limited.
• A urinalysis that tests a urine sample for protein, sugar, and ketone bodies may be done to screen for more serious medical problems.
• A simple finger stick that can measure the hematocrit, or packed cell volume, may be done.
• Healthcare providers try to limit routine or screening blood draws and more invasive biochemical assessments in typically needle-
Biochemical Assessment
Biochemical:
CBC.
HbA1C.
lipid profile.
Genetic screening.
Hormonal assay.
ECG.
CXR.
USG.
Dietary Assessment
● A dietary record, 24-hour recall (diet history), and a food frequency questionnaire can help estimate and assess dietary intake.
● Many factors influence nutrient intake, such as psychosocial factors, all of which can affect the amount and types of foods eaten.
● Family eating patterns, food cooking and storage capabilities, feeding history, dentition or oral muscular development, and food allergies or intolerances can affect the nutritional status of children .
Dietary Assessment
Dietary.
Diet history.
Physical activity.
Parental attitudes and behavior.
Positive family history of relevant disease .
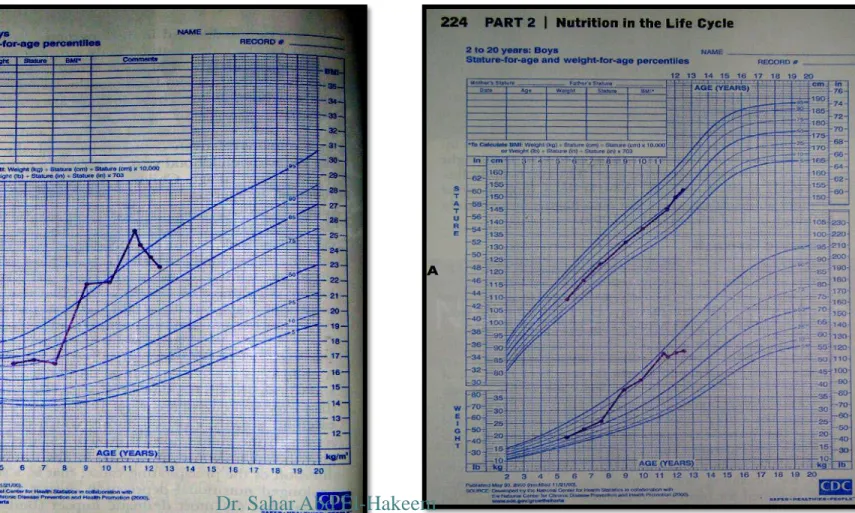
Figure 7-1 : A, Growth chart for an 8-year-old boy who gained excessive weight after having leg surgery and being immobilized in a body cast for 2 months. The surgery and immobilization were followed by a long period of stress from family problems. At the age of 11 years, he became involved in a weight management program.