Dynamic Simulation and Composition Control in A 10 L
Mixing Tank
Yulius Deddy Hermawan
Che ical E gi eeri g Depart e t, Faculty of I dustrial Tech ology, UPN Vetera Yogyakarta Jl. SWK 104 (Lingkar Utara), Condongcatur, Yogyakarta INDONESIA
E-mail : [email protected]
Abstract :
The open loop experiment of composition dynamic in a 10 L mixing tank has been successfully done in laboratory. A 10 L tank was designed for mixing of water (as a stream-1) and salt solution (as a stream-2 with salt concentration, c2¬ constant). An electric stirrer was employed to
obtain uniform composition in tank. In order to keep the liquid volume constant, the system was designed overflow. In this work, 2 composition control configurations have been proposed; they are Alternative-1 and Alternative-2. For Alternative-1, the volumetric-rate of stream-1 is chosen as a manipulated variable, while the volumetric-rate of stream-2 is chosen as a manipulated variable for Alternative-2. The composition control parameters for both alternatives have been tuned experimentally. The volumetric-rate of manipulated variable was ha ged ased o step fu tio . The outlet strea ’s o positio respo se ( 3) to a change in the input volumetric-rate has been
investigated. This research gave Proportional Integral Derivative (PID) control parameters. The gain controllers Kc [cm6/(gr.sec)] for
Alternative-1 and Alternative-2 are –34200 and 40459 respectively. Integral time constant (I) and Derivative time constant (D) for both
alternatives are the same, i.e. I = 16 second, and D = 4 second. Furthermore, closed loop dynamic simulation using computer programming
was also done to evaluate the resulted tuning parameters. The developed mathematical model of composition control system in a mixing tank was solved numerically. Such mathematical model was rigorously examined in Scilab software environment. As can be seen from our closed loop simulation, closed loop responses in PID control were faster than those in P and PI controls.
Keywords: closed loop, open loop, PID control, mixing tank, step function.
1. Introduction
A mixing tank is frequently used in chemical process industries, for examples as a blending tank and/or a continuous stirred tank reactor. Liquid composition in a mixing tank is one of important parameters for mixing processes or chemical reaction processes in reactor. The propagation of mass disturbance is possibly occurred in mixing processes. Therefore composition control should be implemented to overcome the propagation of mass disturbances.
Composition control parameters such as proportional gain controller (Kc), integral time constant (I), and
derivative time constant (D) should be tuned properly, since they really affect the stability of mixing process. However designed composition control system must be able to give a stable response in facing the mass disturbances. Therefore the study on dynamic simulation and composition control is very important.
Some studies of process dynamic and control have been done. Recently, Hermawan et al [1] have presented the open loop composition dynamic in a 10 L Mixing Tank experimentally. Hermawan et al [2] have also presented the design of control configuration of non-interacting-tank system using quantitative analysis of relative gain array. Hermawan [3] has implemented Process Reaction Curve (PRC) for tuning of temperature control parameters in a 10 L Stirred Tank Heater. Widayati and Hermawan [4] have studied the mixing characteristic in a horizontal stirred tank.
c2 2 : Feeding tank of stream-1 3 : Feeding tank of stream-2 4 : Tank for making a disturbancec2 5 : Storage tank
6 : Transfer pump 7 : Three way valve
8 : Valve 9 : Stirrer
Main Tank (as a mixing tank)
Figure1. Experimental apparatus setup
2. Material and Methods
Experimental apparatus setup is shown in Figure 1. As can be seen from Figure 1, No.1 is a main tank that represents a mixing tank. This mixing tank has 2 input streams, i.e. stream-1 and stream-2, and 1 output stream, i.e. stream-3. In normal condition, stream-1 and stream-2 come from the feeding tank No. 2 and No. 3 in Figure 1, respectively. In this work, water was used as a stream-1 with its volumetric rate f1 [cm3/sec], and salt solution as a stream-2 with its volumetric rate f2 [cm3/sec] and concentration c2 [gr/cm3]. The input concentration c2 is constant. The output stream (stream-3) has volumetric rate f3 [cm3/sec] and concentration c3 [gr/cm3]. The concentration c3 is measured by means of Conductivity-meter. Since the liquid volume is kept constant, the system is designed overflow. A stirrer is employed to obtain uniform composition in the mixing tank. The material balance of the mixing tank can be written as follows:
In this research, 2 composition control configurations are proposed, i.e. Alternative-1 and Alternative-2 as shown in Figure 2. Open loop tuning experiment is done for either alternatives by changing the opening valve of stream-1 (No. 8a in Figure 1) or stream-2 (No. 8b in Figure 1) to increase/decrease its volumetric rate immediately. The output concentration (c3) response to a change in input volumetric rate is then investigated. The resulted
response will similar with that response given by first order plus dead time (FOPDT) model. PID Control parameters are then tuned by fitting the resulted FOPDT as proposed by Ziegler-Nichols [5]. These open loop experiments should be started from its initial (normal) conditions.
In order to evaluate the resulted PID Control parameters, dynamic simulation is carried out by means of computer. A simple feedback control system is implemented to maintain liquid concentration in tank (c3) constant
by manipulating the volumetric rate of stream-1 or stream-2. Thus, the equation of manipulated variables for both of control configuration alternatives can be written as follow:
Alternative-1:
Where e(t) is defined as:
t c c
tCT CC SPC3
f1(t) , c1
f2(t) , c2
c3(t)
f3(t), c3(t)
CT CC SPC3
f1(t) , c1
f2(t) , c2
c3(t)
f3(t), c3(t)
(a) Alternative-1 (b) Alternative-2
Alt. CV MV D
1 c3 f1 f2
2 c3 f2 f1
CV: Controlled Variable MV: Manipulated Variable D: Disturbance
Notes:
Figure 2. Composition Control Configuration: (a) Alternative-1, (b) Alternative-2.
The developed mathematical model of composition control system in the mixing tank is solved numerically with the easiest way of explicit Euler. The free software Scilab is chosen to carry out the closed loop dynamic simulation. The closed loop responses of composition control will then be explored in this work.
3. Result and Discussion.
Steady state parameters of mixing tank are listed in Table 1. Based on steady state material balance, the process time constant is found 37 seconds (0.6 minutes). Therefore the system is considered quite sensitive to the changes of input disturbances.
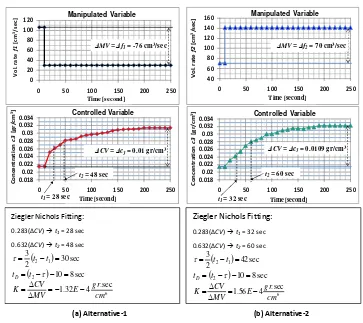
3.1. Tuning of Composition Control Parameters for Alternative-1
For Alternative-1, volumetric rate of water (f1) is considered as a manipulated variable to maintain liquid
composition in tank (c3). Figure 3.a shows the influence of f1 on c3. Volumetric rate of water is decreased by an
amount of 76 cm3/sec immediately; the concentration c3 rises about 0.01 gr/cm3. The tuning results of
composition control parameters (P, PI, and PID) for Alternative-1 are listed in Table 2.
3.2. Tuning of Composition Control Parameters for Alternative-2
For Alternative-2, volumetric rate of salt solution (f2) is considered as a manipulated variable to maintain
liquid composition in tank (c3). Figure 3.b shows the open loop composition response to a change in the volumetric
rate f2. The concentration c3 increases (about 0.01 gr/cm 3
) as the volumetric rate f2 increases (about 70 cm 3
/sec). The tuning results of composition control parameters (P, PI, and PID) for Alternative-2 are also listed in Table 2.
Table 1. Steady state parameters
No Variable Steady state
1 Volumetric rate of stream-1, f1 (cm3/second) 106
2 Volumetric rate of stream-2, f2 (cm 3
/second) 71
3 Volumetric rate of stream-3, f3(cm
3
/second) 177
4 Concentration of stream-1, c1 (gr/cm3) 0
5 Concentration of stream-2, c2 (gr/cm
3
) 0.05
6 Concentration of stream-3, c3 (gr/cm
3
) 0.0214
7 Liquid volume in tank, V (cm3) 6600
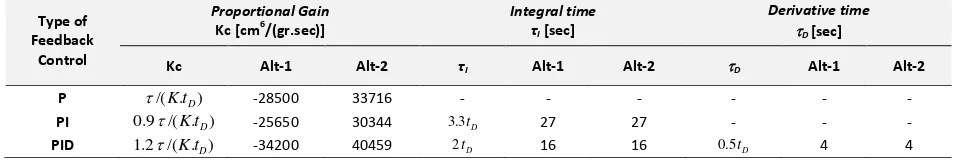
Table 2. Tuning results of composition control parameters.
Type of Feedback
Control
Proportional Gain
Kc [cm6/(gr.sec)]
Integral time
τI [sec]
Derivative time
D [sec]
Kc Alt-1 Alt-2 τI Alt-1 Alt-2 D Alt-1 Alt-2
P /(K.tD) -28500 33716 - - - -
PI 0.9/(K.tD) -25650 30344 3.3tD 27 27 - - -
Ziegler Nichols Fitting:
Ziegler Nichols Fitting:
. (ΔCV) t1 = 32 sec
Figure 3. Tuning of Composition Control Parameters: (a) Alternative-1, (b) Alternative-2.
3.3. Dynamic Simulation of Composition Control for Alternative-1
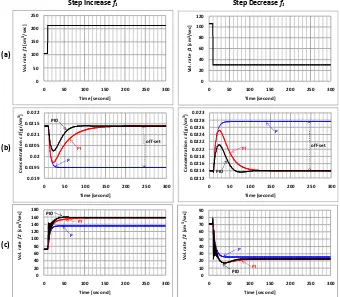
Closed loop responses to a change in volumetric rate f2 are illustrated in Figure 4. The disturbances were
ade y follo i g oth fu tio s of step i rease a d step de rease. For step i rease’s distur a e, olu etri
rate f2 is increased by an amount of 70 cm 3
/sec at time equals 10 seconds. As can be seen, the composition controller (P, PI, and PID) attempts to return concentration c3 to its normal value of 0.0214 gr/cm3. Concentration c3 can be returned to its set point by both of PI and PID Controls. P Control produces an offset of 0.0019 gr/cm
3
. Closed loop response of PID Control is fastest compared to P and PI Controls; Concentration c3 can be returned to
its set point at time equals 150 seconds.
For step de rease’s distur a e, olu etri rate f2 is decreased by an amount of 56 cm
3
/sec at time equals 10 seconds. The concentration c3 decreases first, and then rises to its normal value. However P Control still produces
an off-set of about 0.0028 gr/cm3. Closed loop response of PID Control is the fastest; the set point of c3 can be
achieved at time equals 120 sec.
3.4. Dynamic Simulation of Composition Control for Alternative-2
Figure 5 shows closed loop responses to a change in volumetric rate f1. For this alternative, the disturbances
were also made by following both functions of step increase and step de rease. For step i rease’s distur a e, volumetric rate f1 is increased by an amount of 106 cm
3
/sec at time equals 10 seconds. As shown in Figure 5, concentration c3 decreases as volumetric rate f1 increases, and then concentration c3 can be returned to its set point by both of PI and PID Controls. P Control produces an offset of 0.0019 gr/cm3. Closed loop response of PID Control is the fastest one; concentration c3 can be returned to its set point at time equals 150 seconds.
For step de rease’s distur a ce, volumetric rate f1 is decreased by an amount of 76 cm3/sec at time equals 10
seconds. The concentration c3 increases as the volumetric rate of water decreases, and then drops to its normal
0
Figure 4. Closed Loop Responses of Composition Control Alternative-1 to a change in volumetric rate f2: (a) Volumetric rate f2, (b) Concentration c3, (c) Volumetric rate f1
0
4. Conclusion
This paper has discussed tuning of composition control parameters and dynamic simulation in a 10 L mixing tank. Two alternatives of composition control configurations have been proposed. Closed loop dynamic behaviours of the two control configurations have been explored. According to my dynamic simulation, the tuning results of composition control parameters produce stable responses. This research reveals that PID Composition Control produces the fastest responses compared to both of P and PI Composition Controls.
Acknowledgements
I appreciate the technical support on the use of free software SCILAB. I gratefully acknowledge Ir. Gogot
Haryo o MT of UPN Vetera Yogyakarta for alua le dis ussio . I also tha k Agusti M a d A iad H for helpi g
me during my research in laboratory.
Nomenclature
c1,2,3 concentration of stream 1, 2, 3 [gr/cm3]
c3 SP
set point of liquid concentration in tank [gr/cm3]
e error [gr/cm3]
f1,2,3 volumetric rate of stream 1, 2, 3 [cm3/second]
K steady state gain of the process [(gr.second)/cm6] Kc proportional gain controller [cm6/(gr.second)]
t1 time at w
t2
tD effective process dead time [second]
V liquid volume in tank [cm3] Greek letters
CV steady state change in controlled variable [gr/cm3]
MV step change in manipulated variable [cm3/second]
effective process time constant [second]
D derivative time constant [second]
I integral time constant [second]
References
[1] Hermawan YD, Haryono G, Agustin M, Abiad H. 2012. Composition Dynamic in A 10 L Mixing Tank, Seminar Nasional Teknik Ki ia Kejua ga , Depart e t of Che i al E gi eeri g, Fa ulty of I dustrial, UPN Vetera Yogyakarta : C15-1 – C15-6. (in Indonesian)
[2] Hermawan YD, Suksmono Y, Narno Putra RM, Puspitasari M. 2010. Design of Process Control Configuration for Non -Interacting-Tank System using Quantitative Analysis of Relative Gain Array, Seminar Nasional Teknologi Simulasi (TEKNOSIM) 2010, Department of Industry and Mechanical Engineering, Faculty of Engineering, Gadjah Mada University : 75 – 81. (in Indonesian).
[3] Hermawan YD. 2011. Implementation of Process Reaction Curve for Tuning of Temperature Control Parameters in A 10 L Stirred tank Heater, Journal of Materials Science and Engineering, Vol. 1, No. 4 September 2011 : 572 – 577
[4] Widayati TW, Hermawan YD. 2007. Mixing Characteristic in A Horizontal Stirred Tank, Seminar Nasional Teknik Kimia
Kejua ga , Depart e t of Che i al E gi eeri g, Fa ulty of I dustrial, UPN Vetera Yogyakarta : B -1 – B12-6.
(in Indonesian)