I S I NTERNATI ONAL MI GRATI ON A WAY OUT
OF ECONOMI C CRI SI S?
Setiadi an d Sukamdi
I n ti sar i
Ba gi pem er i n t a h I n d on esi a , t er k a i t d en ga n per m a sa l a h a n ketenagakerjaan, terdapat dua permasalahan yang seakan tiada akhir yakni ti n ggi n ya an gka pen gan gguran dan ren dahn ya upah pekerja. Kon di si i n i semaki n parah sejak badai kri si s ekon omi melan da In don esi a sejak tahun 1997 yang mengakibatkan menurunnya kemampuan sebagian besar anggota m asyar akat u n tu k m em bi ayai hi du pn ya. H al i n i di sebabkan ol eh menurunnya pendapatan riil dan meningkatnya harga berbagai kebutuhan sehari -hari . Dalam li n gkup regi on al, kon di si kri si s ekon omi yan g di alami In don esi a semaki n men doron g n egara i n i berada pada ti n gkat teren dah perkembangan ekonomi dibandingkan dengan negara-negara di kawasan tersebu t. Lambatn ya proses econ omi c recovery men yebabkan semaki n lan gkan ya kesempatan kerja di dalam n egeri dan akhi rn ya men doron g pen in gkatan arus migrasi in tern asion al ten aga kerja In don esia ke n egara-negara di kawasan Asia dan Asia Tenggara utamanya Malaysia, Singapura dan Tai wan . Den gan demi ki an , bagi para mi gran , melakukan mi grasi merupakan suatu bagi an dari strategi un tuk kelan gsun gan hi dup keti ka pilihan -pilihan yan g lain san gat terbatas.
Over blown Pover ty: Questionable I m pact of the Cr isis
and Rp7,000 per US$. Near the beginning of the crisis up to the ousted president Abdurachman Wahid took his post, the exchange rate of the Indonesian currency, the Rupiah, was Rp6,750 against the US dollar. The Rupiah reached, again, its lowest value in 2001 when the Rupiah sank to Rp11,350, reflecting an almost 90 percent increase in the purchasing price of foreign materials (Widharto, 2002).
Since economic crisis, Indonesia is in the midst of dramatic political and economic upheaval. Few Indonesia have remained untouched by these and other events of the last couple of years. The drought of 1997, the relative price changes associated with the collapse of the rupiah and removal of subsidies and the income shocks arising from changes in demand combine to yield an extremely complex picture of substantial change throughout the society. The effects of the economic crisis on the welfare of the population are nuance and heterogeneous. They vary by region, across socio-economic groups, and across demographic groups. For some, the crisis has taken a heavy tool; these include those on fixed income and those whose livelihoods depend on sectors such as construction and services. For others, the changes have provide new opportunities— particularly those in trade able sectors such as export producers and shipping (Frankenberg, et. al., 1999).
One of the topics frequently discussed by many experts concerning the economic crisis in Indonesia is the impact of the crisis on the people’s economic life. The discussions often use two indicators: poverty and unemployment.
Yet, these figures had been quoted widely by journalists, policy makers, and even scholars, both in Indonesia and other countries.
Estimates that incorporate province-specific inflation rates (based on BPS price data from 44 urban areas) suggest that overall, the proportion of households below the poverty line has risen by about 25 percent, with a large increase in urban than in rural areas. Estimates that allow for higher overall inflation and higher inflation in rural and urban areas (as indicated by the price data collected in the IFLS communities), suggest that the rise in poverty is considerably larger – around 80 percent— and that rural households have experienced more change than urban households (Frankenberg, et. al., 1999).
Fortunately, as more data and observations are available, the estimates have been much downward revised. The situation during 1998 is not as bad as w as earlier estimated. In the mid-1999 Statistics Indonesia presented the official estimates on poverty in 1998, based on the National Socioeconomic Survey conducted in December 1998. The poverty rate is only 24.2 percent in Indonesia as a whole, which is an increase from 11.3 percent in 1996. The rate in urban areas is 17.6 (million) or 21.9 percent in 1998 compared to 31.9 (million) or 7.2 percent in 1996; and, in rural areas, 25.7 percent in 1998 compared to 12.3 percent in 1996. The trend from this official data suggests that urban areas had been harder hit during
Table 1
Trend of Poverty and Unemployment in Indonesia in 1996-1998
Years Poor People (%)
Open Unemployment Rate (%)
Under Employment Rate (%)
1990 15.08 3.17 34.06
1993 13.67 2.76 37.35
1996 11.34 4.89 36.24
1998 24.20 5.46 36.64
the crisis. In absolute term, the number of poor increased from 22.5 million in 1996 to 49.5 million in 1998 for the whole Indonesia; from 7.2 million in 1996 to 17.6 million in 1998 for the urban areas; and from 15.3 million in 1996 to 31.9 million in 1998 for the rural areas (BPS, 1997 and 1998).
It is very unlikely that this figure (for December 1998) shows a much improvement in poverty condition in the mid-1998. Rather, the previous estimates for the mid-1998 must have been inaccurate. However, the release of the official estimate still reveals that poverty had increased from the condition in 1996, before the crisis, to the condition in 1998, during the crisis, but the increase was not as dramatic as earlier thought.
Mubyarto (2000) argues that the inaccuracy in estimating the poverty is because of both the misconception on poverty and the panic-pessimism among experts, policy makers, and people in international donor agencies. Asahi Shimbun (26 January, 1999) even mentions the situation is just “exaggerate poverty and unemployment level for an effort to get aid”.
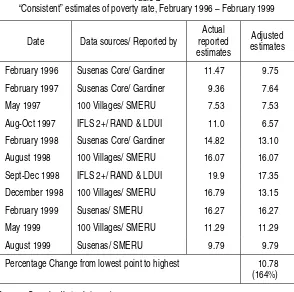
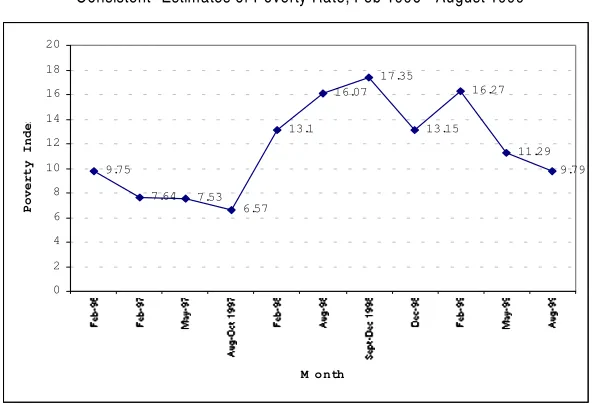
With more data and methods available, more estimates are also produced. Suryahadi et. al. (1999) has attempted to make a consistent estimate on what had happened during February 1996 until August 1999 based on these various, and sometimes conflicting estimates. As shown in Figure 1 and Table 1, the poverty rate was 9.75 percent in February 1996. It then declined to 6.57 percent in August-October 1997 (when the crisis just started), rose to 17.35 percent in September-December 1998, and declined to 9.79 percent in August 1999, which is already similar to the early 1996 level, but still higher than the rate at the beginning of the crisis.
“absorption” simply means “sharing poverty” and it does not necessarily help the “refugees”; it even reduces the welfare of the “local”. In other words, the agricultural sector has experienced a severe involution.
As it is shown by Strauss, et. al. (2002) poverty was not really increasing in the period of 1997-2000. Even there is tendency of declining poverty in urban areas in 7 out of 13 provinces, and in rural areas in 7 out of 13. However we can observe that in certain provinces such as rural West Nusa Tenggara, the increase in poverty is very large, while in other such as rural South Sumatra, the decline is large, although from very high levels. This paper has also presented an interesting result that over half
Table 2
“Consistent” estimates of poverty rate, February 1996 – February 1999
Date Data sources/ Reported by
Actual reported estimates
Adjusted estimates
February 1996 Susenas Core/ Gardiner 11.47 9.75
February 1997 Susenas Core/ Gardiner 9.36 7.64
May 1997 100 Villages/ SMERU 7.53 7.53
Aug-Oct 1997 IFLS 2+/ RAND & LDUI 11.0 6.57
February 1998 Susenas Core/ Gardiner 14.82 13.10
August 1998 100 Villages/ SMERU 16.07 16.07
Sept-Dec 1998 IFLS 2+/ RAND & LDUI 19.9 17.35
December 1998 100 Villages/ SMERU 16.79 13.15
February 1999 Susenas/ SMERU 16.27 16.27
May 1999 100 Villages/ SMERU 11.29 11.29
August 1999 Susenas/ SMERU 9.79 9.79
Percentage Change from lowest point to highest 10.78 (164%)
of those in poverty in 1997 left poverty by 2000. On the other hand, almost 55 percent of the poor in 2000 were not poor in 1997.
In short, the above discussions have shown that the impact of the economic crisis has penetrated all economic sectors, though the impact varies according to the sector and not as dramatic as thought in the 1998. Concerning with the economic impact from the crisis, the thesis often express that the crisis have reduce the people’s purchasing power caused by two factors working simultaneously, that is the decreasing of the people’s real income and the drastic increase of the daily necessity cost. Both factors cause the economic condition of people in general is buried. Basically, it is most likely that only a limited people who get advantages from crisis. In general, they are the people “forgotten” during the economic glory, that is partly in the agricultural sector, especially hard crop and both small and middle industries. This is, all at once, proving that, in fact, those infected the crisis is the government not the people. We must also bear in mind that the impact of the crisis does not single direction and
Figure 1
"Consistent" Estimates of Poverty Rate, Feb 1996 - August 1999
but varies across regions and sometimes in micro perspective it is surprising and contradictory.1
Unem ploym ent and Wage of Labour : Unending Pr oblem
Disregarding w ith the problem of amount, that the important undeniable fact is that the economic crisis has caused some of the people lossing jobs. According to Swasono (1998), it is estimated that the labor amount being fired of works were about 1.5 millions - 3.6 millions people deriving from many sectors due to economic crisis. The other people having difficulties for fulfilling their daily needs and that of no less importance is that they are the people who directly participate in the formal economic activities and exist on the middle level.
ILO (1997) estimated that in 1998 open unemployment w as 13.7 million people coming from 5.8 million unemployed people in previous year, 2.7 million additional new labour force and 5.2 million of those who lose their job because of the crisis. In 2001, open unemployment was eight million people with unemployment rate reached 8.1 percent increasing from 6.1 percent in previous year. This figure is almost doubled compared to that before the crisis which was 4.7 percent (Kompas, 28 May, 2002). Another estimation (Swasono and Anung Anindita, 2002) by using estimated GDP for 1998, which was minus 15 percent, open unemployment will increase to 17.0 million or 18 percent of the labour force, and under employment will increase doubled than that in 1996. In total open unemployment and under employment will reach 35 million or 37.9 percent of the labour force. Even though there is no a single agreement about the figure, but all people seems to agree that the crisis has a serious impact on declining employment opportunity bringing about a more serious problem of unemployment.
The other critical problem on Indonesia economic development is wages of labour. Historically, the Indonesian government announces minimum wages for all the regions. However, in 1992 it was found that
1 Many scholars has argued that one should be careful in interpreting the impact
the levels of these minimum wages in many regions were below the levels of these requirements for physical survival. Later the wage levels raised, but even in 1995 there six provinces in which the official minimum wages w ere below those needed for basic physical needs (Nachrow ie and Wangkeraren, 1996).
These policies, combined the policies of banning all strikes, have kept the wages of unskilled labourers among the lowest in developing countries in Asia. In the early 1990s the unskilled urban wage was Rupiah 1,176 with the value of the rupiah ranging from 1,842.8 to 2,252 to the US dollar between 1990 and 1995, this would render the wage comparable to or even lower than that obtaining in the cities of the much poorer economies of Bangladesh, India and Pakistan. Indonesia has one of the lowest average wage rate in Asia, and the lowest in the Asean countries (ILO, 1997).
By 1998 slightly higher fractions of man and considerably higher fractions of women are working than in 1997. The changes are similar in urban and rural areas. However, changes in the proportion working reflect largerly an entrance of unpaid family workers. Generally, the employment opportunities seem to be stronger in Sumatra (North and South) and Kalimantan than on Java or in West Nusa Tenggara.
I nter national Migr ation in the Econom ic Cr isis Er a
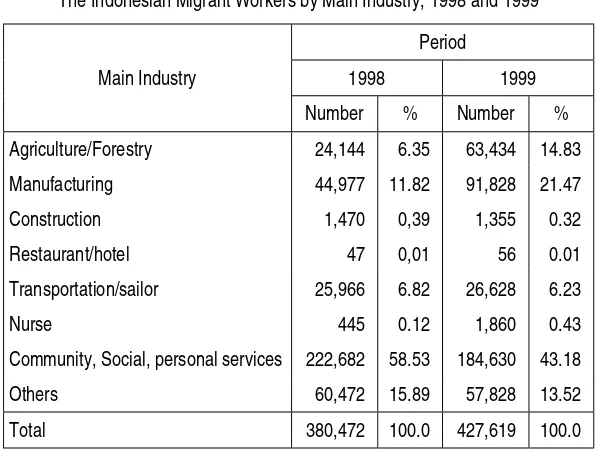
to find out that a lot of overseas worker are women migrant (TKW) that is 71,39 percent and the rest (28,61 percent) are men.
Table 3 has also shown that there is a significant increase of Indonesia w orkers involving in manufacturing sector but it is also clear that community, social and personal services, in which house maid is included, is still prevalence. One of the reason is that those working abroad are mostly low educated people. Some studies on Indonesian international migration indicate that Indonesian workers are mostly characterized by low education, limited knowledge and skills, and are between the ages of 15 and 40. A study in four provinces (West Nusa Tenggara, East Java, Yogyakarta, and Central Java) organized by Ministry of Labor shows that more than 50 percent respondents w as elementary school and not completed of elementary school. Raharto (1999) who interviewed 133 migrant in Cianjur and Indramayu district found similar finding. Ninety three percent of respondents were not completed elementary school and
Table 3
The Indonesian Migrant Workers by Main Industry, 1998 and 1999
Period
1998 1999
Main Industry
Number % Number %
Agriculture/Forestry 24,144 6.35 63,434 14.83
Manufacturing 44,977 11.82 91,828 21.47
Construction 1,470 0,39 1,355 0.32
Restaurant/hotel 47 0,01 56 0.01
Transportation/sailor 25,966 6.82 26,628 6.23
Nurse 445 0.12 1,860 0.43
Community, Social, personal services 222,682 58.53 184,630 43.18
Others 60,472 15.89 57,828 13.52
Total 380,472 100.0 427,619 100.0
even have no schooling education. It is most likely the reason that male laborers are mainly employed in unskilled jobs such as plantation and lumber industry work, while female laborers are mainly employed as housemaid and cooks (Bandiyono and Alihar, 2000). Tirtosudarmo, (2002) mentions that most of the workers (56,45 percent) are working in formal sector and 43,55 percent in informal sector.
Table 4 shows the number of migrant workers working abroad annually during 1996-2000 period. Among these four destination countries, only Taiwan which show a consistent increase of Indonesian worker. Taiwan started with a limited number of Indonesian worker in 1996 and passed Singapore in the year of 2000. On the other hand, Singapore, Malaysia and Arab Saudi experienced a fluctuation in the period of 1998-2000. In the period of 1996-1997 for instance, the number of Indonesian worker in Malaysia increase significantly. A year later the number of worker was decreasing. Even though the number of Indonesian worker in 1999 and 2000 was still much lower than that in 1997 but it is clear that there is a dramatic increase in the period of 1998-2000. On the other hand the number of Indonesian worker in Singapore tends to decrease consistently in the period of 1996-2000. This is an indication that Singapore is no longer becoming preference for Indonesian worker to work. In Arab Saudi, before the economic crisis, the number of migrants who were working in the country was 115,209, increasing up to 1116,844 in 1997 and 177,404 in 1998. But it then decreased in the period of 1998-2000. It is interested that there were a shifting pattern of destination countries of Indonesian
Table 4
Number of the Indonesian Migrant Workers in Selected Countries (1996-2000)
Countries 1996 1997 1998 1999 2000
Malaysia 38,652 317,685 95,033 169,177 170,067
Singapore 29,065 31,928 42,031 34,829 20,456
Taiwan 8,888 9,445 14,109 29,372 41,620
Saudi Arabia 115,209 116,844 177,404 131,157 108,734
migrant workers, from Saudi Arabia to Asian Pacific countries such as Malaysia and Taiwan. Malaysia is still becoming the main destination for Indonesian worker, at least indicated by the highest number of Indonesian worker in 2000.
Based on neoclassical economics in macro perspective, international migration occurs because of existing geographic differences in the supply and demand for labor in origin and destination countries which also act as the major driving factors for individual migration decisions. The imbalance of labour market causing an increase of unemployment in Indonesia in one hand and an increasing demand of labour, at least for certain type of work, in neighboring countries on the other hand might explain how this theory work for Indonesian case.
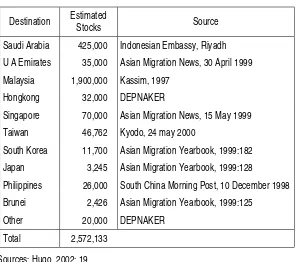
Table 5
Indonesia: Estimated Stocks of Overseas Contract Worker Around 2000
Destination Estimated
Stocks Source
Saudi Arabia 425,000 Indonesian Embassy, Riyadh
U A Emirates 35,000 Asian Migration News, 30 April 1999
Malaysia 1,900,000 Kassim, 1997
Hongkong 32,000 DEPNAKER
Singapore 70,000 Asian Migration News, 15 May 1999
Taiwan 46,762 Kyodo, 24 may 2000
South Korea 11,700 Asian Migration Yearbook, 1999:182
Japan 3,245 Asian Migration Yearbook, 1999:128
Philippines 26,000 South China Morning Post, 10 December 1998
Brunei 2,426 Asian Migration Yearbook, 1999:125
Other 20,000 DEPNAKER
Total 2,572,133
From micro perspective, neoclassical approach explain that a cost-benefit calculation is the main reason for individual rational actors who make decisions to migrate. Differences in earnings are the important factor. Several cases shows that this also work for Indonesian migrants working abroad (see Mantra, 1999; Sukamdi, et. al., 2001).
One of the important issues taken into account on economic impact of migration discussion is remittances. Even the issue of remittances has becoming main concern of policy makers in Indonesia. The word “labour export” implicitly referring to the expectation that Indonesian migrants will generate income not only for the migrants and their family but also for the country. Critics on this policy is that government tends to obey the interest of migrants to have security assurance in destination area and after coming home.
Findings from many researches on the use of remittances show that mostly remittances are to fulfill the basic need such as consumption. It is rarely found that remittances are spent for productive purposes. So that it might be true that the impact of remittances on poverty alleviation is arguable. However it can not be denied that the migrants get economic benefit from international migration. At least they receive income much higher in destination than that in the origin area.
We must bear in mind that the “negative” impact of international migration can not be neglected. Research on return women migrants from Arab Saudi (Sukamdi, et. al., 2001) in Yogyakarta reveals that the returning migrants have faced several social and psychological problem. In destination area some of them experience sexual abuse. In the way home they have to combat with robbery and after their arrival they must deal with social and psychological adaptation problems. That is why their economic benefits could not compensate social cost that they have to pay.
The remittance is substantial in supporting households economy and the improvement of migrant household conditions (see Mantra, 1999). Migrants from Central Lombok, use most of their remittances to pay off their debts, to cover their daily needs, and to provide their children education expenditures. The similar findings have also been found in Yogyakarta showing that 60.5 percent of the migrant’s family use the remittances in similar way. Only a limited number is using the remittance to be invested in productive activities (Sukamdi, et. al. 2001). The same research has also found out that most of the migrants is capable to buy house facilities such as TV because of remittances. About 59 percent of migrants state that they bought it by some money that they obtained from working abroad. Study in West Nusa Tenggara and Nusa Tenggara has also revealed that the family had used remittance for various purposes and the important one is to build houses. In Yogyakarta 38,3 percent of the migrants admitted that they could build their house with the money they receive by being a migrant woman abroad. In addition, most of the migrants (63.8 percent) point out that they use some of the remittances to finance their children education (Keban, 1999).
Since most of the research w as done in rural areas then land is becoming important production factor. Many family spent money to be invested in land. It is interesting to find out that 31,7 percent of the
Table 6
Sex Ratio of Indonesian Migrant Workers in Four Destination Countries, 1995-2000
Sex Ratio Destination
Countries 1996 1997 1998 1999 2000
Malaysia 15.2 157.3 50.4 90.0 138.3
Singapore 21.4 17.4 11.2 10.1 12.9
Taiwan 349 257.0 257.0 24.7 13.7
Saudi Arabia 3.5 7.3 8.5 8.7 10.3
migrants stated that they had their land from migrant’s salary transfer, and only 28,0 percents owned some rice field by the heritage distribution from their parents. It means remittances is the most important source to have land as part of family investment (Sukamdi, 2001).
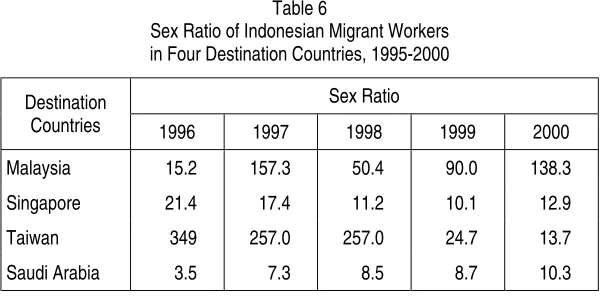
From the gender perspective, there is a changing pattern before and after the economic crisis (1995-2000). In general the Indonesian migrant workers were dominated by the women, which was shown by the sex ratio that less than 100. However there is an exception such as Taiwan during the period of 1995-1998, and Malaysia for the 1997 and 2000 that male is dominating the Indonesian worker abroad.
There are characteristics of legal Indonesian labor migration. Historically, the labor migration to Malaysia has been male-dominated but women are increasingly significant, and in recent times, there has been a relative balance (Hugo, 2002). Data shows the increasing of men and women movement as overseas contract worker, especially following the onset of the Asian economic crisis in mid-1997.
Refer en ces
Biro Pusat Statistik. 1991. Keadaan An gkatan Kerja di In don esi a: Agustus 1990. Jakarta.
---. 1994. Keadaan An gkatan Kerja di In don esi a: Agustus 1993. Jak arta.
---. 1997. Keadaan An gkatan Kerja di In don esi a: Agustus 1996. Jak arta.
Badan Pusat Statistik. 1999. Keadaan Angkatan Kerja di Indonesia: Agustus 1998. Jakarta.
---. 2000. Pengukuran Tingkat Kemiskinan di Indonesia 1976-1999: Metode BPS. Jakarta. Vol. 1.
---. 2000. Perkembangan Tingkat Kemiskinan dan Beberapa Dimensi Sosi al-Ekon omi n ya 1996-1999: Sebuah Kebi jakan Sederhan a. Jakarta. Vol. 2.
Bandiyono, Suko and Fadjri Alihar. 2000. “A review of research work on international migration in Indonesia”, in Sukamdi, Abdul Haris, Patrick Brow nlee, Labou r Mi gr ati on i n In don esi a: Poli ci es an d Pr acti ce. Yogyakarta: Population Studies Center, Gadjah Mada University, pp. 117-141.
Breman, Jan. 1999. “Krismon the Javanese desa: the dynamics of inclusion and exclusion in the reconstruction of Indonesia’s new order regime”. Workshop on the Economic Crisis and Social Security in Indonesia, Berg en Dal, The Netherlands, 7-9 January
Breman, Jan. 2000. “The impact of Asian economic crisis on work and welfare in Village Java”. Di es Natali s Address Deli vered on 12 October 2000 on the Occasi on of the 48th An n i versary of the In sti tute of Soci al
Studi es, The Hague, October 12.
Feridhanusetyawan, Tubagus. 2000. “The social impact of the Indonesian economic crisis”. A report prepared for the Thai lan d Developmen t Research In sti tute (TDRI).
Frankenberg, Elizabeth, Duncan Thomas, and Kathleen Beegle. 1999. “The Real Costs of Indonesia’s Economic Crisis: Preliminary Finding from the In don esi a Fami ly Li fe Su r veys”. Santa Monica: RAND. Labor and Population Program, Working Paper Series 99-04.
Haris, Abdul. 1997. Mobilitas Ilegal Oran g Sasak ke Malaysia Barat. Thesis S2, Program Studi Kependudukan, Program Pasca Sarjana, Universitas Gadjah Mada, Yogyakarta. Tidak diterbitkan.
Hugo, Graeme. 2002. “Efects of international migration on the family in Indonesia”. Asi an an d Pasi fi c Mi grati on Journ al 11(1):13-46.
Husken, Frans. 1999. “Crisis, w hat crisis? the village community of Gondosari during the krismon”. Workshop on the Econ omi c Cri si s an d Social Security in Indonesia, Berg en Dal, The Netherlands, 7-9 January. International Labour Office. 1997. In don esi a: Soci al Adjusmen t Soun d In dustri al Relati on s an d Labour Protecti on. Manila: South-East Asia and The Pacific Multidisciplinary Advisor Team (ILO/ SEAPAS). 2nd revision edition.
International Labour Organization. Netw ork of National Institute for Labour Studies in Asia and the Pacific. 1998. Globalization with Equity: Policies for Growth. Bangkok.
Mantra, Ida Bagoes, Kasto dan Yeremias T. Keban. 1999. Mobilitas Ten aga Kerja Indonesia ke Malaysia: Studi Kasus Flores Timur, Lombok Tengah, dan Pu lau Bawean. Yogyakarta: Pusat Penelitian Kependudukan, Universitas Gadjah Mada.
Kompas. 2002. “Menaker: tingkat pengangguran capai 36,9 juta orang” Sel asa, 28 Mei . h ttp://w w w .kom pa s.com /bi sn i s/n ew s/0205/28/ 021317.htm
Collaboration Agro Economic Foundation (YAE) and Pemda se-gugus Nusa Tenggara.
Raharto, Aswatini (ed.). 1999. Mi grasi dan Pemban gun an di Kawasan Ti mur In don esi a: Isu Keten agakerjaan . Jakarta: PPT-LIPI.
Romdiati, H., T. Handayani dan S. Rahayu. 1998. Aplikasi Jaring Pengaman Sosial Bidang Ketenagakerjaan: Beberapa Isu Penting dari Hasil Kajian Cepat di Propi n si Jawa Barat. Jakarta: PPT-LIPI.
Setiadi. 1999. Kontek s sosiok ultural migrasi internasional: k asus Lew otolok, Flores Timur. Popu lasi : Bu leti n Pen eli ti an Kebi jakan Kepen dudukan 10(2):17-38.
Soeprobo, Tara Bakti H. and Nur Hadi Wiyono. 2002. “The process of the international labor migration from Indonesia”. Semi n ar Nasi on al Isu Kebi j a ka n Gen d er d a l a m Pem ba n gu n a n , Surak arta, 17 Jul i . Diselenggarakan oleh Kementerian Koordinator Bidang Kesejahteraan Rakyat Republik Indonesia bekerja sama dengan Ford Foundation, Lembaga Demografi Fakultas Ekonomi Universitas Indonesia dan Pusat Penelitian Kependudukan (PPK), Lembaga Penelitian, Universitas Sebelas Maret.
Statistics Indonesia. 1997. Peta dan Perkembangan Kemiskinan di Indonesia [Map and Trend of Poverty in Indonesia]. Jakarta.
Statistics Indonesia. 1999. The 1998 Revi sed Poverty In ci den ce Based on the December 1998 Susen as: A Methodologi cal Issues. Jakarta.
Strauss, John et al. 2002. Stan dard Kehi dupan di In don esi a Ti ga Tahun Setelah Krisis: Hasil Survai Aspek Kehidupan Rumah Tangga Indonesia. Yogyakarta: S.A.
Sukamdi et al. 2001. “Country study 2: Indonesia”, in Christina Wille, Basia Passl (eds.), Female Labour Migration in South-East Asia: Chan ge and Continuity. Bangkok: Asian Research Centre for Migration (ARMC), Institute of Asian Studies, Chulalongkorn University, pp. 94-134.
Jakarta, November 30. Organized jointly by the Center for Statistical Services, World Bank, and SMERU.
Swasono, Yudo dan Anung Anindita. Kondisi Ketenagakerjaan pada Masa Kri si s dan Era Globali sasi . http://202.159.18.43/jsi /91yudo.htm Tamtiari, Wini. 1999. “Dampak sosial migrasi tenaga kerja ke Malaysia”.
Populasi: Buletin Pen elitian Kebijakan Kepen dudukan 10(2):39-56. Tirtosudarmo, Riw anto. 2002. “ Migrasi lintas batas negara: posisi
Indonesia, konteks politik dan perebutan ruang publik”. Lokakarya Nasi on al Mi grasi Li n tas Batas Negara dan Seksuali tas, Yogyakarta, 27 Maret. D iselenggarak an oleh Pusat Studi Kependuduk an dan Kebijakan, Universitas Gadjah Mada bekerja sama dengan Rockefeller Foundation.
Widharto, 2002. “Challenges in accessing scientific and technological information in Indonesia during the economic crisis“. American Society for Information Science: Bulletin of the American Society for Information Sci en ce 28(4):25-27, Apr/ May.