www.elsevier.com/locate/utilpol
A counterfactual price analysis of British electricity privatisation
J.R. Branston
*L’institute (Institute for Industrial Policy), Department of Commerce, Birmingham Business School, University of Birmingham, Edgbaston, Birmingham B15 2TT, UK
Received 2 February 2000; received in revised form 3 November 2000; accepted 18 January 2001
Abstract
The aim of this paper is to challenge the widely held view that electricity privatisation in Great Britain (comprised of the markets of England and Wales, and Scotland) was beneficial simply because the price of electricity has subsequently fallen in real terms. This is carried out by comparing the electricity prices actually observed with those that might have been charged had the industry remained in public ownership. In order to do this the paper develops a counterfactual scenario for the likely decisions and effects of a publicly owned industry. This leads the paper to conclude that observed prices are indeed significantly higher than they would have been had privatisation not occurred. 2001 Published by Elsevier Science Ltd.
Keywords: Electricity; Privatisation; Counterfactual price analysis
1. Introduction
There seems to be a general acceptance that electricity reorganisation and privatisation in Great Britain has been a success, simply because real electricity prices have fallen since privatisation. However, it is the contention of this paper that privatisation should not be viewed as a success for this reason, since other industry structures might have resulted in more significant price cuts.
We investigate the privatisation process in an attempt to see if it did indeed result in lower real electricity prices, or if these price cuts would have happened any-way. This is accomplished by comparing the observed electricity prices with those that might have been charged had the industry remained publicly owned. Therefore the paper develops a counterfactual scenario for the likely decisions that the publicly owned industry would have taken, drawing heavily on the existing coun-terfactual work of Yarrow (1992) and Newbery and Pol-litt (1997). The counterfactual is developed within the context of an identity, which splits the price of electricity into fossil fuel costs, profits and other costs. Each of these elements is then modelled in terms of the likely effects of a publicly owned industry.
* Tel.:+44-121-414-2639; fax:+44-121-414-6689.
E-mail address: [email protected] (J.R. Branston).
0957-1787/01/$ - see front matter2001 Published by Elsevier Science Ltd. PII: S 0 9 5 7 - 1 7 8 7 ( 0 1 ) 0 0 0 0 3 - 0
In the course of developing the counterfactual model, the paper apportions aggregate industry profits between industrial and domestic sales with some startling results. The calculations presented indicate that domestic sales account for the majority of aggregate industry profits, even though they make-up only 35% of total sales.1This
bias against the domestic consumer is also born out in the analysis of the final electricity price, which indicates that both domestic and industrial prices would have been lower had privatisation not occurred. Moreover, the results presented imply that domestic prices with privat-isation are higher by relatively more than the industrial prices, intimating that the domestic consumer has suf-fered the most from privatisation.
2. Background
Consider first a brief overview of the restructuring and privatisation process of the electricity sector in Great Britain. The British system consists of one market for England and Wales, and a separate, significantly smaller, Scottish market. Prior to reorganisation and
ation, the market in England and Wales consisted of 12 regional Area Boards who were responsible for the local distribution and supply of electricity to consumers. These Area Boards purchased electricity directly from the CEGB (Central Electricity Generating Board), which was responsible for the generation and transmission of electricity via a countrywide electricity grid.
In 1987 the government announced that it intended to restructure and privatise the industry, detailing its spe-cific proposals in a white paper published in February 1988. The CEGB was to be split up to introduce compe-tition. The nuclear stations together with 60% of the con-ventional stations were to be placed in one large com-pany (National Power), with the remaining conventional stations placed in a smaller company (PowerGen).2
However, the market proved unwilling to accept the pri-vatisation of the nuclear stations owing to the excessive costs of closing the stations once they reached the end of their operational lives. The nuclear assets were therefore transferred to a new government company (Nuclear Electric). This change occurred late in the privatisation process, so to avoid serious delays the duopoly structure of conventional generation was not changed.
The CEGB’s transmission grid was transferred to a new company (National Grid Company) and the 12 Area Boards were essentially unchanged, but were now to be known as Regional Electricity Companies (RECs). The Government viewed both the National Grid and the RECs as natural monopolies and accordingly created a new industry regulator, the Office for Electricity Regu-lation (OFFER).3 This new structure was introduced on
‘vesting day’, 31 March 1990 and was subsequently fol-lowed by privatisation of the newly created companies. In the process of restructuring the industry in England and Wales, the government also changed the way in which the market worked. The power pool was created, which was designed to secure a merit order of plant operation and act like a spot market for electricity. Elec-tricity from the pool is then sold to the RECs, who sup-ply and distribute this to their customers.
In practice the reforms to the electricity sector have not worked as was originally planned. The market for generation (especially the pool) has been dominated by the two conventional generators created from the CEGB, although significant entry by independent power pro-ducers (IPPs) has occurred. This entry has often been in partnership with RECs, who bypass the pool price by signing long-term contracts with IPPs in which they have an interest (Branston, 1999). Generation has also
wit-2 The weighted structure was chosen so that the company running the nuclear stations had the “technological and economic strength to ‘shelter’ the (risky) nuclear plants”, with the remaining capacity for-ming an ‘effective counterweight’ (Thomas, 1996a, p. 55).
3 In 1999, OFFER merged with the gas regulator to form OFGEM, the Office of Gas and Electricity markets.
nessed the so-called ‘dash for gas’, where virtually all new power stations built since privatisation have used the new and more efficient Combined Cycle Gas Turbine (CCGT) Technology. The dash for gas has caused a massive decline in the use of coal for electricity gener-ation.
The electricity system in Scotland is separate to that which exists in England and Wales, although both sys-tems are physically linked and industry reorganisation in both systems took place on the same day. Prior to privatisation two vertically integrated companies (The South of Scotland Electricity Board and the North of Scotland Hydro-Electric Board) provided all electricity services in the regions of Scotland in which they oper-ated. Reorganisation and privatisation of the industry in Scotland was less radical than that in England and Wales. The two vertically integrated companies were essentially transferred into the private sector with the only major change being that the nuclear assets were transferred into a new publicly owned company, Scottish Nuclear. Like their counterparts in England and Wales, the new Scottish electricity companies were regulated by OFFER on transmission, distribution and supply. (The nuclear assets of Britain remained in the state sector until 1996, when the newer plant was privatised as British Energy.)
The history of the British electricity sector since pri-vatisation has been one marked with progressive rounds of tighter regulation in response to increasing record pro-fits of the electricity companies and a large amount of take-over activity.4
3. Overview of some existing literature
Much has been written about the privatisation of elec-tricity, with a vast majority of the literature (implicitly) assuming that the resulting structure was beneficial. A large amount of this literature has focused on specific elements of privatisation, for example modelling the operations of the pool or the extent of competition in generation. These articles often conclude that specific elements of privatisation could have been carried out more effectively; for example competition in the pool would have increased had the CEGB’s generating capacity been split into at least five companies (Green and Newbery, 1992).5However, the focus of this
litera-ture seems to be that these flaws in privatisation have been a gain lost, rather than an outright cost. Thereby privatisation is still seen as a good thing, just that it could have been done better.
4 See Chesshire (1996) and Thomas (1996a,b) for a more compre-hensive historical account of the electricity industry.
Nevertheless there has been a limited amount of work
seeking to evaluate whether or not
privatisation/restructuring was beneficial: Yarrow (1992) uses the basic benchmark of privatisation, that of elec-tricity price, to evaluate whether the process was advan-tageous. This is carried out by comparing the actual elec-tricity prices observed with those that might have been charged had privatisation not occurred. To accomplish this, Yarrow developed a counterfactual scenario which assumes that the CEGB had not been privatised but instead the government continued with the policies it established in the 1980s.6
The counterfactual was constructed within the context of the price identity shown below:
Pt5Xt1Yt, (1)
where Pt is the relevant price (per kW h) of electricity
in year t; Yt the unit (per kW h) cost of coal inputs in
year t; and Xt comprises the unit ‘non-coal costs’ in
year t.
Yarrow accounts for the use of this identity because he believed that for the period of interest (1988–1991)7
“bulk prices of electricity have been driven by the unit costs of generation of conventional steam turbine tech-nologies”. As coal costs accounted for in excess of 80% of the CEGB total fuel costs up to early 1992, it would seem reasonable to separate out the cost of coal as a major determinant of price (Yarrow, 1992, pp. 11–12). To calculate the ‘unit cost of coal’, Yarrow uses the fol-lowing formula:
Yt5
PCt×QCt
QEt
, (2)
where Yt is the unit (per kW h) cost of coal inputs in
year t; PCtthe unit price of coal to the generators in year
t; QCtthe quantity of coal used in year t; and QEtis the
quantity of electricity supplied in year t. The counterfac-tual position developed by Yarrow is carefully explained by detailing the specific assumptions made regarding each variable, since privatisation would have affected many of the factors included.
Yarrow defines the ‘non-coal costs’ component of price in very broad terms, which means it would include all the remaining determinants such as capital costs, tax-ation, profits or labour costs. This is calculated as a residual, i.e. price minus coal costs, and so the coun-terfactual makes predictions using the observed long-term trend. This is perhaps the main weakness of the paper because this ‘non-coal costs’ element is so broad
6 In the late 1970s/1980s, the government progressively introduced the use of financial/performance targets and reduced entry barriers to encourage the development of private power stations and hence com-petitive pressures.
7 Yarrow assumes privatisation would first have had an effect when the specific details were first announced in 1988.
that it includes many unknown factors. It contains not only the residual costs of generation, but also the various factors which affect distribution, transmission and sup-ply.
The counterfactual ‘story’ for the likely CEGB actions in the absence of privatisation allows Yarrow to separ-ately calculate the two elements of price. These are then combined to find that in 1991, domestic prices are 25% higher than they would have been without privatisation (Yarrow, 1992, p. 23). The counterfactual assumptions used are well justified, but the author also develops a more ‘pessimistic’ case for ‘non-coal costs’ (owing to the large amount of unknown factors this includes) which still shows a 15.6% difference in price (Yarrow, 1992, p. 31). Both these results are used by Yarrow to undermine the supposed success of privatisation.
Newbery and Pollitt (1997) take a more complex view by attempting a comparative social cost-benefit analysis of the CEGB restructuring/privatisation process, between the years 1988 and 2010.8The main aim of the
article is to investigate the size of the efficiency gains from privatisation, although there is limited discussion about the resulting effects on price.9
To carry out such an analysis, Newbery and Pollitt need to compare the actual efficiency of the industry with that which would have existed had privatisation not taken place. They therefore develop a counterfactual position for the likely actions of the CEGB if it con-tinued in its pre-privatisation form. This takes the form of two ‘extreme’ scenarios: the ‘pro-privatisation’ case, which is pessimistic in terms of the CEGB performance and consequently favourable to privatisation; and the ‘pro-CEGB’ case, which takes a more optimistic view of the CEGB, thereby more supportive towards continued public ownership. These counterfactual positions were derived by forecasting the CEGB’s actions if it had faced the same conditions as the privatised industry. For example, the changing sulphur limits imposed by Brus-sels, or the 1991 lifting of the EC prohibition on the burning of gas in electricity generation. Since these fac-tors were not experienced by the CEGB when it was publicly owned, Newbery and Pollitt rely on evidence of CEGB’s view of the future and its plans for the 1990s. The majority of this information was presented to a com-mission of inquiry in 1990, when the CEGB proposed to construct a new nuclear station at Hinkley Point.
Newbery and Pollitt then use this counterfactual, together with predictions for the future performance of
8 2010 was chosen as the majority of the current plant will be replaced by then. This time frame has not been adopted here because of the great uncertainties in predicting future events.
the industry, to look at the various effects of restructur-ing and privatisation. Efficiency savrestructur-ings (e.g. because of lower labour use) together with changing plant mix and input costs are all modelled. They find that benefits accrue from four areas: efficiency gains in the use of inputs (offset partly by restructuring costs); the switch in fuel use and investment; and the consequential environmental benefits. The main costs arise from higher prices for imported French electricity, the cost of restruc-turing, and premature investment in new gas-fired gener-ating plant. Combining all their calculations, Newbery and Pollitt obtain a central estimate that privatisation has resulted in a permanent cost reduction of 5% per annum over continued public ownership. However, they find that these cost savings have not been passed on to the consumer in the form of lower prices, but have instead been taken as higher profits by the electricity companies. Indeed they find that it is only these companies who have benefited from privatisation, since profits have risen by more than the cost reductions made. They therefore con-clude that electricity prices in the privatised industry are higher than those predicted for the CEGB, indicating that it is the consumer who has borne the burden of the pri-vatisation process.
4. Theoretical framework
Earlier assessments of the potential costs of privatis-ation (in terms of electricity prices) indicate that there may exist substantial costs to the consumer from the restructuring and privatisation of the British electricity system. It would therefore be useful to verify this view with a more up to date analysis, especially since Newb-ery and Pollitt reach their conclusions on price move-ments as an aside to their main work. Since Yarrow’s work was written in 1992 it only includes the perform-ance of the private companies for one year. The effect on price may have substantially altered since this time. Consequently we use a modified version of the model presented by Yarrow, together with elements of the arti-cle by Newbery and Pollitt, to judge the success of pri-vatisation with respect to the price of electricity.
Since Yarrow, electricity generation in Britain has witnessed significant changes, which implies that Yar-row’s approach cannot simply be duplicated with updated data. The model must be revised to take account of the changing technologies and of the effects that the privatised companies have had on the nature of elec-tricity generation. On this basis, an approach similar to that of Yarrow’s has been used, where the cost of elec-tricity has now been split into the three components shown in Eq. (3):
Pt5Ft1Nt1Pt (3)
where Pt is the relevant price (per kW h) of electricity
in year t; Ft the ‘fossil fuel costs’ per unit (kW h) of
electricity sold in year t; Nt comprises ‘non-fossil fuel
costs’ (per kW h) in year t; and Pt the ‘profits’ (per
kW h) in year t. The price identity now includes the more general term ‘fossil fuel costs’, which replaces Yarrow’s ‘unit cost of coal’. This has been done to incor-porate the ‘dash for gas’ (and the associated changes in the mix of fossil fuels required for generation). It also provides a better estimate of overall fuel costs, since it now incorporates the use of oil in generation. ‘Profits’ have also been separated from Yarrow’s ‘non-coal costs’ so that the massive increases in profit levels after privat-isation can be explicitly modelled. This leaves the remaining factors bundled in the residual term, ‘non-fos-sil fuel costs’.
Yarrow does not model the different potential mix of fuels used to generate electricity but rather assumes that 75% of “bulk electricity produced by the generating companies was from coal-fired stations” (Yarrow, 1992, p. 17). This assumption, while reasonably valid for the time period examined, can no longer be used because of the changes that have occurred in the fuel mix used for generation. Consequently Eq. (4) uses the weighted unit costs of coal, gas and oil generated electricity to calcu-late an estimate of the cost of fossil fuels per unit of fossil fuel generated electricity. However, Eq. (4) does not take into account the electricity generated from other, non-fossil fuel sources such as nuclear or hydro. There-fore an additional equation is required to spread the costs of the fossil fuels over the total amount of electricity sold in order to calculate the cost of fossil fuels per unit of electricity sold. Eq. (6) takes account of this.
FFt5(Xt3Ct)1(Yt3Gt)1(Zt1Ot) (4)
where FFtis the fossil fuel costs per unit (kW h) of
elec-tricity sold in year t which was generated using fossil fuels; Xtthe proportion of electricity sold in year t,
gen-erated using coal; Ct the unit (per kW h) fuel cost of
coal generated electricity in year t; Yt the proportion of
electricity sold in year t, generated using gas; Gtthe unit
(per kW h) fuel cost of gas generated electricity in year
t; Ztthe proportion of electricity sold in year t, generated
using oil; and Otis the unit (per kW h) fuel cost of
elec-tricity generated using oil in year t.
To calculate the unit fuel cost of electricity generated from the different fossil fuels, the formula Yarrow used (see below) can be applied to each of the fuels:
Iit5
Pit×Qit
QEit
(5)
where Iit is the unit fuel cost of electricity generated
using fossil fuel i in year t; Pit the unit price of fuel i
in year t; Qit the quantity of the fuel i used in year t;
and QEit is the quantity of electricity generated using
not just the costs of the fossils fuels per unit of electricity generated by those fossil fuels, as was carried out in Eq. (4):
Ft5
FFt×QEFt
QETt
(6)
where Ftis the fossil fuel costs per unit (kW h) of
elec-tricity sold in year t; FFt the fossil fuel costs per unit
(kW h) of electricity sold in year t which was generated using fossil fuels; QEFtthe number of units of electricity
(kW h) sold in year t which was generated using fossil fuels; and QETt is the number of units of electricity
(kW h) sold in year t.
Eqs. (4–6) should provide a good estimate of ‘fossil fuel costs’ per unit of electricity sold, since they incor-porate virtually all the fossil fuel used. The structure of the equations also allows the changing importance of each fossil fuel to be modelled on a yearly basis.
Although the price identity is an updated version of Yarrow, the general methodology employed in this paper draws heavily upon that of both Yarrow, and Newbery and Pollitt. Following Yarrow, we look at the price of both domestic and industrial electricity and make similar assumptions regarding the CEGBs structure without pri-vatisation (i.e. further reductions in entry barriers to encourage competition, together with slightly more aggressive financial/performance targets). We also fol-low Yarrow’s assumption that the first effects of privatis-ation would be felt in the financial year 1988/1989, since the governments specific proposals had already been published by then (see Section 2). Newbery and Pollitt’s influence on this paper is mainly discernible in terms of the counterfactual developed (see next section), but a similar approach is adopted to the way in which they deal with the different domains within the electricity sec-tor.10 The focus is predominantly on generation since
this contains the most important cost drivers, while the structure of the remaining parts of the industry is gener-ally unchanged and has been subject to government regulation.11 This essentially means we concentrate on
the activities of the CEGB (and its successor companies) as this accounted for the vast majority of British gener-ation cost drivers, especially given that the Scottish mar-ket was more heavily based on nuclear and hydro gener-ated electricity (Thomas, 1996a, p. 59).
10Generation, transmission, distribution and supply.
11This line is supported by the fact that, e.g. in 1993/1994, 77% of industrial electricity cost was attributable to generation, which shows it to be by far the most important domain (Centre for The Study of Regulated Industries, The UK Electricity Industry: Financial and Operating Review, 1994/1995 edition, p. xi).
5. Counterfactual data used
In order to compare prices, a counterfactual alternative must be developed for the individual elements that form the price identity. Newbery and Pollitt present an assidu-ously developed counterfactual ‘story’ for the likely CEGB actions in the absence of privatisation. Although this paper incorporates differing assumptions and struc-ture, the paper by Newbery and Pollitt has been utilised as a foundation for the counterfactual developed here, because of the vast amount of information it contains. (NB a brief summary of the counterfactual can be seen in Appendix A.)
The data used to construct this counterfactual (and the actual data it contrasts) has been collected from several specialised publications12 and telephone interviews we
conducted with senior people within the industry. How-ever, some of the published information refers to the United Kingdom (UK) as a whole and thus is not specific to the markets of England and Wales, and Scotland (i.e. the markets that make up Great Britain). This is not a serious problem since the electricity system for Northern Ireland (the UK consists of Great Britain and Northern Ireland) is tiny in comparison to the markets of Great Britain, and so data for the UK should still provide a reasonable estimate for Great Britain.13 For example in
1998, 7174 GW h of electricity were distributed by pub-lic electricity suppliers in Northern Ireland, which is just 2.4% of the 299,387 GWh distributed in the UK as a whole (Digest of United Kingdom Energy Statistics, 1999 edition, p. 151).
5.1. Fossil fuel costs
When looking at ‘fossil fuel costs’ it is first necessary to examine the fuels used in the generation process, as this is said to be a direct consequence of the industry structure. Since privatisation, there has been a significant shift in fuel use, with the new independent CCGT plant replacing the coal fired plant of the CEGB successor
12These include: the Digest of United Kingdom Energy Statistics, and Energy trends, both published by the Department of Energy and then the DTI; Handbook of Electricity Supply Statistics, and Annual Report and Accounts, both published by the Electricity Council; Energy Prices and Taxes from the International Energy Agency; The UK Electricity Industry; Charges for Electricity Services, The UK Electricity Industry: Electricity Services and Costs, and The UK Elec-tricity Industry: Financial and Operating Review, all published by the Centre for The Study of Regulated Industries; the Statistical Yearbook from the CEGB and the Annual Report and Accounts of the priv-atised companies.
companies.14 During the Hinckley Point Enquiry the
CEGB presented its central forecast of its future power requirements. It estimated that by the end of the century 5.5 GW of ageing coal plant would need replacing (Barnes, 1990; Newbery and Pollitt, 1997). However, by 1995 more than 5.5 GW of coal plant had already been replaced by the IPP’s new gas fired plant, which had caused the premature closure of the older coal stations. Telephonic interviews carried out with senior people
within these independent companies during
January/February 1999 suggested that limited entry by IPPs might still have been possible in the absence of privatisation, if the environment were right. For this entry to take place, our interviewees indicated that the independent companies would have been looking for specific conditions, such as long-term purchase con-tracts, which are likely to have been less favourable or forthcoming under public ownership. Therefore the counterfactual developed in this paper takes the view that independent entry would have been approximately 50% of that actually witnessed under privatisation, reflecting the reduced willingness of the independents to enter.15 Thus in the counterfactual scenario there is a
lower amount of gas capacity (3.5 GW less by 1998). Consequently the retirement of ageing coal plant would have been more gradually phased in and would not have been completed until the end of the century, as was orig-inally forecast.
The analysis of capacity does not show how the assumed plant mix would be used to generate electricity, and so plant utilisation must also be modelled. One of the features of privatisation was that the utilisation of coal plant fell dramatically as independent gas fired sta-tions started to operate on long-term ‘baseload’ con-tracts, which resulted in high utilisation. These contracts distorted the marginal cost-based merit order which should determine the combination of plants to be used, as these gas plants were contracted to operate, even if they were not the cheapest plant to fulfil the demand. For example, the utilisation of coal plant fell from 54.1% in 1993/1993 to 44.8% in 1997, while the utilisation of CCGT plants rose from 60.5% in 1993/1994 to 81% in 1997. (The Digest of UK Energy Statistics, 1998 edition, Table 6.7, p. 164). Since the counterfactual assumes lower entry by IPPs, there would have been a less use of gas for ‘baseload’ operations and so the gas fired plants would have been used less intensively. In order to model plant utilisation this paper uses the established trends (both pre- and post-privatisation) to estimate the
14In dealing with this issue it has been assumed that the electricity production/capacity for nuclear, hydro, oil and imported electricity remain unchanged, because of the time taken to build a new plant and the nature of the demand these sources satisfy.
1550% has been used due to the information gained from the inter-views conducted.
rates for the counterfactual. This results in an higher util-isation of coal plants and reduced utilutil-isation for gas plants.16
To calculate ‘fossil fuel costs’ it is also necessary to make assumptions regarding the technical efficiency (i.e. the amount of fuel required to generate one unit of electricity) of the power stations, which will then allow fuel requirements to be calculated.17The observed trend
shows that there were steady improvements in the efficiency of coal fired plant from 1980 to the end of the study, with privatisation making no difference to the
trend. For example in 1987, approximately
0.000435 tonnes of coal were required to generate one unit of electricity (kW h), which had declined to 0.000419 tonnes by 1992, and 0.000396 tonnes by 1997. This indicates that the CEGB was as efficient as the priv-atised industry in terms of the technical operation of coal fired plants. A contention that is supported by Armstrong et al. (1994), who report in their conclusion: “in terms of short-run operating efficiency, the CEGB’s performance appears to have been reasonably good, except (as is now apparent) for over-staffing” (Armstrong et al., 1994, p. 320). However, since the CEGB had no CCGT stations, there is no pre-privatisation record to study, and so there are less facts to guide the counterfactual estimation of the efficiency of the gas fired stations. What is known is that the technical efficiency of CCGT fired plant is virtually unchanged during their limited period of use. This is not surprising as CCGT is a new technology and there has been little time for improvement. It might therefore be reasonably assumed that the CEGB would have run its CCGT stations with the same ability as it did with its coal stations. Consequently the counterfactual assumes that technical efficiency for both coal and gas would have been the same as that observed under privat-isation (i.e. the amount of fuel required to generate one unit of electricity is the same for the counterfactual as that actually observed).18
It is quite likely for privatisation to have an effect on the prices of coal and gas used in electricity generation,19
16When modelling utilisation it has been assumed that the total amount of electricity sold would remain the same, i.e. own price elas-ticity of electricity is zero, since simultaneous modelling of price and quantity would be prohibitively complicated due to the many effects it would have. Research conducted on the own price elasticity of demand shows that in the short run it is actually likely to be in the region of20.7 for small changes (Brenton, 1997).
17This is different from thermal efficiency, which measures the efficiency with which heat energy contained in the fuel is converted into electrical energy — see the Digest of United Kingdom Energy Statistics.
18It has been assumed that the efficiency costs to coal stations of being fitted with the additional FGD equipment required to clean emis-sions is offset by the efficiency increases derived from higher load factors (i.e. increased use).
especially because the quantities required would differ (owing to the assumptions made on the available capacity). Prior to the privatisation of electricity, the Government owned both the coal and electricity indus-tries. To protect domestic coal production, it forced the CEGB to purchase expensive British coal. However, in the 1980s government policy changed towards a more market orientated approach, which included a policy of cost reductions in order to move British coal prices more in line with world prices.
Government influence in the price of coal continued to be felt in the years immediately after privatisation. In 1990, prior to privatisation, the new upcoming compa-nies signed 3-year contracts with British Coal, which were effectively government imposed. These contracts specified large quantities of coal (only slightly lower than the quantity in 1989/1990) while continuing pre-vious government policy of gradually moving British coal to world prices continued.20The counterfactual used
in this paper assumes that the coal prices up to 1993 were the same as those actually observed, with small adjustments to take account the quantity differences.21
This approach has been chosen as it seems to represent the most likely conditions the CEGB would have faced, inasmuch as the actual price was effectively set by the government.22
Once these contracts expired, the privatised electricity companies were able to negotiate their own contracts for coal. They could now exert considerable pressure on Bri-tish Coal, as their newly constructed port capacity meant they had the viable alternative of cheaper imported coal. This resulted in a considerable gulf between what British Coal was willing to accept as reasonable and what the generators were willing to offer. The government acted as a negotiator and applied considerable pressure to reach an agreement. The contract stipulated significantly lower quantities (reflecting the reduced demand caused by the CCGT stations) while continuing the previous downward trend in the real price, which had started in the mid-1980s when the CEGB was still publicly owned. Given this government involvement, it is likely that a publicly owned CEGB would also have followed a simi-lar path. Therefore, the counterfactual in this paper uses
20Since the government had such strong links with the coal price Yarrow made the assumption that coal prices would have been the same had privatisation not occurred.
21Newbery and Pollitt use the marginal cost curve presented in the House of Commons Inquiry into the Market for Coal as a means of adjusting the price of coal for quantity changes. A similar approach has been adopted in this paper, using the cost curve presented in House of Commons (1992/1993, p. 24).
22Newbery and Pollitt in their ‘pro-CEGB’ case assume that coal costs were the same as with privatisation.
the observed price from 1994 to 1998 as a base, with appropriate adjustments for quantity differences.23
The effect of privatisation on gas price is more diffi-cult to estimate since there were no CCGT stations operating before privatisation. Newbery and Pollitt, in their ‘pro-CEGB’ case use the same price actually observed under privatisation. In their ‘pro-privatisation’ case they argue that gas prices might actually have risen by 10% without privatisation, because of the monopsony power of the CEGB deterring the rapid expansion in North Sea gas production, which is said to have resulted in the recent low gas prices. However, this does not allow for any entry by IPPs or other avenues for gas production (e.g. exports into Europe), and hence it is unlikely that the North Sea boom would be as severely affected as Newbery and Pollitt suggest.
Newbery and Pollitt’s contention is opposed by the House of Commons 1992/1993 report ‘British Energy Policy and the Market for Coal’, which partially attri-butes the ‘dash for gas’ in electricity generation to the “realisation that more gas was available at competitive prices than had previously been thought” (House of Commons, 1992/1993, point 77, pp. 46–47). This would seem to reverse the causality between the ‘dash for gas’ in the North Sea and that in the electricity generation sector, from that proposed by Newbery and Pollitt.
This argument is supported by developments in the gas market, where regulatory bodies had effectively removed British Gas’s monopoly control of the market. For example, between 1989 and 1993, 36 new gas fields were made available but only nine of these went to Bri-tish Gas (BG), the remainder going to 18 different organ-isations. Previously, new gas fields had only been brought on line when BG required them, either to replace the existing fields or to meet the extra demand within its existing markets. This had allowed BG to restrict gas supply to forecast demand, but competition has resulted in a great deal of more gas seeking buyers and hence lower prices (Parker, 1996, p. 128). Consequently it might be that the falling gas price, and its plentiful avail-ability helped to encourage the use of gas fired plant. In that case, the ownership of the power station is an inconsequential fact.
In this situation, lower entry into gas fired generation (as is assumed under the counterfactual) might lead to over supply and thus to even lower gas prices. This lower price contention might be supported by the view that monopsony buying power of the CEGB could also lead to lower prices. Therefore, in the face of such great uncertainty, the CEGB counterfactual assumes a gas
price which is the same as the one actually observed with privatisation.24
5.2. Profits
Electricity prices are generally presented in two forms: the price to domestic consumers; and the price to industrial users. Following Yarrow’s example, we use the same separation of price. However, this presents a problem because of the explicit incorporation of profits into the identity employed. The statistical data does not include the profits made from each category of sale, instead gives total industry profits.25 The profit figures
cannot be simply divided by the number of units sold each year, because this makes the implicit assumption that industrial and domestic sales generate the same pro-fit per unit. It is rather unrealistic to assume that dom-estic and industrial sales would produce the same profit per unit, given the higher levels of competition for indus-trial sales during the period of interest and the cost dif-ferences. It is therefore better to estimate explicitly the profit distribution, using the limited amount of data that is available.26(A full transcript of the calculations can
be seen in Appendix B.)
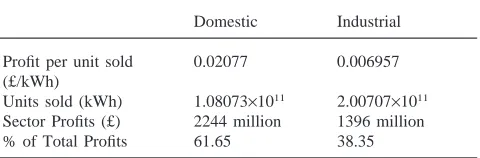
The calculations indicate that in 1993/1994, 61.65% of profits in the electricity sector were earned on dom-estic electricity sales, with only 38.35% coming from the larger industrial sector.27 This result is very significant
as it shows that domestic electricity sales provide a dis-proportionately large percentage of aggregate profits (only 35% of sales are to domestic customers). It may also indicate that the industry specific regulation has failed to protect the domestic consumer from the inter-ests of big business, if the profits on domestic electricity
24This is the same line that Newbery and Pollitt take in their ‘pro-CEGB’ counterfactual.
25We contacted several companies to get this information but they were not willing to share this confidential data.
26The calculation is based on the idea that to generate one unit of electricity costs the same irrespective of final destination. Therefore, information on the breakdown of typical industrial and domestic bills between the different domains in 1993/1994 allows the calculation of the profit differential earned in generation between the two types of sale (i.e. industrial/domestic). This profit rate was then applied to the other domains and hence the per unit profits for the two sale types can be calculated.
27Initially these calculations were carried out using the earlier infor-mation from OFFER that indicated that the market for electricity was split evenly between domestic and industrial sales. The use of this information gives the conclusion that 79.29% of profits originate in the domestic sector, with only 20.71% earned from industrial sector sales. However, these have not been used because when details of the provisional results were sent, OFFER replied with scepticism, citing as evidence ‘new’ information on the proportion of electricity sold to domestic/industrial consumers (i.e. 65% industrial, 35% domestic). This ‘new’ evidence, being the most up to date, has therefore been used in the remainder of this paper, although in either case the results are startling.
sales represent more than a reasonable return on the capital employed.
The key piece of information used to calculate this profit distribution (the breakdown of typical electricity bills) was only available for the financial year 1993/1994, when the industry was privately owned. It is most likely that this profit distribution would have been different had the industry still been publicly owned, and indeed changed over time for both the public or private industry. However, given the lack of regular information, there is no way that reasonable predictions can be made for this changing profit distribution. It has therefore been assumed that the division of profits remains at the 1993/1994 level, for all the years examined and for both the public and private industry.
Throughout the 1980s, the electricity industry in the Great Britain faced a series of financial targets which determined the individual company’s return on capital (i.e. profit). It is the position of this paper that the government would have continued with this targeting policy, setting financial targets for the CEGB, the vari-ous Area Boards, and the Scottish companies.28 In the
last few years of public ownership, these financial targets were increased significantly (e.g. in England and Wales, the target increased from a 2.7% return on assets in 1987/1988 to a 4.75% return in 1989/1990 — see Elec-tricity Council, Annual Report and Accounts, 1988/1989). Since this was a time when the industry was being prepared for privatisation, the counterfactual assumes that a target under continued public ownership would have been set slightly above those set for the per-iod in the mid-1980s. Moreover, in the later years of the counterfactual, the profit target has been increased slightly to reflect a more aggressive approach to tar-geting and the entry by IPPs, who would have the higher profit margins associated with private businesses. (It has been assumed that financial targets would be met — see Appendix A for the actual profit targets).29
The counterfactual profits estimation has resulted in the observed profits trend of the 1980s continuing into the 1990s. However, in reality profits exploded since privatis-ation. Therefore the profits predicted by the counterfactual are significantly below those actually observed.30
28The industry in England and Wales faced a joint financial target. From this, each Area Board faced its own target, reflecting the different circumstance of each, while the CEGB aimed to achieve the industry target. The two Scottish companies had a separate target.
29Newbery and Pollitt do not make any explicit predictions regard-ing yearly profits, but give a discounted figure for total profits in the time frame they use. They account for this by the continued use of the CEGB’s 1989 financial target.
5.3. Non-fossil fuel costs
The biggest element of price is what we term ‘non-fossil fuel costs’, which are determined by the multitude of factors not covered by the ‘profit’ or ‘fossil fuel costs’ terms. When analysing the actual data on privatisation, ‘non-fossil fuel costs’ are calculated as the residual of price; i.e. by subtracting ‘profits’ and ‘fossil fuel costs’ from the price. However, the counterfactual requires it to be modelled explicitly so that the estimate of the counterfactual price can be achieved. To accomplish this Yarrow simply assumes that the series would have fol-lowed the same downward trend as was observed from the mid-1980s. While this might appear reasonable up to 1991, it is unlikely that this trend would have continued unchanged, because of the large amount of variables included. We therefore examine the main constituents of this broad category, examining how each might have been altered. The nature of the elements included in this term mean there are often severe data limitations and so the established trends (both pre- and post-privatisation) are important indicators for the counterfactual.
One of the main elements expected to be included in the ‘non-fossil fuel costs’ section since privatisation, is the fossil fuel levy (FFL).31
This was a flat rate tax of around 10% on all retail sales of electricity in England and Wales, which was introduced during the industry restructuring in 1990 (it was phased out in 1996/1997 when new nuclear stations were privatised as British Energy). The exact purpose of the FFL has been the source of much confusion, with many authors and even government ministers often reporting its purpose inac-curately. The primary aim of the levy was to finance the excessive costs of nuclear generated electricity over conventionally generated electricity.32Money generated
by the FFL was paid to Nuclear Electric (NE) who treated these payments as a large component of its turn-over. The levy payments were not reserved to pay for the inherited liabilities as is widely reported (MacKerron, 1996, pp. 151–154). The Chairman of NE told the House of Commons Trade and Industry Com-mittee that “basically the Levy is taken in to add cash flow”. The finance director added that the FFL “…was specifically described as to ensure that Nuclear Electric remained cash-positive” (House of Commons, Trade and Industry Select Committee, 1992–1993, p. 62).
The majority of NEs expenditure since privatisation would have occurred regardless of whether NE received any money from the FFL: investment in plant under con-struction would have continued, whilst nuclear plants
31This does not mean that the fossil fuel levy is a cost — just some-thing that one might expect to be included in this section due to the way it is calculated as a residual.
32A very small amount of the levy was used to support energy gen-erated from renewable sources.
and waste materials would still have needed to be made safe. In this respect the only effect of the levy has been to boost Nuclear Electric’s revenue, and hence profits. The levy will therefore be included in the ‘profits’ sec-tion (since NEs profits include the levy payments) and consequentially will not be a constituent part of the ‘non-fossil fuel’ division of the privatisation scenario.
The manner in which nuclear liabilities were handled did not change following industry restructuring. As a liability became due, it was paid out of current revenue. The CEGB’s policy on the backend costs of nuclear power was that the assets were reduced in value to take account of these future costs, which were to be met from future revenues. Privatisation separated the nuclear assets from the conventional plants which were to pro-vide much of this future revenue, creating the need for the FFL. If privatisation had not occurred, there would have been no need for the levy since the backend costs of nuclear power would have been met in the planned way. Since ‘profits’ are calculated using an appropriate return on assets employed, and total costs are accounted for using the ‘fossil fuel costs’ and ‘non-fossil fuel costs’ series, the counterfactual for continued public ownership does not need to include a fossil fuel levy.
The capital costs of building the power stations (in the form of depreciation) are another important factor, since approximately 25% of the non-fuel costs of the CEGB in the 1980s were depreciation costs (Electricity Council, Handbook of Electricity Supply Statistics, vari-ous years). After privatisation, the ‘dash for gas’ resulted in the building of many new power stations which would have boosted this depreciation charge. In the counterfac-tual scenario it is assumed that there would be less new CCGT capacity (nearly 3.5G W less by 1998), which would reduce the depreciation charge, since old plant would already have been written down.33
Although the CEGB had been reducing its workforce throughout the 1980s, labour still accounted for approxi-mately 27% of the CEGB’s non-fuel costs in the 1980s (Electricity Council, Handbook of Electricity Supply Statistics, various editions). Since privatisation, the rate of job losses within the industry has increased signifi-cantly, and it is unlikely that the CEGB would have matched the privatised companies in this respect.34 We
therefore take the view that the observed CEGB trend of labour reduction in the 1980s would have continued in the absence of privatisation, with a slight increase in
33Some of the savings in depreciation charges from fewer new sta-tions would be offset by the need to install FGD emission cleaning equipment in some of the coal plants to meet emission targets.
the mid-1990s reflecting the number of IPPs and associa-ted competition.
There were significant costs associated with the whole reorganisation and privatisation process — Newbery and Pollitt estimate the cost of restructuring the CEGB at approximately £3 billion (Newbery and Pollitt, 1997, p. 291). If the industry had not been privatised these costs would not have been incurred. However, the counterfac-tual does assume that some reforms would have occurred within the public sector (e.g. more performance targets, the introduction of independently owned generating capacity) and therefore takes account of a £2 billion cost saving from not privatising.35
Clearly many other factors would be included in such a broad category, the majority of which are not known. Thus it is rather difficult to predict the effect that privat-isation had on these costs. However, some were classed by the government as being ‘non-controllable’ before privatisation, so it seems reasonable to assume that the remaining ‘non-fossil fuel costs’ would not have been significantly changed for the counterfactual (Yarrow, 1992, p. 11).36 This view is supported by the fact that
‘non-fossil fuel costs’ also include the costs of electricity generated from other sources (e.g. nuclear, imports or hydro), which have already assumed to be constant in terms of volume and price. For example the improved performance of the nuclear power industry would be included in this part of the analysis. The counterfactual assumes that this improvement would have happened even if privatisation had not occurred, since much of the improvement can be attributed to the solving of technical
Table 1
Domestic electricity prices, pence per kWh (In April 1994 VAT— Value Added Tax—was imposed on domestic electricity sales. This tax has been excluded for consistency)
Year Actuala Predicted Difference (%)
1988/1989 6.17 6.06 1.73
1989/1990 6.67 6.49 2.64
1990/1991 7.34 6.75 7.97
1991/1992 7.72 7.16 7.27
1992/1993 7.70 7.09 7.92
1993/1994 7.50 6.73 10.29
1994/1995 7.46 6.31 15.47
1995/1996 7.44 6.27 15.70
1996/1997 7.14 5.68 20.51
1997/1998 6.94 6.13 11.64
aSource: International Energy Agency, Energy Prices and Taxes, various issues.
35This is a very conservative estimate of the cost savings that would have been achieved, but detailed information on the costs of privatis-ation was not available and hence a conservative figure was taken.
36Some costs would have risen but these might be offset by the cost elements that had fallen.
problems and the nuclear part of the industry was in pub-lic ownership for much of this improvement.37
6. Results
Combining the various elements of the counterfactual with Eqs. (3–6), allows us to estimate the predicted elec-tricity prices for continued public ownership.
6.1. Domestic prices
Table 1 shows that privatisation has led to significant increases in the price of domestic electricity compared with those predicted for continued public ownership. Consumers have been paying significantly higher prices since 1988/1989, which indicates that the privatisation process has had a large cumulative cost (in terms of price) to domestic consumers.
The size of the difference is particularly interesting because it suggests that the results presented in Yarrow’s paper over-estimated the price-increasing effect of pri-vatisation. For example, Yarrow projected that without privatisation, domestic electricity prices would have been 25% lower in 1991 (Yarrow, 1992, p. 23). The results in this paper estimate the cost for 1990/1991 at only 7.97%. Moreover, Yarrow’s less optimistic coun-terfactual estimates the cost at only 15.6%, which are still significantly higher than this paper has found (Yarrow, 1992, p. 31). Another interesting observation is that the price differential peaks in 1996/1997 and starts to fall after this time. This is because the actual price of domestic electricity continued its downward
Table 2
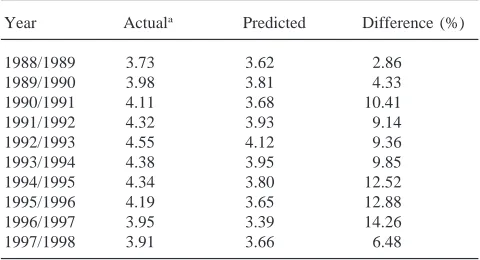
Industrial electricity prices, pence per kWh
Year Actuala Predicted Difference (%)
1988/1989 3.73 3.62 2.86
1989/1990 3.98 3.81 4.33
1990/1991 4.11 3.68 10.41
1991/1992 4.32 3.93 9.14
1992/1993 4.55 4.12 9.36
1993/1994 4.38 3.95 9.85
1994/1995 4.34 3.80 12.52
1995/1996 4.19 3.65 12.88
1996/1997 3.95 3.39 14.26
1997/1998 3.91 3.66 6.48
a Source: International Energy Agency, Energy Prices and Taxes, various issues.
trend, while the predicted price of electricity actually broke its downward trend and started to rise. Neverthe-less with a difference still in the region of 11.64% in 1997/1998, the results show that privatisation has had a substantial negative impact on consumer prices.
The results presented above (and in the rest of this section) are nominal prices. A second set of results were calculated using real prices, but these are not presented in this section because the nature of the results was not altered. The aim of this paper is to give an indication of the relative changes in prices caused by privatisation. To present results using real prices might imply a level of accuracy in terms of the absolute level of real prices, which would be unwise given the nature of the method-ology employed.
6.2. Industrial prices
Industrial electricity prices show a similar story to domestic prices although the price differential is lower (Table 2).
It is interesting to note that the difference between the actual and predicted price in the industrial sector has a flatter distribution than domestic prices, peaking at only 14.26% compared with 20.51% for domestic prices. This might reflect the fact that the market to supply large users was open to competition from the beginning, reducing the market power of individual firms. The results for industrial prices are closer to those of Yar-row’s preferred counterfactual. For example, YarYar-row’s main prediction is that industrial prices would be 18.9% lower in 1991 (Yarrow, 1992, p. 23), while his alterna-tive set of results indicated they would be 7.9% lower (Yarrow, 1992, p. 31). Table 2 shows that our model predicts that industrial prices would have been 10.41% lower in the 1990/1991. It is also interesting to observe that the price differential peaks in 1996/1997, the same year as the peak in the domestic price differential. The price differential has also fallen substantially in 1997/1998, to 6.48%, which is nevertheless a significant amount. The predicted figure for 1990/1991 seems to dip in comparison to the surrounding years, which leads to an unexpectedly large differential. The reason behind this is a dip in the ‘non-fossil fuel costs’ and the cause appears to be a quirk of the methodology and its interpretation of events.
6.3. Price ratio
It is also interesting to compare the ratio of industrial to domestic prices, as this shows how privatisation has affected the relative price of electricity, and thus which group bore the most burden (Table 3).
The predicted results follow roughly the same pattern as was actually observed under privatisation; i.e. indus-trial price falls in proportion to the domestic price. It is
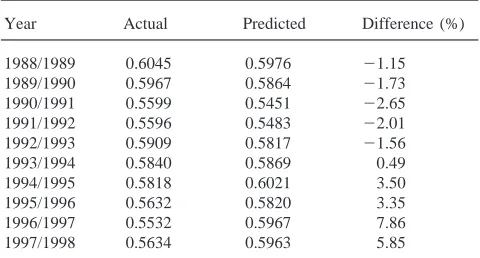
Table 3
Ratio of industrial to domestic prices (i.e. industrial/domestic price; domestic prices exclude the effect of VAT which was imposed in April 1994 on domestic electricity sales)
Year Actual Predicted Difference (%) 1988/1989 0.6045 0.5976 21.15 1989/1990 0.5967 0.5864 21.73 1990/1991 0.5599 0.5451 22.65 1991/1992 0.5596 0.5483 22.01 1992/1993 0.5909 0.5817 21.56
1993/1994 0.5840 0.5869 0.49
1994/1995 0.5818 0.6021 3.50
1995/1996 0.5632 0.5820 3.35
1996/1997 0.5532 0.5967 7.86
1997/1998 0.5634 0.5963 5.85
interesting to note that the predicted ratio is slightly below the actual ratio for the first half of the period of interest, although it closely follows the general pattern actually observed. This indicates that the predicted series has lower industrial prices relative to domestic prices than were actually observed. After the first few years following privatisation, the pattern is reversed so the actual ratio shows industrial prices falling relative to domestic prices, whilst the predicted series suggests that relative prices would remain roughly constant. These results indicate that domestic consumers suffered the most from privatisation, since the price they faced increased by relatively more than industrial prices. This is consistent with the structure of privatisation, as it cre-ated a competitive market to supply larger (industrial) consumers but retained the Area Boards’ local monopoly over supply to small (domestic) consumers during the period of interest.
6.4. Sensitivity analysis
(N.B. a brief summary of the key differences of the ‘pessimistic’ and ‘optimistic’ counterfactuals can be seen in Appendices C and D, respectively.)
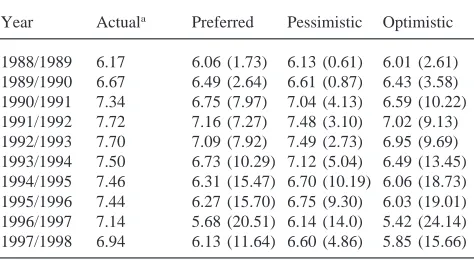
Table 4 shows that differing assumptions within the counterfactual can produce substantial differences in the results. The contrasting extreme counterfactuals show a similar trend and distribution to the author’s preferred counterfactual, without changing the indication of the results. The main difference between the series is the size of the differential achieved during the period of interest.
However, by calculating this analysis of the domestic price, we have illustrated that even when using an extremely pessimistic view of possible CEGB perform-ance, prices in the privatised industry would seem sig-nificantly higher than those that might have been charged by a publicly owned industry. Indeed, the extremely optimistic series shows the differences to peak at a mass-ive 24.14% in 1996/1997, although the results of the pre-ferred series (e.g. 20.51% for 1996/1997) are favoured by the author. A similar sensitivity analysis was also conducted on industrial electricity prices, but this showed similar results to the analysis on domestic prices and so was felt to be of little value.
6.5. The future
The results presented above indicate that the differen-tial between actual prices and those predicated for the counterfactual narrowed in the last year of the study. We believe that it is likely that this process would continue after the sample period for a number of reasons. The price controls for the years after the study are signifi-cantly stronger than those imposed in the early part of the 1990s, which should ensure that the actual price of electricity continues to fall. In addition, in September 1998 the market for electricity supply was fully opened
Table 4
Domestic Electricity Price Counterfactual Comparisons (in pence per kWh — % difference to actual in parentheses; prices exclude the effect of VAT which was imposed in April 1994 on domestic electricity sales)
Year Actuala Preferred Pessimistic Optimistic 1988/1989 6.17 6.06 (1.73) 6.13 (0.61) 6.01 (2.61) 1989/1990 6.67 6.49 (2.64) 6.61 (0.87) 6.43 (3.58) 1990/1991 7.34 6.75 (7.97) 7.04 (4.13) 6.59 (10.22) 1991/1992 7.72 7.16 (7.27) 7.48 (3.10) 7.02 (9.13) 1992/1993 7.70 7.09 (7.92) 7.49 (2.73) 6.95 (9.69) 1993/1994 7.50 6.73 (10.29) 7.12 (5.04) 6.49 (13.45) 1994/1995 7.46 6.31 (15.47) 6.70 (10.19) 6.06 (18.73) 1995/1996 7.44 6.27 (15.70) 6.75 (9.30) 6.03 (19.01) 1996/1997 7.14 5.68 (20.51) 6.14 (14.0) 5.42 (24.14) 1997/1998 6.94 6.13 (11.64) 6.60 (4.86) 5.85 (15.66) aSource: International Energy Agency, Energy Prices and Taxes, various issues.
to competition (OFFER, 1998, p. 17), which should pro-vide additional downward pressure on actual electricity prices in future years. The counterfactual price of elec-tricity might be expected to fare less well since some of the older coal fired stations would have to be replaced with new gas fired plant. It would therefore be expected that the actual price of electricity will decline relative to the price that might be charged by a publicly owned industry. Indeed, it is not unlikely that the situation will be reversed, and that the privatised industry would pro-vide the cheaper electricity.
7. Concluding comments
By concentrating on price alone, this paper restricts its analysis to consumer surplus, while welfare as a whole is constituted by consumer and producer surplus. Since it has been assumed that the amount of electricity sold remains the same (i.e. own price elasticity of electricity is zero), the effect of privatisation has been to reduce consumer surplus while the effect on producer surplus, and hence total surplus, is indeterminate. However, it is observed that profits have increased dramatically since privatisation, while at the same time a significant part of the industry has been sold to foreign utility companies, transferring a notable amount of these profits out of the country. When the producers were domestically owned, some of the profits and hence producer surplus would be transferred back to the consumer in the form of divid-ends, but now any dividends would accrue to the foreign owners.
The result might have been different had we not assumed that the own price elasticity of electricity was zero, but instead allowed both price and quantity to vary. For example Brenton’s (1997) estimate of an elasticity of20.7 for rich countries, together with decreased dom-estic prices of 20.51% (1996/1997) would have resulted in demand increasing by 14.36%.38This changing price
and demand would clearly have affected the size of total surplus and thus would have given a better indication of the desirability of privatisation.
This paper also concentrates entirely on the electricity sector when evaluating privatisation and thus does not take into account any spill-over effects on other markets. For example, electricity privatisation has had a consider-able impact on the British coal mining industry, since it has caused a precipitous decline that might otherwise have been avoided. Therefore electricity prices should only be one element of a wider picture when analysing the success or failure of privatisation.
However, despite their limited scope, the results
presented clearly indicate that privatisation may well have resulted in prices that are significantly in excess of the prices that might have been charged with continued public ownership. This would imply that privatisation has failed to live-up to the promises of successive governments, who have stated that consumers have ben-efited from this process. Indeed the results also intimate that it is the domestic consumers who have born the heaviest burden, since they have endured the higher rela-tive price rises. This bias is also borne out in the paper’s analysis of industry profits, which reveals that sales to domestic consumers account for 61.65% of total profits but only 35% of sales.
Since electricity prices appear to have been ‘excess-ive’ since the late 1980s, the cumulative cost to both consumer groups of this privatisation inadequacy is sig-nificant. Calculations using the results presented indicate that by 1997/1998 consumers have paid an additional £16,134 million in electricity charges.39 It would seem
that the cause of these high prices can be broadly attri-buted to the specific structure of privatisation and the subsequent operation of the market it created.
8. Glossary
BG British Gas
CCGT Combined Cycle Gas Turbine
CEGB Central Electricity Generating Board
FFL Fossil Fuel Levy
IPP Independent Power Producer
NE Nuclear Electric
NP National Power
OFFER Office Of Electricity Regulation OFGEM Office of Gas and Electricity Markets
PG PowerGen
REC Regional Electricity Company
VAT Value Added Tax A tax of 8% imposed on domestic electricity sales in April 1994.
Acknowledgements
This paper has in part been drawn from work started while at the University of Warwick, which was done under the supervision of Keith Cowling. I am grateful to him and to my supervisor at L’institute, Roger Sugden, for their many helpful comments and
sugges-39This figure is calculated by using the yearly price differential indi-cated by the preferred counterfactual series multiplied by the amount of electricity sold in each year.
tions. I am indebted to Colin Rickwood for his help in deciphering the company accounts. I would also like to thank James R. Wilson, the participants at a Young Researchers’ Workshop at the University of Birmingham and at the 26th EARIE conference in Turin, for their comments. The responsibility for errors, however, is entirely my own.
Appendix A. A summary of the key counterfactual assumptions used in this paper
A.1. General
O CEGB structure as before privatisation with further reductions in entry barriers and use of slightly more aggressive financial/performance targets.
A.2. Fossil-fuel costs
O Capacity of coal and gas the only fuels to be affected by privatisation.
O Less new gas capacity constructed (as entry by IPPs 50% lower) and older coal capacity utilised for longer—results in nearly 3.5 GW lower gas capacity by 1998.
O Gas capacity utilised less intensively and coal used more intensively than with privatisation, resulting in a larger share for coal generated electricity.
O Coal prices assumed to be the same, with small adjustments reflecting the different quantities pur-chased.
O Gas and Oil prices assumed to be the same.
O All generation plant assumed to operate with the same efficiency levels, in terms of the quantity of fuel required to generate one unit of electricity.
A.3. Profits
O Industry profits divided 61.65% to domestic and 38.35% to industrial. This is assumed constant over the period of interest for the both the counterfactual and the actual results.
A.4. Non fossil-fuel costs
O No fossil fuel levy in the counterfactual—decom-missioning paid out of future income.
O Savings in capital costs from 1993/94 to 1997/98 reflecting the lower amounts of new gas capacity.
O Labour costs higher due to slower reductions in the workforce.
O Cost savings from not privatising the industry—sav-ings of £2000m taken over the years 1988/89 to 1990/91.
Appendix B. The breakdown of profit between industrial and domestic sales
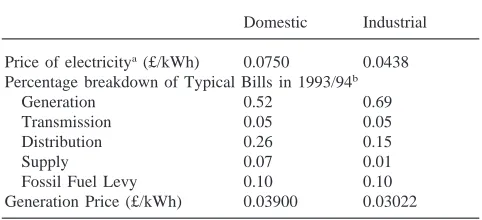
See Table 5. Using the final price of electricity and the proportion of this accounted for by the generation companies, allows the generation price to be calculated. This is the amount of money that is passed to the gener-ators per unit of electricity sold.
(Generation price = Price of electricity ×Proportion of the bill that goes to the generators)
Assuming each unit (kWh) costs the same to generate, then the difference between the two generation prices will be the additional profits that domestic electricity sales make over industrial sales for the generation com-panies.
Additional profit from domestic sales
= domestic generation price—industrial generation price
=0.0390–0.03022
=0.00878 (£/kWh)
This means that 22.51% of the generation price for
dom-Table 5
The price of electricity and the breakdown of typical bills in 1993/94 Domestic Industrial Price of electricitya(£/kWh) 0.0750 0.0438 Percentage breakdown of Typical Bills in 1993/94b
Generation 0.52 0.69
Transmission 0.05 0.05
Distribution 0.26 0.15
Supply 0.07 0.01
Fossil Fuel Levy 0.10 0.10
Generation Price (£/kWh) 0.03900 0.03022 aInternational Energy Agency, Energy Prices and Taxes, 1999, First Quarter Edition.
b Centre for the Study of Regulated Industries, The UK Electricity Industry: Electricity Services and Costs, 1994/95 edition, Table 2, p. xi.
estic electricity is additional profits (i.e. [0.00878/0.03900] ×100)
Assuming the mark-up is the same for all electricity sectors, not just generation, then additional profit on 1 kWh of electricity sold to the domestic sector is given by:
Additional Profit per unit =Unit Price ×Profit Rate
However, the final price quoted above includes the fossil
fuel levy, which accounts for 10% of the final price (see
table); this will not have generated industry profits and so should be excluded from the profit calculations at this point. Therefore
Unit Price
= Bill price × Proportion accounted for by elec-tricity firms
=0.0750 ×0.9
=0.06136
thus
Additional Profit per unit
=0.06136×0.2251
=0.01381 (£/kWh)
Since domestic electricity accounts for approximately 35% of electricity sold, total additional profits on dom-estic electricity sales can be calculated by multiplying the additional profit per kWh by the number sold to dom-estic users, i.e.
Domestic sales
=0.35 ×Total Sales
=0.35 ×(3.0878 ×1011)
=1.08073×10¹¹
Additional Profits in domestic sector
=Additional Profit per unit × Domestic Sales
=0.01381×(1.08073 × 1011)
=£1,493 million
This therefore leaves profits of £2 148 193 987.73 (see below) unaccounted for by the difference between dom-estic and industrial profit rates. This must be the profits earned equally on all units of electricity sold. i.e.
Base profits
= Total profits—additional profits in the domestic sector
=£3641 million–£1493 million
=£2148 million
Table 6
1993/94 electricity sector profits, broken down by class of sale Domestic Industrial Profit per unit sold 0.02077 0.006957 (£/kWh)
Units sold (kWh) 1.08073×10¹¹ 2.00707×10¹¹ Sector Profits (£) 2244 million 1396 million % of Total Profits 61.65 38.35
sold (since the differential between the two types of sales has already been accounted for).
Base profits per unit
=Base profits/Units sold
=£2148 million/3.0878 ×1011
=0.00696 (£/kWh)
Therefore total profits per unit sold in 1993/94 are:
Domestic
=Base Profits +additional domestic profits
=0.006957+0.01381
=0.02077 (£/kWh) Industrial
=Base Profits
=0.006957 (£/kWh)
Combining the above information allows the distribution of industry profits (see Table 6).
Appendix C. A summary of the key assumptions used in the ‘pessimistic’ counterfactual
As the Preferred Counterfactual as outlined in Appen-dix A except
C.1. Fossil-fuel costs
O From 1990/91, coal prices 5% higher than those assumed under the preferred counterfactual (and actu-ally observed).
O From 1990/91, gas prices 10% higher than those assumed under the preferred counterfactual (and actu-ally observed).
C.2. Profits
O Profits continue with the financial targets for the return on current cost (CC) assets (CC assets are taken to be the same as the ones actually observed). Indus-try target for England and Wales of 3% return from 1988/89 to 1989/90, 3.75% from 1990/91 to 1991/92,
4.25% from 1992/93 to 1994/95 and 4.75% 1995/96 to 1997/98.
O Target for Scotland of 2.7% for 1988/89, 3% for 1989/90, 3.25% from 1990/91 to 1992/93 and 3.75% from 1993/94 to 1997/98.
C.3. Non fossil-fuel costs
O Savings in capital costs from 1993/94 to 1997/98 reflecting the lower amounts of new gas capacity. Assumed to be the same as under the preferred coun-terfactual.
O Additional £750 m charge applied evenly from 1991/92 until 1997/98 for general higher costs of operation and other inefficiencies.
O Labour costs higher due to slower reductions in the workforce. By 1997/98 10% higher cost increase than that assumed under preferred counterfactual.
O Cost savings from not privatising the industry—sav-ings of £2150 m taken over the years 1988/89 to 1990/91.
Appendix D. A summary of the key assumptions used in the ‘optimistic’ counterfactual
As the Preferred Counterfactual as outlined in Appen-dix A except
D.1. Fossil-fuel costs
O From 1990/91, coal prices 5% lower than those assumed under the preferred counterfactual (and those actually observed).
O From 1990/91, gas prices 10% lower than those assumed under the preferred counterfactual (and those actually observed).
D.2. Profits
O Profits continue with the financial targets for the return on current cost (CC) assets (CC assets are taken to be the same as the ones actually observed). Indus-try target for England and Wales of 2.7% return from 1988/89 to 1997/98.
O Target for Scotland of 2.7% from 1988/89 to 1997/98.
D.3. Non fossil-fuel costs