Substrate heterogeneity and microfauna in soil organic ‘hotspots’ as
determinants of nitrogen capture and growth of ryegrass
Michael Bonkowski
a,∗, Bryan Griffiths
b, Charles Scrimgeour
caAbt. Ökologie, Institut für Zoologie und Anthropologie, Universität Göttingen, Berliner Str. 28, 37073 Göttingen, Germany bSoil-Plant Dynamics Unit, Scottish Crop Research Institute, Invergowrie, Dundee, DD2 5DA, UK
cChemistry Unit, Scottish Crop Research Institute, Invergowrie, Dundee, DD2 5DA, UK
Received 17 June 1999; received in revised form 28 September 1999; accepted 30 September 1999
Abstract
In this study we simultaneously manipulated the patchiness of complex organic resources and the composition of microfaunal populations (protozoa and nematodes) in soil, to influence microbial mineralization processes and to elucidate the underlying mechanisms of nutrient acquisition from decomposing plant residues by ryegrass plants.
Hotspot treatments of decreasing patchiness were established by filling laboratory microcosms with defaunated soil and adding labelled (13C,15N) grass residues as 1-layer, 4-layer or completely mixed within the soil. Microfaunal treatments were
set up by inoculation of the soil with either protozoa or bacterivorous nematodes, a combination of both or neither (control). The microcosms were planted with surface sterile ryegrass seedlings.
Growth of ryegrass plants was enhanced by both, increasing patchiness of the organic matter in soil (1-layer > 4-layer > mixed) and microfloral–microfaunal interactions (protozoa+nematodes=protozoa > nematodes > control). The presence of micro-fauna enhanced the decomposition of hotspot material. Protozoan grazing in particular increased the availability of N in soil and leaching water and led to a concomitant increase in plant growth. While root foraging in organic hotspots enhanced the spatial coupling of mineralization and plant uptake, microfaunal grazing increased the temporal coupling of nutrient release and plant uptake. Consequently the greatest plant biomass was found in treatments combining aggregation of organic material in patches and the presence of microfauna. ©2000 Elsevier Science B.V. All rights reserved.
Keywords: Decomposition;13C/15N dynamics; Nematodes; Plant nutrition; Protozoa; Substrate distribution
1. Introduction
Modern farming practice relies on high fertilizer in-puts to ensure high rates of nutrient capture by crops. However, there are increasing concerns due to high nutrient losses, especially of nitrogen and its nega-tive consequences to the environment (Byrnes, 1990; Addiscott et al., 1991). Therefore, the knowledge of
∗Corresponding author. Present address: Centre d’Ecologie Fonctionnelle et Evolutive (C.N.R.S.- U.P.R. 9056), 1919 Route de Mende, 34293 Montpellier Cedex 5, France.
processes that regulate nutrient release and plant up-take in soil is an essential prerequisite for sustainable agricultural management.
Even though detailed studies on the mineral nu-trition of plants under controlled conditions have re-vealed exact knowledge of the chemical balances of plant nutrients in water culture systems, efforts to translate this knowledge to soil systems fail to predict element fluxes in the rhizosphere. It is essential to ap-preciate that in soil most nutrients are bound in organic form and the amount of nutrients available for plant growth depends on complex interactions between plant
roots, microorganisms and soil animals. In addition, the distribution of nutrients in soil often is hetero-geneous. Consequently, plants have evolved specific strategies, such as ‘root foraging’ (Hutchings and de Kroon, 1994; Robinson, 1994) to exploit nutrient rich ‘hotspots’ in soil. However, as an organic hotspot is degraded and nutrients made available from it by mi-crobial extracellular decomposition, element uptake by plants is simultaneously accompanied by severe competition for available nutrients with the microbial community. Although the mechanisms are still poorly understood, it is generally accepted that microorgan-isms are superior competitors (Hayman, 1975; New-man, 1985; Jackson et al., 1989; Chang et al., 1997; Wang and Bakken, 1997a,b) and microfaunal grazing is required to enhance significantly microbial turnover and subsequently the release of nutrients for plant up-take (Coleman et al., 1984; Gerhardson and Clarholm, 1986; Ritz and Griffiths, 1987; Griffiths, 1994; Zwart et al., 1994).
Only little is known about biological processes regulating microbial decomposition and plant uptake of mineralized N. We hypothesized that the sup-posed mechanism of root foraging by plants would be most effective where organic matter is aggregated in patches, but inefficient where organic matter was homogeneously mixed with the soil. In addition, we expected a high microbial activity on the freshly decomposing organic matter with microfaunal graz-ing increasgraz-ing microbial turnover and subsequently the release of nutrients for plant growth. Therefore, in our experiment we simultaneously manipulated both the patchiness of organic resources in soil and microfaunal–microfloral interactions in order to influ-ence subsequent microbial mineralization processes and to elucidate the underlying mechanisms of nutri-ent acquisition by ryegrass plants.
2. Materials and methods
2.1. Microcosms
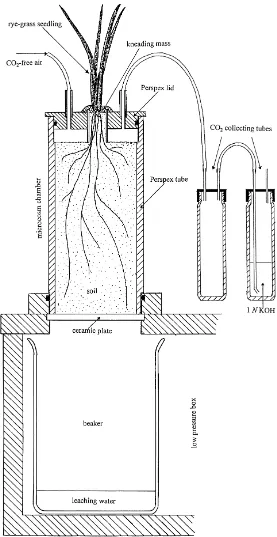
Laboratory microcosms based on those described by Wolters (1989) and Scheu (1989), with modified
lids for CO2collection, were used in this experiment.
The microcosm chambers consisted of perspex tubes (150 mm height, 60 mm diam) which were placed on
ceramic plates. The chambers could be drained under natural conditions of soil matric potential by lowering the atmospheric pressure in a box below the plates (Fig. 1).
The chambers were filled with experimental soil to
a depth of 140 mm, leaving an air-space of ca. 30 cm3,
and each planted with a single, sterile Lolium perenne L. seedling (as described further). The stem of the seedling was led through a central hole (10 mm diam) in the lid of the chamber and sealed with knead-ing mass (Teroson, Teroson GmbH, Heidelberg, Ger-many). The lids thus separated the soil and rhizosphere atmosphere from the shoot. Tubes on the lid allowed watering and were connected to a continuous air-flow
system for aeration and to trap respired CO2 from
soil in order to follow decomposition processes from labelled organic material and root respiration in the rhizosphere.
Air was pumped through a gas washing flask
con-taining 2M KOH to remove CO2, then through
an-other flask containing sterile demineralized water, and subsequently led into a dispersal system connecting all experimental chambers. A constant low air-flow
of 6 ml min−1 was passed through individual
micro-cosms, and led through a separate gas washing tube
containing 5 ml 1M KOH to trap the CO2 resulting
from soil and rhizosphere respiration. Alkali solution
was changed at regular intervals and evolution of CO2
was determined titrimetrically from 0.5 ml aliquots
(Macfadyen, 1970). In addition,13CO2was analysed
from 1 ml of the alkali solution, as described further.
2.2. Soil, hotspot and microfauna
Garden soil (0.2% N, 3.1% C), collected at the wall-garden of the University of York, UK, in May 1997 was defaunated with chloroform (Alphei and Scheu, 1993) and mixed with autoclaved sand (1 : 1)
giv-ing a low nutrient soil (0.1% N, 0.4 at.%15N, 1.5%
C, 1.08 at.% 13C). The soil was kept in darkness at
room-temperature until use, and is the same soil used in hotspot studies by Hodge et al. (1998).
When the microcosms were being filled with soil, air-dried, defaunated (by chloroform fumigation) and
chopped, labelled (13C, 15N) plant material of L.
ryegrass shoots (1.9% N, 48.6 at.% 15N, 41.2% C,
2.8 at.%13C, C/N 21.8) and 0.83 g dry ryegrass roots
(0.4% N, 33.6 at.%15N, 43.6% C, 1.7 at.%13C, C/N
11.0) as hotspot material, giving an overall
com-position of the hotspot of 27.4 mg N, 12.5 mg 15N,
885 mg C and 21 mg 13C. The hotspot was added
as three treatments of increasing patchiness: (i) or-ganic substrate homogeneously mixed into the soil (mix), (ii) organic substrate in four evenly spaced layers in the soil column (4-layer), (iii) organic sub-strate in one layer in the center of the soil column (1-layer).
Protozoa (naked amoebae, flagellates, ciliates) were isolated from the experimental soil and cultured in Petri dishes in sterile nutrient broth (NB, Oxoid, UK) in Neff’s Modified Amoebae Saline (NMAS, Page, 1976) at 1 : 9 v : v, with Escherischia coli OP50 and native soil bacteria as food source. Nematodes were isolated from a permanent pasture on a clay-loam soil near the Scottish Crop Research Institute. To obtain protozoa-free cultures, single nematode specimens were washed in sterile NMAS and transferred to Petri dishes containing 1% agar in NB-NMAS streaked with E. coli OP50 as food source. The nematode cul-tures consisted mainly of the bacterial feeding species Coactadera cystilarva and Panagrolaimus spp. Pro-tozoa and nematodes were added to the experimental soil within a 2 ml suspension of their culture fluid. Control treatments received the same amount of cul-ture fluid, rendered fauna-free by filtration through a
4mm filter.
2.3. Experimental design
The experimental design was two-factorial with different hotspot and faunal treatments. The hotspot treatments were (1) labelled organic substrate ho-mogeneously mixed in soil (mix), (2) soil with the same amount of labelled substrate in four equal layers (4-layer) in the soil column, each layer sepa-rated by ca. 2.5–3 cm soil, (3) same amount of sub-strate in one layer in the middle of the soil column (1-layer).
The faunal treatments were (1) soil without
micro-fauna (demicro-faunated soil+filtered culture fluid) as
con-trol (Ctrl), (2) soil inoculated with nematodes (Nema), (3) soil inoculated with protozoa (Prot), (4) soil
inocu-lated with nematodes and protozoa (N×P). This gave
3×4 treatments with four replicates of each, resulting
in 48 microcosms.
Seeds of perennial ryegrass (L. perenne) were sur-face sterilized by washing with 96% ethanol for 2 min and 5% calcium hypochloride for 5 min under
vac-uum (−1 atm) (Hensel et al., 1990). The seeds were
kept separately until germination in 96-well microtiter
plates in 100ml NB-NMAS and checked for sterility.
Sterile seedlings were transferred in cylindrical per-spex tubes (10 mm height, 10 mm diam) filled with de-faunated soil and grown for 1 week (average biomass
0.007±0.003 g dry wt) before being transferred into
the microcosms. The perspex tubes, leading through the microcosm lid and the air-gap, connected the plants with the soil surface (Fig. 1).
The microcosms were kept in a greenhouse
main-tained at 20◦C for 16 h with supplementary sodium
lighting (day), and at 15◦C for 8 h with no
supple-mentary lighting (night). The chambers were watered with 20 ml of sterile deionized tap water every 2 days.
Leachate was sucked off regularly and stored at−20◦C
before analysis.
2.4. Analyses
A first harvest of the plants was carried out af-ter 4 weeks when the shoots (shoot-1) were all cut 5 cm above the level of the chamber lid. The final har-vest was carried out 2 weeks later when the shoots had regrown to their previous height. Harvested plants were separated into roots, shoot base (shoot up to 5 cm from the roots), shoot-1 (shoots sampled at first harvest) and shoot-2 (shoots sampled after 2 weeks regrowth).
Roots were washed from adhering soil and hotspot material. The maximal root length, number of main and lateral roots in 5 cm intervals from the base to the root tip, maximum shoot length and number of shoots at the shoot base were counted. The plant
ma-terial was dried at 60◦C for 24 h, milled and
anal-ysed for 14C/13C- and14N/15N-content by
continu-ous flow isotope ratio mass spectrometry (CF-IRMS) using a Europa Scientific ANCA-NT 20-20 Stable Iso-tope Analyser with ANCA-NT Solid/Liquid Prepara-tion Module. This was operated in the dual isotope
simul-taneously on the same sample. After separation of the roots, the remaining soil and hotspot material of each
microcosm was mixed thoroughly and stored at 5◦C
for further analysis.
At the end of the experiment concentrations of
mineral N (NH4+, NO3−) in the pooled leachate
were determined in a segmented flow autoanalyser (Skalar Analytical, Breda, The Netherlands). The
amount of leached 15N and 13C was determined
from 3 ml of freeze dried soil water analysed by CF-IRMS.
Microbial biomass C was determined by the chloroform fumigation-extraction technique (Vance et al., 1987; Ritz et al., 1992). Samples of fresh soil (10 g dry wt) were fumigated with ethanol-free
chloroform for 24 h at 25◦C, whilst control
sam-ples were stored at 5◦C. After removal of the
chlo-roform, soils were extracted with 40 ml 1M KCl on a roller bed (Wheatley et al., 1989), followed
by centrifugation (2500×g for 10 min) and
filtra-tion through a Whatman GF/F filter. The filtrate was analysed after digestion with UV radiation in
a segmented flow autoanalyser. Amounts of NH4+
and NO3− absorbed in the soil matrix were
de-termined in KCl extracts from non-fumigated soil samples.
Total numbers of protozoans (i.e., active and en-cysted forms) were enumerated by a most probable number technique (Darbyshire et al., 1974) in which 5 g soil were dispersed in 50 ml NMAS on a rollerbed
for 20 min. 8×0.1 ml aliquots were added to
mi-crotitre plates and diluted twofold in 50ml sterile
NB-NMAS. The microtitre plates were incubated at
15◦C and the flagellates, ciliates and amoebae were
counted after 4, 7, 10, 14 and 21 days. Numbers were calculated according to Hurley and Roscoe (1983). The remaining soil suspension was fixed with formaldehyde (8% final concentration) and used for nematode extraction by flotation in colloidal silica (Griffiths et al., 1990).
2.5. Statistical analyses
The two-factorial design with hotspot (1-layer,
4-layer, mix) and soil fauna (Ctrl, Nema, Prot, N×P)
treatments was analysed using the SAS software (SAS Institute Inc., 1993). A factorial ANOVA was
performed to test for significance between means of hotspot and fauna treatments. Comparison of the means for the individual treatments was done at the 5% probability level with a Tukey-test (Tukey’s honestly significant difference, HSD).
3. Results
3.1. Plant growth
There were significant differences in plant growth after 4 weeks. Shoot-1, Ctrl and Nema treatments had
significantly (P<0.001) smaller shoots than the Prot
and combined N×P treatments (Table 1). At the
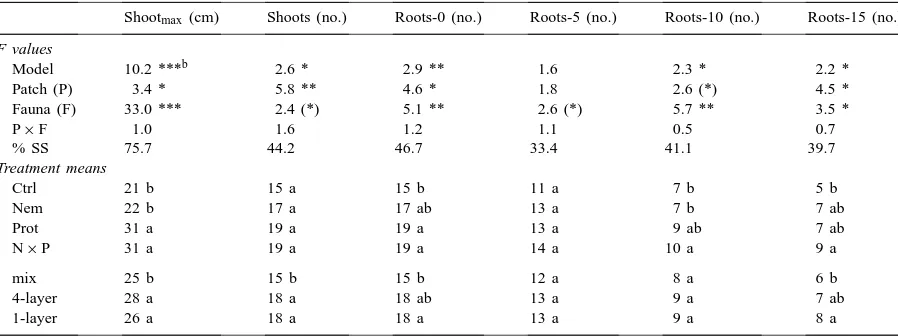
fi-nal harvest, 2 weeks later, the order in growth of the new shoots had not changed between the treatments (Fig. 2). The biomasses of shoot base and roots in the Ctrl treatment were significantly smaller than those in
the Nema, Prot and N×P treatments (Table 1).
Com-pared to control plants with a total biomass of 121 mg, plant biomass increased in the faunal treatments with
Nema, Prot and N×P by factors of 1.2, 1.7 and 1.8,
respectively. However, the increase was only signifi-cant for the protozoan treatments.
The patchiness of the organic matter in soil also significantly influenced plant growth. The smallest plants were found in treatments where the hotspot material had been homogeneously mixed with the soil (mix) (Table 1). Consequently, the smallest plants were found in mix-treatment without protozoa and the biggest plants in microcosms with 1- and 4-layer
in Prot and N×P treatments (Fig. 2).
Differences in plant biomass were also reflected in plant morphology. Shoots in treatments with
proto-zoa (Prot, P×N) were ca. 10 cm taller than in Nema
and Ctrl treatments. The average shoot length was also ca. 10% higher in the 4-layer treatment com-pared to the 1-layer and mix-treatment (Table 2). In addition, plants in the mix-treatment had fewer emerging shoots than in the 4-layer and 1-layer treat-ments (Table 2). There was no significant difference in the number of shoots emerging between the faunal treatments. No differences between treatments were observed with respect to the maximum root length.
However, plants in the Prot and N×P treatments
Table 1
Results of a two-factorial ANOVA on the effects of hotspot configuration (Patch) and soil microfauna (Fauna) on plant growth, and sum of squares explained by the model (% SS explained)a
1stshoot 2nd shoot Base Root Plant
F values
Model 20.2 ***b 18.0 *** 4.4 *** 4.4 *** 14.7 ***
Patch (P) 48.9 *** 24.4 *** 13.9 *** 9.5 *** 33.8 ***
Fauna (F) 40.8 *** 48.8 *** 5.2 ** 8.0 *** 30.7 ***
P×F 0.3 0.4 0.9 1.0 0.3
% SS explained 86.0 84.6 57.6 57.6 81.8
Treatment means (g dry wt)
Ctrl 0.038 b 0.027 b 0.034 b 0.023 b 0.121 b
Nem 0.044 b 0.033 b 0.042 ab 0.031 ab 0.150 b
Prot 0.067 a 0.054 a 0.045 a 0.034 a 0.200 a
N×P 0.071 a 0.060 a 0.048 a 0.038 a 0.217 a
mix 0.037 b 0.032 b 0.032 b 0.024 b 0.125 b
4-layer 0.065 a 0.049 a 0.046 a 0.034 a 0.194 a
1-layer 0.063 a 0.048 a 0.049 a 0.035 a 0.195 a
aMean plant biomass values and comparison among means of the Faunal treatments: animal-free control (Ctrl), nematodes (Nem),
protozoa (Prot), nematodes and protozoa (N×P); and among means of the Patch treatments with organic matter mixed into the soil (mix), organic matter in four layers (4-layer), and one layer (1-layer). The means are for biomass of shoots at the first harvest cut 5 cm above shoot base (1st shoot), shoots of the final harvest cut 5 cm above shoot base (2nd shoot), shoot base (0–5 cm height) of the final harvest (base), roots of the final harvest (root) and biomass of the whole plant (plant; 1st shoot+2nd shoots+base+roots). Different letters indicate a significant difference between means (P<0.05, Tukey-test).
b*** P<0.001, ** P<0.01.
Table 2
Results of a two-factorial ANOVA on the effects of hotspot configuration (Patch) and soil microfauna (Fauna) on plant shoot length and number of shoots and rootsa
Shootmax (cm) Shoots (no.) Roots-0 (no.) Roots-5 (no.) Roots-10 (no.) Roots-15 (no.)
F values
Model 10.2 ***b 2.6 * 2.9 ** 1.6 2.3 * 2.2 *
Patch (P) 3.4 * 5.8 ** 4.6 * 1.8 2.6 (*) 4.5 *
Fauna (F) 33.0 *** 2.4 (*) 5.1 ** 2.6 (*) 5.7 ** 3.5 *
P×F 1.0 1.6 1.2 1.1 0.5 0.7
% SS 75.7 44.2 46.7 33.4 41.1 39.7
Treatment means
Ctrl 21 b 15 a 15 b 11 a 7 b 5 b
Nem 22 b 17 a 17 ab 13 a 7 b 7 ab
Prot 31 a 19 a 19 a 13 a 9 ab 7 ab
N×P 31 a 19 a 19 a 14 a 10 a 9 a
mix 25 b 15 b 15 b 12 a 8 a 6 b
4-layer 28 a 18 a 18 ab 13 a 9 a 7 ab
1-layer 26 a 18 a 18 a 13 a 9 a 8 a
aShoot
max: maximal shoot length; Shoots: number of shoots at root base; Roots−0: number of roots at root base; Roots−5: number
of roots at−5 cm; Roots−10: number of roots at−10 cm; Roots−15: number of roots at−15 cm. Details as in Table 1.
Fig. 2. Biomass of ryegrass: shoots at first harvest (a); shoots and roots at final harvest (b) from microcosms with various faunal treatments [animal-free control (Ctrl), nematodes (Nem), protozoa (Prot), nematodes and protozoa (N×P)] and patch treatments [with organic matter mixed into the soil (mix), organic matter in four layers (4-layer), and one layer (1-layer)]. Means with the same letter on the top of the columns are not significantly different (P > 0.05).
the following order N×P > Prot > Nema > Ctrl and
also in the treatments 1-layer=4-layer > mix (Table
2).
3.2. C and N in plant tissue
The nitrogen content of plant tissue increased, com-pared to the control, in treatments with protozoa (Table 3). In the presence of protozoa the N-concentration of roots, shoot-base, 1st shoot and 2nd shoot increased by factors of 1.2, 1.1, 1.1 and 1.1, respectively. In con-trast, the presence of nematodes alone did not signif-icantly alter N-concentrations compared to the con-trol. The percentage of N in the 2nd shoot and shoot
base was significantly reduced in the 4-layer treatment compared with the mix-treatment (Table 3).
The concentration of 15N in plant tissue strongly
depended on both the hotspot and faunal treatments. The hotspot treatments accounted for 42–89% of the
variance in 15N-concentrations of plant tissue. The
concentration of 15N in the plant was increased in
the mix-treatment (1.5×the 1-layer treatment) and
the 4-layer treatment (1.2×the 1-layer treatment,
Table 3). This pattern was consistently found to be re-peated in all faunal treatments. The faunal treatments
accounted for 3–44% of the variation in at.%15N in
plant tissue. The highest concentrations of15N were
Table 3
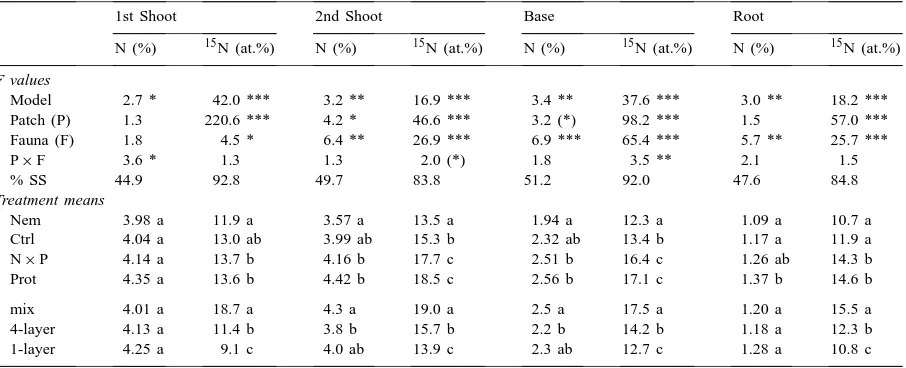
Results of a two-factorial ANOVA on the effects of hotspot configuration (Patch) and soil microfauna (Fauna) on element contents in plant tissue: N,15N of shoots of the first harvest cut 5 cm above shoot base (1st shoot), shoots of the final harvest cut 5 cm above shoot base
(2nd shoot), shoot base (0–5 cm height) of the final harvest (base), roots of the final harvest (root)a
1st Shoot 2nd Shoot Base Root
N (%) 15N (at.%) N (%) 15N (at.%) N (%) 15N (at.%) N (%) 15N (at.%) F values
Model 2.7 * 42.0 *** 3.2 ** 16.9 *** 3.4 ** 37.6 *** 3.0 ** 18.2 *** Patch (P) 1.3 220.6 *** 4.2 * 46.6 *** 3.2 (*) 98.2 *** 1.5 57.0 *** Fauna (F) 1.8 4.5 * 6.4 ** 26.9 *** 6.9 *** 65.4 *** 5.7 ** 25.7 ***
P×F 3.6 * 1.3 1.3 2.0 (*) 1.8 3.5 ** 2.1 1.5
% SS 44.9 92.8 49.7 83.8 51.2 92.0 47.6 84.8
Treatment means
Nem 3.98 a 11.9 a 3.57 a 13.5 a 1.94 a 12.3 a 1.09 a 10.7 a
Ctrl 4.04 a 13.0 ab 3.99 ab 15.3 b 2.32 ab 13.4 b 1.17 a 11.9 a
N×P 4.14 a 13.7 b 4.16 b 17.7 c 2.51 b 16.4 c 1.26 ab 14.3 b
Prot 4.35 a 13.6 b 4.42 b 18.5 c 2.56 b 17.1 c 1.37 b 14.6 b
mix 4.01 a 18.7 a 4.3 a 19.0 a 2.5 a 17.5 a 1.20 a 15.5 a
4-layer 4.13 a 11.4 b 3.8 b 15.7 b 2.2 b 14.2 b 1.18 a 12.3 b
1-layer 4.25 a 9.1 c 4.0 ab 13.9 c 2.3 ab 12.7 c 1.28 a 10.8 c
aDetails as in Table 1.
all plant parts in the order Ctrl<Nema<Prot=N×P
(Table 3). This resulted in increased concentrations
of15N in whole plants by factors of 1.1, 1.3 and 1.4
in the Nema, Prot and N×P treatments compared to
control plants, respectively.
Average carbon content in plants ranged between 35 and 40%, and there were only significant treatment effects at the first harvest in the hotspot treatments. At this time plants from the mix, 1-layer and 4-layer treatments contained 38.0, 39.7 and 40.2% C,
respec-tively. The concentrations of13C varied slightly but not
significantly between treatments with average values
between 1.075 and 1.105 at.%13C.
The faunal treatments significantly affected the C/N-ratio of plants (Table 4), which was always lower in protozoan treatments than in the Ctrl and Nema treatments. There was no clear trend of C/N-ratio with respect to the hotspot treatments.
The total contents of C,13C, N and15N in the faunal
treatments increased in the order Ctrl<Nema<Prot
<N×P (Table 5), with the protozoan treatments
being significantly greater than the non-protozoan
treatments. The amount of15N incorporated in plant
biomass corresponded to 3.3, 4.2, 8.2 and 8.9% of
15N originating from the labelled hotspot material in
the respective Ctrl, Nem, Prot and N×P treatments.
Overall, plants in the mix-treatment had lower total
contents of C,13C, N and15N than in the layered
treat-ments. However, there was a strong fauna×hotspot
interaction and the effects of protozoa on15N-content
in plants depended on the distribution of organic
matter in the hotspot treatments. The15N-content of
plants in the presence of protozoa was approximately doubled compared to Nema and Ctrl treatments. The
highest amounts of 15N were found in plants from
the mix- and 4-layer treatments in the presence of protozoa and the lowest in the 1-layer treatment. The opposite effect was observed in treatments without
protozoa, where the lowest contents of 15N were
found in plants of the mix-treatment and the highest in the 4-layer and 1-layer treatments (Table 5).
3.3. N in soil and leachate
The faunal and the hotspot treatments both affected the amount of exchangeable nitrate bound in the soil matrix (i.e. nitrate leached from soil in KCl extracts), but did not affect ammonium contents. The faunal effects were responsible for 47% of the variation in
NO3contents of soil, compared to 8% for the hotspot
treatments. The exchangeable amount of nitrate
de-creased in the order Prot > N×P > > Ctrl > Nema, with
3.1 and 2.8mg NO3–N g−1soil in the Prot and N×P
Table 4
Results of a two-factorial ANOVA on the effects of hotspot configuration (Patch) and soil microfauna (Fauna) on C : N ratios in shoots of the first harvest cut 5 cm above shoot base (1st shoot), shoots of the final harvest cut 5 cm above shoot base (2nd shoot), shoot base (0–5 cm height) of the final harvest (base), roots of the final harvest (root)a
1st shoot 2ndshoot Base Root
F values
Model 3.2 ** 4.5 *** 5.6 4.0 ***
Patch (P) 1.1 6.5 ** 3.9 * 1.6
Fauna (F) 3.9 * 9.2 *** 13.9 *** 7.8 ***
P×F 3.6 * 1.6 2.1 2.9 *
% SS explained 49.5 58.1 63.3 55.0
Treatment means (C : N ratio)
Nem 10.0 a 10.4 a 19.3 a 38.0 a
Ctrl 10.0 a 9.7 ab 16.2 b 35.6 ab
N×P 9.4 ab 8.8 b 14.2 b 31.6 bc
Prot 9.1 b 8.7 b 14.1 b 29.1 c
mix 9.7 a 8.8 a 14.8 a 35.0 a
4-layer 9.8 a 9.9 b 17.1 b 33.8 a
1-layer 9.4 a 9.6 b 16.0 ab 31.9 a
aDetails as in Table 1.
soil in the Ctrl and Nema treatments, respectively. The ammonium content of the soil ranged from 1.6 to
1.05mg NH4–N g−1. The distribution of the hotspot
material affected the amount of nitrate in soil in the
order mix > 4-layer > 1-layer. With 2.7mg NO3–N g−1
soil the nitrate content of the mix-treatment was higher than the nitrate concentration in the 1-layer treatment
with 2.1mg NO3–N g−1soil, but neither were
signifi-Table 5
Results of a two-factorial ANOVA on the effects of hotspot configuration (Patch) and soil microfauna (Fauna) on contents of C,13C, N
and15N in plant material and biomass of the whole plantsa
C 13C N 15N Biomass
F values
Model 14.2 *** 14.0 *** 29.5 *** 26.0 *** 4.7 ***
Patch (P) 36.2 *** 35.4 *** 43.3 *** 3.0 (*) 33.8 ***
Fauna (F) 26.9 *** 26.7 *** 76.1 *** 89.3 *** 30.7 ***
P×F 0.5 0.5 1.6 2.1 (*) 0.3
% SS explained 81.3 81.1 90.0 88.8 81.8
Treatment means (mg)
Ctrl 47 a 0.5 a 3.6 a 0.41 a 121 a
Nem 58 a x1.2 0.6 a x1.2 4.1 a x1.1 0.53 a x1.3 150 a x1.2
Prot 76 b x1.6 0.8 b x1.6 6.7 b x1.9 1.02 b x2.5 200 b x1.7
N×P 81 b x1.7 0.9 b x1.7 7.1 b x2.0 1.11 b x2.7 217 b x1.8
mix 45 a 0.5 a 4.1 a 0.71 a 125 a
4-layer 74 b 0.8 b 6.0 b 0.76 ab 194 b
1-layer 75 b 0.8 b 6.1 b 0.82 b 195 b
aNumbers in italics indicate factors of increase in element contents in faunal treatments compared to the Ctrl treatment. Details as in
Table 1.
cantly different from the 4-layer treatment with 2.3mg
NO3–N g−1soil (Table 6).
90% of the nitrogen leached as nitrate. No signif-icant differences were observed in the ammonium contents of the leached water. The faunal and hotspot treatments were responsible for 20 and 24% of the
variation in NO3-leaching, respectively. Within
Table 6
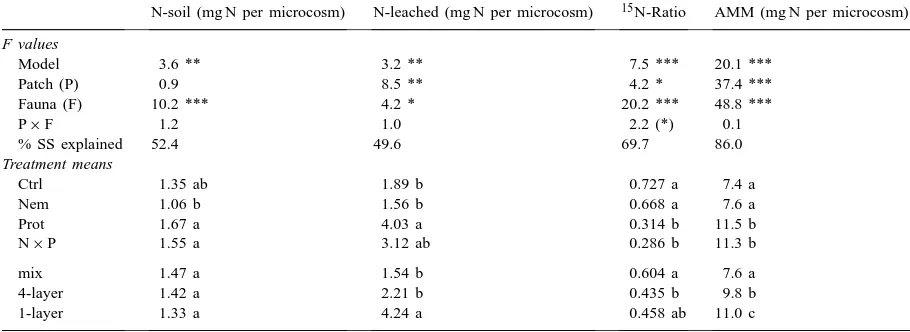
Results of a two-factorial ANOVA on the effects of hotspot configuration (Patch) and soil microfauna (Fauna) on nitrogen bound in the soil matrix (N-soil), nitrogen leached (N-leached), ratio 15N-leached :15N-uptake (15N-Ratio), accumulated microbial nitrogen-mineralization
(AMM) as the sum of N in plants, N in soil and N leacheda
N-soil (mg N per microcosm) N-leached (mg N per microcosm) 15N-Ratio AMM (mg N per microcosm)
F values
Model 3.6 ** 3.2 ** 7.5 *** 20.1 ***
Patch (P) 0.9 8.5 ** 4.2 * 37.4 ***
Fauna (F) 10.2 *** 4.2 * 20.2 *** 48.8 ***
P×F 1.2 1.0 2.2 (*) 0.1
% SS explained 52.4 49.6 69.7 86.0
Treatment means
Ctrl 1.35 ab 1.89 b 0.727 a 7.4 a
Nem 1.06 b 1.56 b 0.668 a 7.6 a
Prot 1.67 a 4.03 a 0.314 b 11.5 b
N×P 1.55 a 3.12 ab 0.286 b 11.3 b
mix 1.47 a 1.54 b 0.604 a 7.6 a
4-layer 1.42 a 2.21 b 0.435 b 9.8 b
1-layer 1.33 a 4.24 a 0.458 ab 11.0 c
aDetails as in Table 1.
leached in the presence of protozoa and in the com-bined treatment with protozoa and nematodes (Table 6). Within the hotspot treatments, the amount of ni-trate leached from the 1-layer treatment was more than double that from the 4-layer and mix-treatments (Table 6).
The relationship between leaching and plant
up-take of 15N gives a measure of the efficiency of
the plants in uptake of 15N from the hotspot
ma-terial released by mineralization. The proportion of
15N leached to15N in the plant was more than
dou-bled in treatments without protozoa (Table 6). The effects of nematodes tended to be similar to pro-tozoan effects, but less pronounced in the 1-layer and 4-layer treatments. In the mix-treatment only
protozoa affected 15N-uptake efficiency of plants
significantly.
The accumulated microbial nitrogen-mineralization (AMM), the sum of N in plants, soil and leachate, was significantly enhanced by the presence of proto-zoa and by increasing substrate heterogeneity, which accounted for 57 and 29% of variation, respectively (Table 6). The AMM in treatments with protozoa or nematodes and protozoa was more than 30% higher compared to treatments with nematodes or control treatments and decreased in accordance with
the patchiness of the hotspot treatments in the order 1-layer > 4-layer > mix (Table 6).
3.4. Microbial respiration and biomass
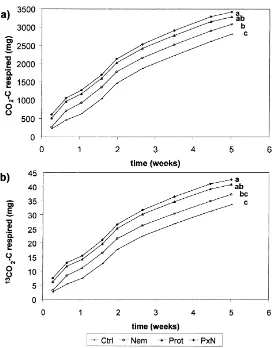
Between 2430 and 3580 mg CO2–C were respired
from the soil in the microcosms by the end of the ex-periment (Fig. 3). The cumulative amount of respired
CO2in the faunal treatments was increased compared
to the control by factors of 1.10, 1.17 and 1.21 in
the Nema, Prot and N×P treatments, respectively.
The amount of 13CO2–C respired per microcosm
ranged between 29.5 and 44.9 mg (Fig. 3).
Respira-tion of13CO2–C originating from decomposition of
the labelled hotspot material was closely correlated
with respiration of CO2–C (r2> 0.99; all three hotspot
treatments included), indicating that decomposition processes within the hotspot material were the main component of soil respiration and that root respiration
was comparatively insignificant. 13CO2-respiration
from the labelled hotspot material increased compared
to the control in the Nema, Prot and N×P treatments
by factors of 1.11, 1.21 and 1.27, respectively. Soil respiration did not differ among hotspot treatments.
The amount of13CO2–C respired is a measure of
Fig. 3. Cumulative respiration (mg per microcosm) of CO2–C (a) and13CO2–C (b) from microcosms with faunal treatments. See Fig. 2
for treatment abbreviations. Means are averaged since respiration did not differ between distinct hotspot treatments. Treatments with the same letter are not significantly different (P<0.05).
Subtraction of the standard baseline (1.108 at.%13C)
from the at.% 13C measurements of CO2 from soil
respiration, gives the time course of decomposition activity in the hotspot material (Fig. 4). There was
an initial increase in respired13CO2–C followed by a
slow decrease in decomposition towards the end of the experiment in all treatments. However, the time course
and magnitude of13CO2–C respiration in the Ctrl and
Nema treatments differed considerably from the
pro-tozoan (Prot, N×P) treatments. The rate of13CO2–C
respiration in Ctrl and Nema treatments peaked after
11 days with values of 0.12 and 0.13 at.%13C,
respec-tively, while maximum decay rates of labelled
sub-strate were reached after 14 days in the Prot and N×P
treatments with 0.2 and 0.19 at.% 13C, respectively
(Fig. 4). Following the first harvest of shoot material,
an additional increase in13CO2–C release in the
pro-tozoan treatments at the end of the experiment could be detected. The increase was absent in the Ctrl and Nema treatments.
Microbial biomass at the end of the experiment did not correlate with measures of microbial res-piration. Only hotspot significantly affected micro-bial biomass in soil, which decreased in the order mix > 4-layer > 1-layer, with 504, 370 and 333 ug
C g–1, respectively. In the faunal treatments
Fig. 4. Time course of decomposition activity as indicated by the evolution of13CO2–C from the labelled substrate. See Fig. 2 for treatment
abbreviations.
3.5. Microfaunal populations
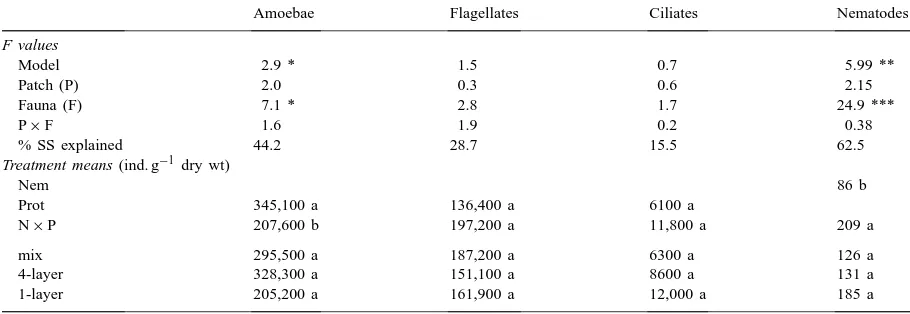
Naked amoebae were the most abundant protozoan group in the protozoan treatments. In the presence of nematodes, numbers of naked amoebae decreased significantly while numbers of flagellates and ciliates increased by factors of 1.45 and 1.9, respectively. However, these latter effects were not statistically sig-nificant. In contrast, nematode numbers significantly
increased from 86 to 209 ind. g−1 in the presence of
protozoa (Table 7). No statistically significant effects
Table 7
Results of a two-factorial ANOVA on the effects of hotspot configuration (Patch) and soil microfauna (Fauna) on numbers of amoebae, flagellates, ciliates and nematodes in soila
Amoebae Flagellates Ciliates Nematodes
F values
Model 2.9 * 1.5 0.7 5.99 **
Patch (P) 2.0 0.3 0.6 2.15
Fauna (F) 7.1 * 2.8 1.7 24.9 ***
P×F 1.6 1.9 0.2 0.38
% SS explained 44.2 28.7 15.5 62.5
Treatment means (ind. g−1dry wt)
Nem 86 b
Prot 345,100 a 136,400 a 6100 a
N×P 207,600 b 197,200 a 11,800 a 209 a
mix 295,500 a 187,200 a 6300 a 126 a
4-layer 328,300 a 151,100 a 8600 a 131 a
1-layer 205,200 a 161,900 a 12,000 a 185 a
aDetails as in Table 1.
on protozoan abundance could be detected in hotspot treatments, probably due to the high variability in protozoan numbers obtained by the MPN-method. However, increased average numbers of ciliates
with 6000, 9000 and 12,000 ind. g−1 in the order
mix-treatment<4-layer<1-layer, respectively,
4. Discussion
4.1. Hotspot effects on plant growth
Plant performance was strongly affected by both the distribution of organic material in soil, i.e. the ‘hotspot’ treatments, and presence of microfauna, i.e. the ‘faunal’ treatments (Fig. 2). Biomass and N-content of the plants were significantly increased when the organic material was concentrated in dis-tinct layers rather than uniformly distributed through the soil (Table 5). Observations of the root system at harvest indicated an increased root growth within the layers of organic matter, while numbers of main roots were 10–20% lower in the mix-treatment (Table 2). In addition, roots were found growing through the small decomposing particles of plant residues of the hotspot material. This supports the idea that lo-calized root growth is a major mechanism whereby plants ‘forage’ for patchy nutrient supplies (Drew and Saker, 1975, 1978; Hutchings and de Kroon, 1994; Robinson, 1994; Hutchings and Wijesinghe, 1997).
Basically, plant roots and microbes strongly com-pete for available nutrients and this competition may even lead to reduced plant growth (Bååth et al., 1978; Newman, 1985; Jackson et al., 1989; Azam et al., 1990; Wang and Bakken, 1997a). Whether the miner-alized N from the decomposing hotspot material will be available for plant uptake depends on the ability of the roots to compete with the soil microflora for this re-source. In the 4-layer and 1-layer treatments, microbial extracellular decomposition processes should result in a higher concentration of available nutrients within the hotspot layers compared to decomposition processes in the mix-treatment where nutrients will be released at random in small spatially unpredictable pulses. Since the benefit of localized root growth will be progres-sively reduced as exploitation of the hotspot material declines with its size, plants should be better competi-tors if available nutrients are concentrated in patches rather than diluted within uniformly distributed or-ganic particles in soil.
This assumption is supported by the experiments of Wang and Bakken (1997a), who introduced alternat-ing layers of decomposalternat-ing clover and straw residues in soil planted with barley. Their experiments have shown that plant roots and microbes were competing for the same N-source, but the competitiveness of plants
grad-ually increased with distance of organic patches in soil until no extra plant-N was obtained with a patch dis-tance greater than 6 mm (Wang and Bakken, 1997a,b).
As illustrated by similar rates of13CO2-respiration
released from decomposing organic matter in hotspot treatments, it can be assumed that the distribution of organic material did not affect decomposition of the organic material and consequently the nutrient release for plant growth. However, increased plant growth indicated that roots had better access to nu-trients when the organic material was aggregated in patches, i.e. supporting the idea of root foraging as an important mechanism for the exploitation of patchy nutrient sources. Conversely, in treatments where the organic material was uniformly mixed with the soil much of the N remaining in the soil apparently was unavailable for plant uptake.
4.2. Faunal effects on plant biomass and morphology
In contrast to hotspot treatments, microfauna af-fected significantly the decomposition of the hotspot material. The time-course in decomposition of the hotspot material, monitored by continuous
measure-ments of 13CO2–C, showed more dynamic and
in-creased rates of decomposition in the presence of pro-tozoa compared to the Nema and Ctrl treatments (Fig.
4). In addition, cumulative ratios of CO2and release
of13CO2 from hotspot material increased slightly in
treatments with nematodes and in the presence of pro-tozoa significantly by ca. 15%. Effects of nematodes and protozoa were additional, with maximum values of soil respiration in combined treatments with pro-tozoa and nematodes, suggesting an increased micro-bial activity in the presence of microfauna (Fig. 3).
In-creased rates of13CO2from decomposition coincided
with increased amounts of KCl-extractable N, a mea-sure of available nitrogen bound in the soil matrix, and with increased amounts of nitrogen in leaching water in protozoan treatments. These facts give strong evidence for increased microbial mineralization activ-ity and subsequent availabilactiv-ity of nutrients for plant growth due to microfaunal grazing.
well with a number of investigations. Increased N-mineralization (Bååth et al., 1981; Ingham et al., 1985, Vreeken-Buijs et al., 1997) and N-uptake of plants in presence of microfauna, especially protozoa (Elliott et al., 1979; Clarholm, 1985, 1989; Ritz and Griffiths, 1987; Kuikman et al., 1990) and a concomi-tant increase in biomass of plants (Clarholm, 1984; Gerhardson and Clarholm, 1986; Ritz and Griffiths, 1987; Kuikman et al., 1990; Jentschke et al., 1995; Alphei et al., 1996) has been repeatedly reported. The most common explanation for increased plant growth in the presence of microfauna is based on nutrient effects due to grazing on microorganisms (Elliott et al., 1979; Clarholm, 1985; Zwart et al., 1994). Nematode and protozoan grazing can stimu-late microbial turnover (Yeates and Coleman, 1982; Alphei et al., 1996) and the low C : N ratio in the mi-crobial biomass causes mimi-crobial-feeding animals to excrete much of the ingested nitrogen, mostly as am-monia (Stout, 1973). Generally, ca. 40% of ingested microbial biomass N will be excreted by protozoa (Griffiths, 1994) and ca. 70% by nematodes (Ferris et al., 1997), leading to a constant release of nutrients readily available for plant uptake.
The smallest plants (0.08 g dry wt) were found in treatments without microfauna where the hotspot ma-terial was uniformly mixed with soil (Fig. 2). The in-crease in plant biomass by a factor of 2.3 in the
pres-ence of microfauna (N×P) was even higher than the
1.8-fold increase in plant biomass without microfau-nal activity but when the organic material was con-centrated in distinct patches. Compared to the hotspot treatments, which accounted for 34% of variance in plant growth, 47% of variation could be explained by the faunal treatments, indicating that growth of ryegrass was even more influenced in our system by microbial–faunal interactions than by root foraging. The effects of fauna and hotspots were additional, with a threefold increased plant biomass in treatments with protozoa and hotspot material in 1- or 4-layer com-pared to mix without microfauna. In addition, plants recovered more quickly in the presence of protozoa after the 1st shoots were harvested. In Ctrl and Nema treatments 2nd shoots gained only 70 and 76%, but
2nd shoots in the Prot and N×P treatments achieved
81 and 84% biomass of the 1st harvest shoots, respec-tively. It is likely that root foraging and competition with the microflora had depleted the available nutrient
pool in the absence of microfauna, resulting in a strong nutrient limitation of regrowing shoots in Ctrl treat-ments. This leads to the conclusion that much N was inaccessible to plants even by nutrient acquisition from distinct patches, but became available by microfau-nal activity which possibly enabled a more persistent nutrient acquisition of plants. Therefore, microfau-nal effects are especially important under conditions where nutrient supplies depend on the local micro-bial decomposition of a chemically complex, organic substrate.
4.3. Faunal effects on decomposition and nutrient cycling
As expected, differences in plant growth were reflected in nutrient contents of the plant material. Consistently with an increase in biomass, the uptake of carbon and nitrogen was doubled in the presence of protozoa compared to Ctrl plants and plants in Nema
treatments. But uptake of 15N increased
dispropor-tionately by a factor of 3 in Prot and N×P treatments
emphasizing the importance of protozoa in the de-composition process of the hotspot material (Table 5). The effects of protozoa depended on the type of
hotspot. In plants of Ctrl and Nema treatments,15N
content decreased in the order 1-layer > 4-layer > mix.
The reverse effect was found in Prot and N×P
treatments with an increase of 15N in the order
1-layer<4-layer<mix. The data illustrates that
nu-trient acquisition from hotspot material by plants was especially limited in the absence of protozoa when the organic matter was homogeneously distributed in soil.
In addition to the stimulation of microbial turnover, protozoan grazing may have changed the microbial composition leading to increased nitrogen
concentra-tions in soil and leaching water of Prot and N×P
treatments. It has been demonstrated that protozoan grazing facilitates reestablishment of certain bacte-rial species after fumigation. Amoebae and ciliates in particular have been shown to have a stimulatory effect on nitrifying bacteria (Griffiths, 1989; Alphei et al., 1996). In accordance with these findings pro-tozoa strongly increased the concentration of
avail-able nitrate in soil and leaching of NO3–N was more
and Nema treatments, indicating that protozoa sig-nificantly enhance the release of N as highly mobile
NO3−. In this way protozoa affected the mobility of
nitrogen in soil and probably enabled plant roots to access N in the mix-treatment even where the roots were not growing in close contact with decomposing organic particles. Nematodes, in contrast, decreased
available N in soil and leaching of NO3– and NH4+
in soil water.
The total amount of nitrogen released by microbial activity in our system, as calculated by addition of N available in soil, N taken up by plants and N leached with soil water (AMM, Table 6) increased by more than one-third in the presence of protozoa compared to the Ctrl and Nema treatments and clearly demonstrates the importance of microfaunal activity in nutrient cy-cling. The coupling of nutrient release and uptake is especially important for plant growth. The
relation-ship between leaching and plant uptake of15N gives a
measure of the efficiency of the plants in uptake of15N
from the hotspot material released by mineralization.
The ratio of15N leached/15N plant uptake decreased
by more than 50% in treatments with protozoa (Table 6), indicating that protozoa increased mineralization with a concomitant increase in the uptake of available N by plants. Thus, in addition to the spatial coupling of mineralization and nutrient uptake by plants from organic hotspots, protozoan activity enhanced the syn-chronization of nutrient release and plant demand re-sulting in a twofold increase in plant biomass in the presence of protozoa.
Recent investigations have questioned the hypoth-esis that increased plant growth in the presence of protozoa is solely based on nutrient effects (Jentschke et al., 1995; Alphei et al., 1996). However, high con-centrations of readily decomposable organic matter in the hotspot material in our system stimulated soil microbial activity in the rhizosphere. Hence, nutrient effects of decomposing hotspot material dominated in our system, expressed by increased N-concentrations in plants in the presence of protozoa.
4.4. Animal interactions
A closer examination of protozoa and nematode effects revealed that complex interactions did occur in our simple bacteria–bacterivore food-web. Microfau-nal grazing does not ultimately result in a decreased
microbial biomass. Consistent with studies by Dar-byshire and Greaves (1970) and Griffiths (1986) who have shown that bacterial production can be stimu-lated by bacterial feeding protozoa and nematodes, we found that the grazing pressure did not decrease, but even tended to increase microbial biomass in Prot and Nema treatments. The opposite was true in treatments with combined grazing pressure from ne-matodes and protozoa, where microbial biomass was
reduced. Moreover, the situation in N×P treatments
was complicated by interactions between protozoa and nematodes.
The twofold increase in nematode numbers cou-pled with a decrease of naked amoebae by 40% implies a trophic relationship between amoebae and ‘bacterial’ feeding nematodes (Table 7). This sug-gestion is supported by a number of studies where a significant reduction in naked amoebae concomitant with an increase in nematodes was reported (Ander-son et al., 1978; Elliott et al., 1979, 1980; Woods et al., 1982). Thus nematodes may exhibit significant indirect effects on the composition of the microflora via affecting abundance and composition of the pro-tozoan community. These findings were supported by a more detailed study of microfaunal effects on the rhizosphere microbial community structure in the mix-treatment, where not only microbial growth, but also functional diversity and the composition of the microbial population was affected by the microfauna (Griffiths et al., 1999).
Acknowledgements
This study was made possible by a grant of the Ger-man Academic Exchange Service (DAAD) and fund-ing from the Scottish Office Agriculture Environment and Fisheries Department. We are most grateful to Jenny Stewart and Winnie Stein for their technical help, and to Prof. Dr. Stefan Scheu for modifications to the microcosms. We gratefully acknowledged the extensive comments of an unknown referee.
References
Addiscott, T.M., Whitmore, A.P., Powlson, D.S., 1991. Farming, Fertilizers and the Nitrate Problem. CAB International, Wallingford.
Alphei, J., Scheu, S., 1993. Effects of biocidal treatments on biological and nutritional properties of a mull-structured woodland soil. Geoderma 56, 435–448.
Alphei, J., Bonkowski, M., Scheu, S., 1996. Protozoa, Nematoda and Lumbricidae in the rhizosphere of Hordelymus europaeus (Poaceae): faunal interactions, response of microorganisms and effects on plant growth. Oecologia 106, 111–126.
Anderson, R.V., Elliott, E.T., McClellan, J.F., Coleman, D.C., Cole, C.V., 1978. Trophic interactions in soils as they affect energy and nutrient dynamics III. Biotic interactions of bacteria, amoebae and nematodes. Microb. Ecol. 4, 361–371.
Azam, F., Ashraf, M., Lohdi, A., Sajjad, M.I., 1990. Availability of soil and fertilizer nitrogen to wheat (Triticum aestivum L.) following rice-straw amendment. Biol. Fertil. Soils 10, 134– 138.
Bååth, E., Lohm, U., Lundgren, B., Rosswall, T., Sohlenius, B., Wiren, A., 1978. The effect of nitrogen and carbon supply on the development of soil organism populations and pine seedlings: a microcosm experiment. Oikos 31, 153–163.
Bååth, E., Lohm, U., Lundgren, B., Rosswall, T., Söderström, B., Sohlenius, B., 1981. Impact of microbial-feeding animals on total soil activity and nitrogen dynamics: a soil microcosm experiment. Oikos 37, 257–264.
Burr, T.J., Caesar, A., 1984. Beneficial plant bacteria. Crit. Rev. Plant Sci. 2, 1–20.
Byrnes, B.H., 1990. Environmental effects of N fertilizer use — an overview. Fertil. Res. 26, 209–215.
Chang, S.X., Preston, C.M., McCullough, K., 1997. Transformations of residual 15N in a coniferous forest soil
humus layer in northern Vancouver Island, British Columbia. Plant Soil 192, 295–305.
Clarholm, M., 1984. Microbes as predators or prey — heterotrophic, free-living protozoa: neglected microorganisms with an important task in regulating bacterial populations. In: Klug, M.J., Reddy, C.A. (Eds.), Current Perspectives on Microbial Ecology. Am. Soc. Microbiol., Washington, pp. 321–326.
Clarholm, M., 1985. Interactions of bacteria, protozoa and plants leading to mineralization of soil nitrogen. Soil Biol. Biochem. 17, 181–187.
Clarholm, M., 1989. Effects of plant–bacterial–amoebal interactions on plant uptake of nitrogen under field conditions. Biol. Fertil. Soils 8, 373–378.
Clarholm, M., 1994. The microbial loop in soil. In: Ritz, K., Dighton, J., Giller, K.E. (Eds.), Beyond the Biomass. CAB International, Wallingford, pp. 221–230.
Coleman, D.C., Ingham, R.E., McClellan, J.F., Trofymow, J.A., 1984. Soil nutrient transformation in the rhizophere via animal–microbial interactions. In: Anderson, J.M., Rayner, A.D.M., Walton, D.H.W. (Eds.), Invertebrate–Microbial Interactions. Cambridge University Press, Cambridge, pp. 35–58.
Darbyshire, J.F., Greaves, M.P., 1970. An improved method for the study of the interrelationships of soil microorganisms and plant roots. Soil Biol. Biochem. 2, 63–71.
Darbyshire, J.F., Wheatley, R.E., Greaves, M.P., Inkson, R.H.E., 1974. A rapid micromethod for estimating bacterial and protozoan populations in soil. Rev. Ecol. Biol. Sol. 11, 465–475. Drew, M.C., Saker, L.R., 1975. Nutrient supply and the growth of the seminal root system in barley II. Localized compensatory increases in lateral root growth and rates of nitrate uptake when nitrate supply is restricted to only part of the root system. J. Exp. Bot. 26, 79–90.
Drew, M.C., Saker, L.R., 1978. Nutrient supply and the growth of the seminal root system in barley III. Compensatory increases in growth of lateral roots, and in rates of phosphate uptake, in response to a localized supply of phosphate. J. Exp. Bot. 29, 435–451.
Elliott, E.T., Coleman, D.C., Cole, C.V., 1979. The influence of amoebae on the uptake of nitrogen by plants in gnotobiotic soil. In: Harley, J.L., Russell, R.S. (Eds.), The Soil–Root Interface. Academic Press, London, pp. 221–229.
Elliott, E.T., Anderson, R.V., Coleman, D.C., Cole, C.V., 1980. Habitable pore space and microbial trophic interactions. Oikos 35, 327–335.
Ferris, H., Venette, R.C., Lau, S.S., 1997. Population energetics of bacterial-feeding nematodes: carbon and nitrogen budgets. Soil Biol. Biochem. 29, 1183–1194.
Gerhardson, B., Clarholm, M., 1986. Microbial communities on plant roots. In: Jensen, V., Kjoller, A., Sorensen, L.H. (Eds.), Microbial Communities in Soil. pp. 19–34.
Griffiths, B.S., 1986. Mineralization of nitrogen and phosphorus by mixed cultures of the ciliate protozoan Colpoda steinii, the nematode Rhabditis sp. and the bacterium Pseudomonas fluorescens. Soil Biol. Biochem. 18, 637–641.
Griffiths, B.S., 1989. Enhanced nitrification in the presence of bacteriophagous protozoa. Soil Biol. Biochem. 21, 1045–1051. Griffiths, B.S., 1994. Soil nutrient flow. In: Darbyshire, J.F. (Ed.),
Soil Protozoa. CAB International, Wallingford, pp. 65–92. Griffiths, B.S., Boag, B., Neilson, R., Palmer, L., 1990. The use
of colloidal silica to extract nematodes from small samples of soil or sediment. Nematologica 36, 465–473.
Hayman, D.S., 1975. Phosphorus cycling by soil micro-organisms and plant roots. In: Walker, N., (Ed.), Soil Microbiology. Butterworths, London, pp. 67–91.
Hensel, M., Bieleit, G., Meyer, R., Jagnow, G., 1990. A reliable method for the selection of axenic seedlings. Biol. Fertil. Soils 9, 281–282.
Hodge, A., Stewart, J., Robinson, D., Griffiths, B.S., Fitter, A.H., 1998. Root proliferation, soil fauna and plant nitrogen capture from nutrient-rich patches in soil. New Phytol. 139, 479–494. Hurley, M.A., Roscoe, M.E., 1983. Automated statistical analysis of microbial enumeration by dilution series. J. Appl. Bacteriol. 55, 159–164.
Hutchings, M.J., de Kroon, H., 1994. Foraging in plants: the role of morphological plasticity in resource acquisition. Adv. Ecol. Res. 25, 159–238.
Hutchings, M.J., Wijesinghe, D.K., 1997. Patchy habitats, division of labour and growth dividends in clonal plants. Trends Ecol. Evol. 12, 390–394.
Ingham, E.R., Trofymow, J.A., Ingham, E.R., Coleman, D.C., 1985. Interactions of bacteria, fungi, and their nematode grazers: effects on nutrient cycling and plant growth. Ecol. Monogr. 55, 119–140.
Jackson, L.E., Schimel, J.P., Firestone, M.K., 1989. Short-term partitioning of ammonium and nitrate between plants and microbes in an annual grassland. Soil Biol. Biochem. 21, 409– 415.
Jentschke, G., Bonkowski, M., Godbold, D.L., Scheu, S., 1995. Soil protozoa and plant growth: non-nutritional effects and interaction with mycorrhizas. Biol. Fertil. Soils 20, 263–269. Kuikman, P.J., Jansen, A.G., van Veen, J.A., Zehnder, A.J.B., 1990.
Protozoan predation and the turnover of soil organic carbon and nitrogen in the presence of plants. Biol. Fertil. Soils 10, 22–28. Macfadyen, A., 1970. Simple methods for measuring and maintaining the proportion of carbon dioxide in air, for use in ecological studies on soil respiration. Soil Biol. Biochem. 2, 9–18.
Newman, E.J., 1985. The rhizosphere: carbon sources and microbial populations. In: Fitter, A.H., (Ed.), Ecological Interactions in Soil. Br. Ecol. Soc. Special Publication 9, Blackwell, Oxford, pp. 107–121.
Page, F.C., 1976. An illustrated key to freshwater and soil amoebae. Freshwater Biol. Assoc., Ambleside, 155 pp.
Ritz, K., Griffiths, B.S., 1987. Effects of carbon and nitrate additions to soil upon leaching of nitrate. Plant Soil. 102, 237– 289.
Ritz, K., Griffiths, B.S., Wheatley, R.E., 1992. Soil microbial biomass and activity under a potato crop fertilized with N and without C. Biol. Fertil. Soils 12, 265–271.
Robinson, D., 1994. The responses of plants to non-uniform supplies of nutrients. New Phytol. 127, 635–674.
SAS Institute Inc., 1993. SAS/STAT Software: Syntax, Version 6, 1st ed. SAS Institute Inc., Cary, NC.
Scheu, S., 1989. Die saprophage Makrofauna (Diplopoda, Isopoda und Lumbricidae) in Lebensräumen auf Kalkgestein: Sukzession und Stoffumsatz. Berichte des Forschungszentrums Waldökosysteme A57, 30–34.
Stout, J.D., 1973. The relationship between protozoan populations and biological activity in soils. Am. Zool. 13, 193–201. Vance, E.D., Brookes, P.C., Jenkinson, D.S., 1987. An extraction
method for measuring soil microbial biomass C. Soil Biol. Biochem. 19, 703–707.
Vreeken-Buijs, M.J., Geurs, M., de Ruiter, P.C., Brussaard, L., 1997. The effects of bacterivorous mites and amoebae on mineralization in a detrital based below-ground food web microcosm experiment and simulation of interactions. Pedobiologia 41, 481–493.
Wang, J.G., Bakken, L.R., 1997a. Competition for nitrogen during decomposition of plant residues in soil: effect of spatial placement of N-rich and N-poor plant residues. Soil Biol. Biochem. 29, 153–162.
Wang, J.G., Bakken, L.R., 1997b. Competition for nitrogen during decomposition of plant residues in soil: microbial response to C and N availability. Soil Biol. Biochem. 29, 163–170. Wheatley, R.E., MacDonald, R., Smith, A.M., 1989. Extraction of
nitrogen from soils. Biol. Fertil. Soils 8, 189–190.
Wolters, V., 1989. The influence of omnivorous elaterid larvae on the microbial carbon cycle in different forest soils. Oecologia 80, 405–413.
Woods, L.E., Cole, C.V., Elliott, E.T., Anderson, R.V., Coleman, D.C., 1982. Nitrogen transformations in soil as affected by bacterial–microfaunal interactions. Soil Biol. Biochem. 14, 93–98.
Yeates, G.W., Coleman, D.C., 1982. Nematodes and decomposition. In: Freckman, D.W. (Ed.), Nematodes in Soil Ecosystems. University of Texas Press, Austin, Tx, pp. 55– 80.
![Fig. 2. Biomass of ryegrass: shoots at first harvest (a); shoots and roots at final harvest (b) from microcosms with various faunal treatments[animal-free control (Ctrl), nematodes (Nem), protozoa (Prot), nematodes and protozoa (N × P)] and patch treatments](https://thumb-ap.123doks.com/thumbv2/123dok/3153792.1385232/7.612.90.516.64.407/ryegrass-microcosms-treatments-nematodes-protozoa-nematodes-protozoa-treatments.webp)