Comparison of conventional and alternative vegetable farming systems
on the properties of a yellow earth in New South Wales
A.T. Wells
a,∗, K.Y. Chan
b, P.S. Cornish
caHorticultural Research and Advisory Station, NSW Agriculture, Locked Bag 26, Gosford, NSW 2250, Australia bAgricultural Research Institute, Wagga Wagga, NSW Agriculture, PMB Wagga Wagga, NSW 2650, Australia
cUniversity of Western Sydney, Hawkesbury, Centre for Farming Systems Research, Bourke Street, Richmond, NSW 2753, Australia
Received 15 March 1999; received in revised form 25 November 1999; accepted 18 January 2000
Abstract
Intensive vegetable farming has the potential to damage soil health, leading to poor productivity and large environmental impacts. This paper reports on changes in soil properties after three and a half years of vegetable cropping and discusses the implications for sustainability. A vegetable farming-systems experiment began in 1992 at Somersby, in NSW, Australia. The aim of the experiment was to compare five different approaches to vegetable cropping in terms of their productivity, profitability, soil effects and environmental impact. The experimental treatments represent whole production systems, intended to simulate real farms, but under more controlled conditions than is possible on farms. The systems are defined by the goals and values of the farmer rather than by the management practices employed. The actual management practices — nutrition, tillage, rotations, pest and weed management, etc. — were selected to satisfy these goals and values. For instance, to satisfy the goal of ‘maximise profit’, fertilisers and pesticides were applied in excess to ensure high yields of large, undamaged produce which receive the best prices. Conversely, one of the management practices used to satisfy the goal ‘optimise profit while minimising environmental impact’ was to grow cover crops regularly in rotation with vegetable crops. A range of chemical, physical and biological properties of surface soil (0–10 cm) from the farming-systems were measured and compared to baseline measurements. The two alternative systems, which received large inputs of compost, had higher soil organic carbon, microbial biomass, total nitrogen, total phosphorus, exchangeable nutrient cations, water-holding capacity and aggregate stability than the conventional systems. The system that received the largest mineral fertiliser inputs, and the most tillage, had the highest available phosphorus levels, the lowest phosphorus sorption capacity and lower aggregate stability than the alternative systems. Consequently this high input system had the greatest potential to lose sediments and phosphorus to the environment. The two other conventional systems had smaller fertiliser inputs and maintained a phosphorus sorption capacity that was no different from the alternative systems. These more carefully managed conventional systems offer hope that relatively small changes in management can have significant environmental benefits. Yet the broad improvement in soil health achieved by the biological approaches should provide better long-term fertility and lower off-site impacts. It may be wise to make use of both these approaches to management in attempting to balance the short and long-term viability of intensive vegetable farming. © 2000 Elsevier Science B.V. All rights reserved.
Keywords:Soil health; Compost; Phosphorus; Water stable aggregation; Sustainability; Vegetable farming
∗Corresponding author. Tel.:+61-2-43-481900; fax:+61-2-43-481910.
E-mail address:[email protected] (A.T. Wells)
1. Introduction
Conventional vegetable farming often involves re-peated tillage, frequent exposure of soil to rainfall and excessive use of fertilisers, pesticides and irrigation wa-ter. These practices can result in severe damage to soil structure, soil erosion, reduced soil fertility and the loss of fertilisers and other chemicals from increased runoff and leaching (Hollinger et al., 1998). In the long-term these effects can reduce productivity and profitability to the farmer due to degradation of the soil resource. Fur-thermore, they can cause off-site environmental dam-age. Many farmers and scientists recognise a need to develop alternative production systems that can pre-serve productivity and minimise environmental impact while maintaining profitability.
Vegetable growing in the Sydney region of NSW, Australia, has a very significant impact on the regional economy. Over 1000 vegetable farms produce a wide range of vegetables including 70% of the tomatoes and 95% of the perishable leafy vegetables sold in the Sydney market (Department of Planning and Commu-nity Development, 1993). But, in the early 1990s, the community became concerned about the effect of veg-etable growing on the health of Sydney’s major river, the Hawkesbury-Nepean, which was then experiencing toxic blue-green algae blooms. There were, however, virtually no local data about the possible losses of nutrients, or other impacts, from vegetable farms.
In response to this lack of information, a multi-disciplinary team began an experiment at Somersby, a vegetable growing area close to Sydney, in 1992. The experiment aimed to compare the economic and envi-ronmental performance of conventional and alternative vegetable farming systems (Cornish et al., 1992).
The soil at the experimental site was one commonly used for vegetable production in the Sydney region: a yellow earth (Stace et al., 1972) derived from Hawkes-bury Sandstone. Compared to other soil types in the region it is well drained and easy to cultivate, due to its sandy texture. These factors, along with its close-ness to Sydney markets, are its chief production advan-tages. However, it also has the significant production disadvantages of low water and nutrient holding ca-pacity; farmers need to apply irrigation and nutrients frequently to maintain high productivity. Thus the po-tential for nutrient losses is high. The soil also has poor structural stability which, in combination with frequent
tillage, makes the soil prone to increased runoff, severe erosion and further losses of nutrients.
One strategy for maintaining productivity on this soil type while reducing environmental impact is to improve the properties of the soil (i.e., increase the water and nutrient holding capacity; improve aggre-gate stability) through management. This research ex-plores the effects of different management approaches on such soil properties after three and a half years of production.
2. Materials and methods
2.1. Site and soil
The experimental site is located on the Somersby section of the Gosford Horticultural Research and Ad-visory Station, 85 km north of Sydney (lat. 33◦23′S,
long. 151◦
21′
E), NSW, Australia. The annual rainfall is approximately 1300 mm and the average maximum and minimum temperatures are 25.6 and 16.2◦
C in January and 16.8 and 6.8◦C in July. The site is at an
elevation of 250 m above mean sea level on the Central Coast Plateau. The soil is a yellow earth (Luvic Fer-rasol) described in detail by McKenzie et al. (1997). The 0–10 cm layer has approximately 150 g kg−1clay,
80 g kg−1 silt, 550 g kg−1 fine sand and 220 g kg−1
coarse sand. The 70–80 cm layer has 230 g kg−1clay,
90 g kg−1 silt, 420 g kg−1 fine sand and 270 g kg−1
coarse sand. The site was cleared 60 years ago and has been predominantly used to grow vegetables and citrus.
2.2. The vegetable farming-systems experiment
Table 1
Tillage, irrigation and pest management of the five systems in the Somersby vegetable farming-systems experiment, 1992–1996
Systema Tillageb Weed Pests and Irrigation
control diseases
DP Multiple tillage Tillage and herbicides Chemical control, resistant vars. if yields OK To excess, spray Ag Reduced tillage Tillage and herbicides Chemical control, rotations, resistant vars. To excess, drip Obj No-till Plastic mulch, herbicides Economic thresholds, rotations, resistant vars. Scheduling, drip Org Minimum tillage Tillage, cover crops,
rotations, mulches
Rotations, resistant vars., ‘natural’ pesticides as last resort
Drip Ev No-till Cover crops, rotations,
mulches, herbicides
Rotations, resistant vars., chemical control if needed Drip aFarming system: DP=District Practice; Ag=Agfact; Obj=Objective; Org=Organic; Ev=Evolving. See Section 2.3 for details. bMultiple tillage=soil cultivated with a rotary hoe or discs 2–4 times for each crop; reduced tillage=1–2 times for each crop; minimum tillage=1 time for each crop; no-till=no use of rotary hoe or other implements except to occasionally break-up crop residues on the surface.
The farming systems were defined in terms of the ap-proach to management rather than strictly on the types of practices used. The approach to management was de-fined for each system by firstly defining the goals and values of a farmer of that system, and then secondly by defining a set of typical management practices. The system goals and values were fixed but the manage-ment practices could vary, to some degree, in order to satisfy the goals and be consistent with underlying val-ues. The results of a formal survey of vegetable growers in the Sydney region (Murison, 1995) and focus group meetings (unpublished) helped to establish the goals and values of the systems and their associated manage-ment guidelines.
The names of the five farming systems and their defining goals and values follows. Tables 1 and 2 list the management practices used on each system to sat-isfy these goals and values. During implementation of the systems, farmers representative of conventional and
Table 2
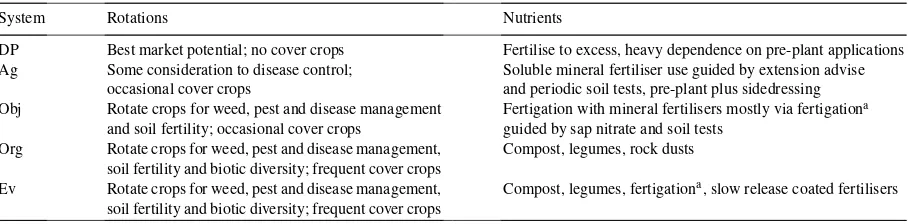
Crop rotation and nutrition management of the five systems in the Somersby vegetable farming-systems experiment, 1992–1996
System Rotations Nutrients
DP Best market potential; no cover crops Fertilise to excess, heavy dependence on pre-plant applications Ag Some consideration to disease control;
occasional cover crops
Soluble mineral fertiliser use guided by extension advise and periodic soil tests, pre-plant plus sidedressing Obj Rotate crops for weed, pest and disease management
and soil fertility; occasional cover crops
Fertigation with mineral fertilisers mostly via fertigationa guided by sap nitrate and soil tests
Org Rotate crops for weed, pest and disease management, soil fertility and biotic diversity; frequent cover crops
Compost, legumes, rock dusts Ev Rotate crops for weed, pest and disease management,
soil fertility and biotic diversity; frequent cover crops
Compost, legumes, fertigationa, slow release coated fertilisers aFertigation refers to applying soluble nutrients through the irrigation system.
organic approaches to vegetable growing were regu-larly consulted to ensure that the systems were consis-tent with commercial practice.
2.3. Description of the systems
2.3.1. District Practice (DP)
This system aims to maximise profit; the investment made in each crop is rigorously protected; and pest, weed and disease free crops are highly valued. These goals and values often lead to excessive use of fertilis-ers, tillage, pesticides, irrigation and little use of benefi-cial crop rotations. High inputs are used to ensure large yields of large, unblemished produce. Such produce receives the best prices. Tillage is generally performed three or four times for each crop with a rotary-hoe.
2.3.2. Agfact (Ag)
This system has similar goals and values to the Dis-trict Practice system but advice from departments of agriculture, and other sources of information, about proven technology is also valued. The aim is to make more efficient use of inputs and therefore reduce costs. For example, drip irrigation is used rather than spray irrigation, fertiliser rates are based on the results of tri-als and the number of tillage passes made for each crop is half of those on the District Practice.
2.3.3. Objective (Obj)
This system aims to optimise profit within the con-straint of minimum environmental impact. It makes maximum use of objective management tools; optimal inputs are applied to gain high outputs but the main-tenance or improvement of measurable aspects of soil health is a key objective. Technology such as irriga-tion scheduling, fertigairriga-tion (applying nutrient soluirriga-tions through the irrigation system) and plastic-sheet mulch are used to reduce environmental risks while maintain-ing high productivity. This is a no-till treatment but oc-casionally, in breaking-up large masses of crop residue and during planting, the top 40 mm of soil is disturbed.
2.3.4. Organic (Org)
This system adheres to organic production standards (National Association for Sustainable Agriculture, Aus-tralia Ltd (NASSA, 1993)). It aims to produce healthy, wholesome food and to make an acceptable living; nat-ural process are utilised as much as possible; exter-nal inputs are minimised and the improvement of all aspects of soil health is a key objective. This system receives similar tillage to the Agfact system. Nutrient inputs are largely in the form of rock dusts (rock phos-phate and basalt) and compost. Approximately 40 Mg
ha−1 of compost was applied to the Organic system
in February 1995, consisting largely of ground woody material with poultry and horse manure.
2.3.5. Evolving (Ev)
This system has goals and values that are a mixture of those of the Objective and Organic systems: opti-mum profit with miniopti-mum environmental impact; rely on biological processes as much as possible but use technology such as herbicides and synthetic fertilis-ers when benefits appear to exceed costs. The name of this system indicates that it is more adaptable than the other systems, allowing more freedom to test novel and risky approaches. This is a no-till system but, like the Objective system, the top 40 mm of soil is occasion-ally disturbed during normal horticultural operations. A large compost application (∼65 Mg ha−1) was
ap-plied in February 1995, consisting of ground woody material and sewage sludge.
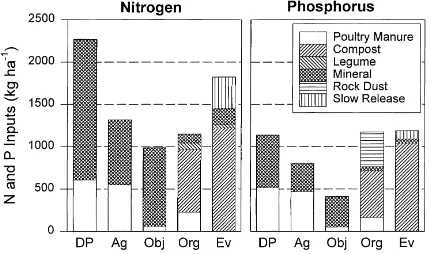
2.4. Nutrient inputs
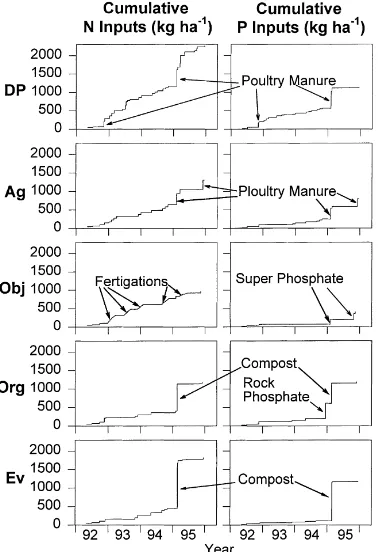
As mentioned in the previous section, the systems can be divided into two groups based on the rate of availability of their nutrient sources. In addition, the amount and timing of nutrient inputs to the systems also varied. The District Practice system received the most N, the Evolving system received 81% of this amount, the Agfact 58%, the Organic 52% and the Objective 43%. The District Practice, Organic and Evolving sys-tems received similar high amounts of phosphorus (P), the Agfact received 71% of this amount and the Objec-tive 36%. The Organic and Evolving systems received very large infrequent applications, the District Practice and Agfact generally received large, frequent applica-tions and the Objective system received small, very frequent applications (of N). The N and P inputs on Organic and Evolving were dominated by single, large applications of compost.
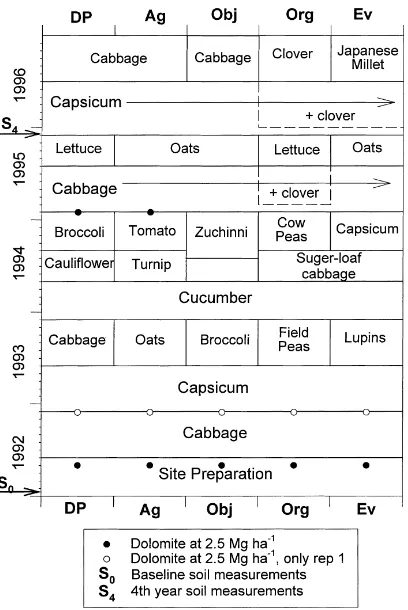
2.5. Crop sequences
Fig. 1. Crop sequences on the five vegetable farming-systems in the Somersby vegetable farming-systems experiment and the timing of soil sampling and dolomite applications. Periods when clover (Tri-folium subterraneumL.) was under-sown a main crop are also shown.
crop growth, yields and profitability directly. A wide range of vegetable crops were grown; a sample of the range of crops grown in the Sydney region (Fig. 1).
2.5.1. Cover cropping
Prior to soil sampling in December 1995, the Or-ganic system had three cover cropping periods: field pea (Pisum sativumL.) in 1993, cow pea (Vigna unguic-ulata(L.) Walp.) in 1994, and subterranean clover ( Tri-folium subterraneumL.) undersown to cabbage ( Bras-sica oleraceavar.capitataL. Alef.) in 1995. The Agfact system had two oat (Avena sativaL.) cover crops: one in 1993 and another in 1995. The Evolving system also had two cover crops: white lupin (Lupinus albusL.) in 1993 and oats in 1995. The Objective system had only one cover crop of oats in 1995. The District Practice system had no cover crops.
2.6. Soil sampling
Baseline soil samples were collected in January 1992 before the experiment was established. The samples were collected on a grid layout over each experimen-tal block. Fifty-seven cores were taken in toexperimen-tal, each 150 mm diameter to approximately 900 mm depth. Eighteen of the cores were described in detail and the rest only in terms of horizon boundaries. Sub-samples from the intensively described cores were taken for chemical and physical analysis.
Comprehensive soil sampling of the surface soil was again carried out in December 1995 (fourth year sam-pling). Five subsamples were collected at random from 0–100 mm from each plot and bulked to form a compos-ite sample. All the samples were air-dried and passed through a 6.3 mm aperture sieve. A portion of each sam-ple was further passed through a 2 mm sieve to collect the<2 mm fraction. Fig. 1 shows when soil sampling took place in relation to crop sequences.
A soil sample was also collected from an undis-turbed area under native vegetation during the fourth year sampling. This sampling site was approximately 50 m from the experimental plots of replicate 1. The sampling method was the same as that used on the ex-perimental plots: five subsamples were collected and bulked into a composite sample.
2.7. Soil measurements
2.7.1. Baseline measurements
Different sets of soil properties were measured to describe the soil status at the baseline and fourth year stages. The properties that form the intersection of these sets, and which are used to quantify soil changes over this period, are: pH, electrical conductivity (EC), cation exchange capacity (CEC), organic carbon (OC) and Bray No. 1 P. The details of these measurements, and the other measurements made at the fourth year sam-pling, are set out later.
2.7.2. Soil chemical properties
was determined using a Leco nitrogen analyser. 12 g of
<2 mm soil was shaken with 60 ml of de-ionised water for 1 h after which pH and EC were measured. Then 1.2 ml of CaCl2was added and the suspension shaken
and allowed to stand for a further hour before repeating the pH measurement. Exchangeable cation concentra-tions were measured in a 0.01 M BaCl2leachate using
ICP-AES and the CEC was approximated as the sum of Ca, Mg, K, Na and Al (Abbott, 1987).
Mineralisable N was estimated using an anaerobic incubation assay as described by Keeney (1982). This involved measuring the amount of ammonium-N pro-duced during a 7 days incubation under waterlogged conditions. Keeney (1982) recommends this method as a simple and reliable predictor of soil N availability even though mineralisation in the field is an aerobic process.
Extractable P was determined using Bray extrac-tion (Abbott, 1987). The P adsorpextrac-tion characteristic of the soil samples was studied in 0.02 M KCl. Soil samples weighing 2.5 g were placed into plastic bottles and 50 ml equilibrating 0.02 M KCl solution contain-ing 24.8, 12.4, 6.2 or 0.0 mg P l−1, respectively were
added. Two drops of chloroform were added and the suspension shaken for 16 h at 20◦C. The suspension
was then filtered, the equilibrium P concentration (I) determined in the filtrate and the amount of P adsorbed (Q) calculated by difference. The concentration of solu-tion P at zero adsorpsolu-tion (IQ=0) as well as the amount of
adsorbed P at 0.2 mg l ambient P (QI=0.2) were
calcu-lated from the P adsorption isotherms for the different soils following the methods of Jaszberenyi and Loch (1970). The P adsorption measurements were also car-ried out on the soil sample under natural vegetation, adjacent to the experimental site.
2.7.3. Soil biological properties
Microbial biomass carbon was estimated using the fumigation extraction method of Wu et al. (1990) on
<6.3 mm soils. Samples equivalent of 50 g oven dried soil were equilibrated at field capacity for a week. Half of the samples were fumigated with enthanol-free chlo-roform for 24 h at 25◦
C in sealed desiccators. After fu-migant removal, both the fumigated and non-fumigated soils were extracted by shaking for 30 min with 0.5 M K2SO4. OC in the extract was determined using a
Shi-madzu Carbon Analyzer. Biomass carbon was calcu-lated from the difference in OC between the fumigated
and non-fumigated soils using a conversion factor of 2.22 (Wu et al., 1990).
2.7.4. Soil physical properties
Particle size analysis was carried out on<2 mm soil samples after dispersion by Calgon and shaking fol-lowing the method of Abbott (1987). Aggregate stabil-ity was determined by wet sieving. About 20 g of the air-dried<6.3 mm soil was weighed and wet sieved for 10 min using sieves of 250mm aperture in a 2 l cylindri-cal container. Aggregate stability was cylindri-calculated as the mass of water stable aggregates >250mm expressed as a proportion of the total soil mass. Field capacity soil water content was measured in the field, in the 0–10 cm layer, 48 h after irrigation. Permanent wilting point water content (θpwp) was determined on<2 mm
subsamples after equilibration at a pressure of 1.5 MPa using a soil moisture extractor.
2.7.5. Statistical analysis
Results were analysed by analysis of variance using Genstat V. Unless otherwise stated differences between treatments were significant atp<0.05. Least significant differences (p<0.05) were calculated for comparison amongst treatment means.
3. Results
The baseline soil properties are briefly presented be-fore detailing the results of the fourth year measure-ments. Finally the two sets of data are compared to assess the changes that occurred after three and a half years of vegetable cropping.
3.1. Baseline Status
The baseline data (Table 3) show that the soil repre-sents a typical natural yellow earth in many respects — being strongly acid, having a very low CEC, low EC and low OC (Peverill et al., 1999). However, the Bray P levels indicate that the soil had previously received fer-tiliser applications. The mean Bray P concentration of 87 mg P kg−1was approximately ten-fold higher than
Table 3
Summary of the baseline soil properties of the 0–10 cm depth in January 1992, before any treatments were applied to the Somersby vegetable farming-systems experiment (after McKenzie et al., 1997)
Property Mean Sda
pH (1:5 soil:0.01 M CaCl2) 5.4 0.8
EC (ECe)b(dS m−1) 1.96 0.98
CEC (cmol (+) kg−1) 4.6 2.0
OC (g kg−1) 11.9 1.83
Bray-I P (mg kg−1) 87 58
aStandard deviation,n=15.
bECe: electrical conductivity as a saturated paste extract.
citrus orchard and replicate 4 had been used for tomato experiments.
3.2. Fourth year status
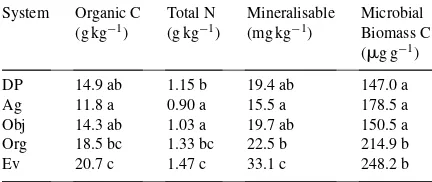
3.2.1. Soil microbial biomass, organic carbon and nitrogen
The Organic and Evolving systems had significantly higher microbial biomass carbon than the other sys-tems in December 1995; the average value for these two systems was 46% higher than that of the other sys-tems (Table 4). The microbial biomass on all syssys-tems represented approximately 1% of OC.
The Organic and Evolving systems also had the high-est OC and total N levels and the Agfact system had the lowest (Table 4). The OC level on Agfact was only 57% that of Evolving. The OC level of Objective was similar to those of the District Practice and Agfact systems.
The soil N status of the systems was closely related to their OC levels. Differences in total N followed a
Table 4
Soil organic carbon, total nitrogen, mineralisable nitrogen and mi-crobial biomass carbon of 0–10 cm soil samples after three and a half years of cropping on the five vegetable farming-systemsa
System Organic C Total N Mineralisable Microbial (g kg−1) (g kg−1) (mg kg−1) Biomass C
aMeans with the same following letter are not significantly different at the 5% level.
similar pattern to OC with no difference in C/N ratio amongst the different farming systems. The Evolving system had the highest mineralisable N, which was sig-nificantly higher than that of the Organic (Table 4). The lowest level was found in Agfact, which was not sig-nificantly different from those of the District Practice and Objective. Mineralisable N was linearly related to soil OC level (r=0.804,p<0.01,n=15).
3.2.2. Soil pH, exchangeable cations and electrical conductivity
District Practice soil was significantly more acidic than the other systems despite receiving two-fold more dolomite than the Evolving, Objective and Organic sys-tems (Table 5 and Fig. 1). Corresponding to the lowest pH, the District Practice had a higher level of exchange-able Al and a lower level of exchangeexchange-able Mg. In fact, there were significant differences in the composition of many of the exchangeable cations amongst the dif-ferent soils (Table 5). The District Practice and Agfact had similar low levels of exchangeable calcium, which were only 59% of that in the Organic and Evolving. The potassium levels of the Organic and Evolving sys-tems were nearly double those of the District Practice and Agfact. As a consequence, the effective CEC of the Evolving and Organic systems (av. 8.03) was 173 and 179% higher than those of the District Practice and Agfact systems.
There was a significant correlation between CEC and OC of the soils:
CEC= −0.931+4.46OC
r=0.90, p <0.05, n=15 (1)
indicating that the differences in CEC can be accounted for by differences in OC levels.
The Objective system had the highest EC level. It was 134% higher than the average level of the other systems.
3.2.3. Soil phosphorus
Table 5
Soil pH, electrical conductivity, exchangeable cations and effective cation exchange capacity (cmol(+)kg−1) of 0–10 cm soils after three and a half years of cropping on the five vegetable farming-systemsa
System pH Ecb(dS m−1) Na K Ca Mg Al Effective CECc
DP 4.85 a 1.5 b 0.02 a 0.15 a 3.70 a 0.48 a 0.14 b 4.49 a
Ag 5.73 bc 1.0 a 0.02 a 0.14 a 3.68 a 0.76 a 0.05 ab 4.65 a
Obj 5.49 b 3.3 d 0.02 a 0.21 a 4.85 a 0.84 a 0.03 a 5.95 a
Org 6.03 c 1.4 b 0.06 c 0.25 b 6.21 b 1.48 b 0.02 a 8.01 b
Ev 5.80 bc 1.7 c 0.04 b 0.30 b 6.26 b 1.42 b 0.01 a 8.04 b
aMeans with the same following letter are not significantly different at the 5% level.
bElectrical conductivity as a saturated paste extract (ECe) converted from 1:5 soil water extract using a multiplication factor of 20 for a sandy loam soil (Abbott, 1987).
cEffective cation exchange capacity=sum of exchangeable cations, i.e. Na+
+K+
+Ca2+
+Mg2+
+Al3+.
Table 6
Soil total phosphorus, available phosphorus and phosphorus adsorption/desorption parameters of 0–10 cm soils after three and a half years of cropping on the five vegetable farming-systemsa
System Total P (mg kg−1) Bray P (mg kg−1) Q
I=0.2(mg kg−1)b IQ=0(mg l−1)c
DP 810 b 361 c −70.76 6.47
Ag 530 a 203 ab −29.45 2.13
Obj 530 a 210 ab −45.82 2.81
Org 1090 c 168 a −33.03 1.99
Ev 970 bc 244 b −44.02 2.29
aMeans with the same following letter are not significantly different at the 5% level. bQ
I=0.2is the amount of adsorbed P at 0.2 mg l−1ambient P. cI
Q=0is the concentration of solution P at zero adsorption.
on the District Practice yet Bray P on the Organic was less than half of the District Practice level.
P adsorption isotherms revealed that the District Prac-tice soil had less P adsorption capacity and a greater ten-dency to release P than the other systems. The isotherms
Fig. 2. Total amounts and forms of N and P fertilisers applied to the vegetable farming-systems from the beginning of the experiment in mid 1992 till just prior to collecting the soil samples for this study in December 1995.
for the Organic, Objective, Agfact and Evolving sys-tems can be represented by a single line, but the Dis-trict Practice isotherm lies significantly lower (Fig. 4). The equilibrium P concentration of the solution at zero adsorption (IQ=0) was three-fold higher for the
Dis-trict Practice compared to the other systems (Table 6). Also, while the amount of P adsorbed atI=0.2 mg l−1
(QI=0.2) was negative for all the systems (indicating a
release of P from the soil) the District Practice had the most negative value:−70.76 mg P kg−1.
Soil from nearby native vegetation had a much greater capacity to adsorb P than the soils of any of the farm-ing systems. The native soil isotherm was far higher than any of the cropped soil isotherms (Fig. 4), and the QI=0.2, in marked contrast to the cropped soils, was
strongly positive: 71.3 mg P kg−1.
3.2.4. Soil physical properties
veg-Fig. 3. Cumulative nitrogen and phosphorus inputs to the vegetable farming-systems, showing the form of the larger inputs. Fertigation refers to applying soluble nutrients through the irrigation system.
etable farming systems (Table 7). Also, the water hold-ing capacity (WHC, difference betweenθfcandθpwp)
of Evolving and Organic soils was 27 and 20% higher than that of the District Practice soil. The major influ-ence on WHC was a much higherθfcon the Evolving
and Organic soils compared to the District Practice (Table 7). A highly significant correlation existed betweenθpwpand soil OC levels of the different soils:
θpwp=0.0148+0.0255OC
r=0.979, p<0.01 n=15. (2)
3.3. Changes in soil properties from the baseline status
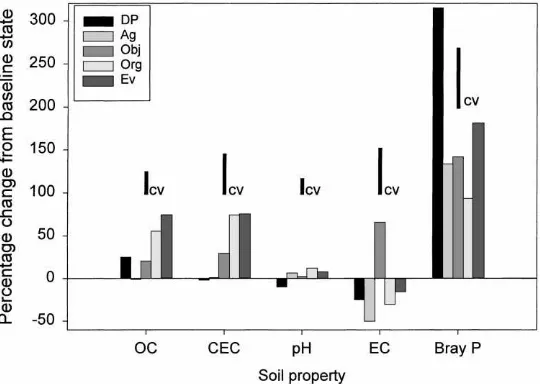
Taking the level of variability of the baseline mea-surements into account, the following changes occurred in soil properties after three and a half years of veg-etable cropping on the different systems (Fig. 5):
Fig. 4. Soil phosphorus isotherms of 0–10 cm soils of the five vegetable farming-systems.
• OC and CEC increased strongly on the Organic and Evolving while OC increased slightly on District Practice;
• none of the systems experienced a decline in OC and
CEC levels;
• there is weak evidence that pH rose on Organic and fell on District Practice;
• EC increased on the Objective system and possibly decreased on Agfact; and,
• Bray P levels increased on all systems but did so most on the District Practice system.
The OC levels of the Organic and Evolving systems rose by approximately 65% and CEC by 75%. The de-creasing trend in pH on the District Practice, although small compared to baseline variability, may still be an important indicator of system health as the mean base-line level was already very low (pH 5.4). Similarly, the
Table 7
Physical soil properties of 0–10 cm soils after three and a half years of cropping on the five vegetable farming-systemsa
System Aggregate stabilityb θ
pwpc θfcd
DP 0.35 a 0.052 ab 0.167 a
Ag 0.30 a 0.044 a –
Obj 0.33 a 0.053 ab –
Org 0.43 b 0.059 bc 0.194 b
Ev 0.43 b 0.069 c 0.211 b
aMeans with the same following letter are not significantly different at the 5% level.
bMass of water stable aggregates >250
mm expressed as a
pro-portion of the total soil mass. cθ
pwp=soil water content at permanent wilting point, measured with a pressure plate at 1.5 MPa.
dθ
Fig. 5. Percentage change in selected soil properties from the baseline state after three and a half years of vegetable cropping for each vegetable farming-system. CV=coefficient of variation (100×standard deviation/mean) of the baseline measurements for each soil property.
increased EC on the Objective system (while all other systems had a decreasing trend) is likely to cause crop growth problems. Although Bray P levels were already relatively high at the time of the baseline measurements (87 mg kg−1, Table 3) all the systems experienced
in-creases in Bray P concentration, ranging from a 315% increase on the District Practice to a 93% increase on the Organic. However, the large coefficient of variation of the baseline mean (67%) indicates that the increase on the Organic was relatively small.
4. Discussion
The issue of the sustainability of the vegetable farming-systems will be considered here in two con-texts: on-site sustainability — factors that directly af-fect the long-term productivity and profitability of the vegetable growing land itself; and off-site sustainabil-ity — the potential for the vegetable growing land to impact on the surrounding environment.
4.1. Overall performance of the systems
The soil health of the systems had generally not deteriorated after three and a half years of vegetable cropping (Fig. 5). Rather, the soil health of the Organic and Evolving systems had improved. Their soil
prop-erties demonstrate a clear on-site sustainability advan-tage over the conventional systems. The Organic and Evolving soils were more fertile: they had higher total N, total P, exchangeable nutrient cations, WHC and mi-crobial biomass. Also, while the soil properties of the Agfact, Objective and District Practice were consis-tently poorer than those of the alternative systems, the District Practice had the added problem of a tendency to become acidic.
The soil properties of the District Practice system were the poorest in terms of off-site sustainability. From the soil’s high P availability and low aggregate stability we could predict what we have already observed: it is the most likely system to produce large runoff flows with high sediment loads and P content (as yet un-published data). In contrast, the Evolving and Organic soils provide a more effective buffer between vegetable farming and the environment. They have a greater nu-trient and WHC, a potential for more effective nunu-trient cycling and more stable soil aggregates.
capac-ity remained higher. In fact it was no different to that of the alternative systems. These two largely conven-tional systems are, therefore, much less of a threat to the environment than the District Practice.
The differences in OC levels between the vegetable production systems, developed over this period, were much greater than those reported by Chan et al. (1992) after 10 years of extreme tillage and stubble manage-ment treatmanage-ments under rainfed crop production. Also, no difference in OC levels was detected between con-ventional and organic/biological systems after 6 years under broad-acre rainfed cereal/ley farming by Pen-fold et al. (1995). The rapid response to management exhibited in the vegetable farming-systems experiment reflects the intensity of horticultural production.
4.2. Comparing management — clues to the causes of the effects
Comparing the management of the systems provides insights into why the Organic and Evolving systems experienced significant improvements in such a broad range of soil properties while the three conventional systems did not. While it is not possible to unravel the many likely interactions between different man-agement practices and the history of each system, it is nevertheless useful to examine whether there are any consistent effects from applying similar practices on different systems.
Tillage did not have a consistent effect on soil prop-erties. The Organic and Agfact systems had similar tillage frequency and intensity and yet the Organic had higher MB, OC, CEC, aggregate stability, WHC and mineralisable N than the Agfact. Conversely, both the Evolving and Objective were no-till systems and yet the Objective experienced few of the improvements in soil properties that the Evolving did (this can be partly explained by the plastic-sheet mulch on the Ob-jective reducing crop residue returns to the soil). Even frequent tillage with a rotary-hoe, as used on District Practice, did not cause OC decline over three and a half years of cropping. Apparently the positive effect of increased plant productivity on the District Practice, brought about by large nutrient inputs, compensated for the negative effect of tillage. Varvel (1994), sim-ilarly, found that high productivity, from continuous cropping with high N fertiliser rates, increased soil OC and total N in spite of conventional tillage practices.
The lack of a strong tillage effect may also be soil and climate dependent: the freely-drained sandy soil and warm climate at Somersby create excellent con-ditions for oxidation of soil OC, even, presumably, in no-till soils. Carter (1992) demonstrated that, in a cool humid climate, minimum tillage systems, on a sandy loam soil, increased OC, MB and aggregate stability of surface soil relative to tillage with a mouldboard plough.
Rotations which included cover crops also did not have a consistent effect on soil properties. The Agfact, Objective and Evolving systems all had an oat cover crop prior to soil sampling (Fig. 1) but, again, the Ag-fact and Objective systems experienced few of the soil property improvements that occurred on the Evolving. Yet Adem and Tisdall (1984) found that growing a rye-grass (Lolium perenneL.) cover crop on a red-brown earth, used for vegetable farming, improved aggregate stability by 83% compared to cropped soils and 35% compared to an untilled bare control. The lack of a sim-ilar improvement in aggregate stability on the yellow earth is likely to be caused by low inherent stability due to its sandy texture. The red-brown earth studied by Adem and Tisdall (1984) had only 30% of particles of sand size (>20mm) or greater whereas the yellow earth had 77%. The red-brown earth still had an aggre-gate stability of 58% after intensive tomato production whereas the yellow earth, under the Organic and Evolv-ing systems, had an aggregate stability of only 43% after three-and-a-half years of careful management.
Likewise, other management factors such as irriga-tion, pest management and crop nutrition do not explain the different soil health of the Organic and Evolving systems. All of the systems besides the District Prac-tice had drip irrigation. Pesticides were excluded from the Organic but not on the Evolving system (similar pesticide usage occurred on the Objective and Evolv-ing systems). While both the Organic and EvolvEvolv-ing systems received large P inputs (Fig. 2) the N inputs to the Organic were less than those of the Agfact and sim-ilar to the level of the Objective system. The District Practice had the highest nutrient inputs but experienced very few soil health improvements in comparison to the Organic and Evolving.
soil health of the Organic and Evolving systems. They both received large compost additions (40 and 60 Mg ha−1,
respectively) in early 1995, approximately 10 months before soil sampling. The Agfact and District Practice systems also received organic matter additions as poul-try manure but these were considerably smaller (28 and 30 Mg ha−1, respectively) and in separate applications
at least 1 year apart. Furthermore, poultry manure is less likely to contribute to soil OC since it is very rapidly mineralised (Robinson and Sharpley, 1995).
Porter et al. (1999) also found that organic amend-ments had a greater effect on soil properties than cover crops. After only one cropping season, soil that had re-ceived 67 Mg ha−1of compost and beef cattle manure
had higher OC, CEC and aggregate stability. However they found no changes in soil properties after 3 years on soils on which a cover crop of pea, oat and hairy vetch (Vicia villosaRoth) were grown in rotation with potato (Solanum tuberosumL.).
Adem and Tisdall (1984) suggested that it was the fine roots of the earlier mentioned ryegrass cover crop, and associated fungal hyphae, that held red-brown earth soil particles into water-stable aggregates. However, this explanation appears inadequate for the yellow earth at Somersby where aggregate stability did not improve after a grass cover crop but did after large inputs of organic matter. Using the theory of Tisdall and Oades (1982), this suggests that, on the Organic and Evolv-ing systems, it was polysaccharides, produced by a larger microbial biomass, that glued soil particles to-gether and improved aggregate stability. Yet, Tisdall and Oades (1982), studying only red-brown earths, ar-gue that polysaccharides cannot influence the stability of aggregates larger than 50mm.
4.3. Phosphorus issues
The difference in availability of P fertilisers is demon-strated in the contrasting Bray P levels of the District Practice and Organic systems. Despite these systems receiving similar total P inputs (Fig. 2), the District Practice (using super phosphate and poultry manure) had a Bray P level more than two-fold higher than the Organic (using rock phosphate and compost). Yet the Bray P levels on the Organic (168 mg P kg−1) were still
more than adequate for vegetable growing: best prac-tice guidelines for growing vegetables (NSW Agricul-ture, 1997) recommend no more P fertiliser need be
applied for 1 year or longer when Bray P >150 mg P kg−1.
Reduced inputs of superphosphate on the Agfact and Objective systems also resulted in similar soil P avail-ability to that on the Organic (measured by both Bray P and P isotherms). In terms of reducing environmental impact therefore, it appears that using smaller amounts of highly available P fertiliser can be equally effective to using slowly available P sources; on this soil type at least.
The P isotherm measured on native soil showed that the soils of all the farming systems had far less capac-ity to absorb P than in their natural state. Thus, the differences in P status among the farming systems are relatively small compared to the change made from the native state to a cropping system. While the District Practice had a much greater tendency to release P to the environment than the Organic system, they are not at opposite ends of a sustainability scale.
The quantity and types of P fertiliser applied to the District Practice were comparable to practices on veg-etable farms in the Sydney region. A study of P fertiliser use on 29 vegetable farms conducted by Jinadasa et al. (1997) found mean application rates of∼450 kg P ha−1
per year and the District Practice system received, on average, 570 kg P ha−1per year. Approximately 65%
of the P was applied as poultry manure on the surveyed farms whereas on the District Practice it was 46%.
4.4. Soil acidity and salinity
The apparent decline in soil EC from the baseline state on most systems was probably due to greater leaching under irrigated vegetable production compared to previous land uses. However, applying nutrient solu-tions under a plastic mulch appeared to cause a marked increase in soil salinity on the Objective system. Ac-cording to Ayers (1977) the Objective salinity level was high enough to adversely affect the yields of tomato, spinach, cucumber and broccoli; and, according to Lorenz and Maynard (1980) it was sufficient to reduce the yield of cabbages and capsicums by more than 25%. Cornish and Nguyen (1989), on the other hand, work-ing at the same research station, found that soil EC levels similar to those on the Objective did not reduce tomato yields.
5. Conclusions
After three and a half years of vegetable cropping, the soils of the alternative systems — the Organic and Evolving — had increased OC and CEC levels, rela-tive to their baseline state. The soils of the more con-ventional systems — the District Practice, Agfact and Objective — remained generally unchanged. The Or-ganic and Evolving soils also had higher total N, to-tal P, WHC, microbial biomass and aggregate stability than the other systems. Thus, the management of the Organic and Evolving systems improved soil health whereas the management of the conventional systems did not. It appears that compost applications had the greatest effect on improving the soil health of the alter-native systems.
Also over this period, soil available P levels rose on all systems but did so far more on the highest input sys-tem, the District Practice. The low aggregate stability of this system in conjunction with its low P sorption capacity is likely to cause considerable environmental impact through loss of sediments and P during runoff events. In contrast, the management of the Agfact and Objective systems, using smaller P inputs, was able to maintain soil P availability to similar levels to those of the alternative systems. This suggests that relatively small and simple adjustments to conventional manage-ment can result in substantial environmanage-mental benefits.
This research indicates that there are different strate-gies for achieving more sustainable vegetable farming: one, more careful management of conventional systems
(resulting in less risk of losing P off-site but few other soil improvements); or two, a larger shift towards more biological systems (resulting in a broad improvement in soil health). The former approach will be easier to achieve but the latter promises a more long-term basis for sustainable production.
Acknowledgements
We are indebted to the Land and Water Resources Research and Development Corporation and the Hor-ticultural Research and Development Corporation for their generous funding and support of this research. Also, the experiment would not have been possible without the efforts of Wayne Pitt and John Heckenberg who were able to be five different types of vegetable farmer and do extensive sampling and monitoring.
References
Abbott, T.S., 1987. Soil Testing Service — Methods and Interpretation. New South Wales Department of Agriculture, Sydney.
Adem, H.H., Tisdall, J.M., 1984. Management of tillage and crop residues for double cropping in fragile soils of south-eastern Australia. Soil Tillage Res. 4, 577–589.
Ayers, R.S., 1977. Quality of water for irrigation. J. Irrig. Drainage Div. Am. Soc. Civil Eng. 103 (IR2), 135–154.
Carter, M.R., 1992. Influence of reduced tillage systems on organic matter, microbial biomass, macro-aggregate distribution and structural stability of the surface soil in a humid climate. Soil Tillage Res. 23, 361–372.
Chan, K.Y., Heenan, D.P., 1993. Effects of lupins on soil properties and wheat production. Aus. J. Agric. Res. 44, 1971–1984. Chan, K.Y., Heenan, D.P., Roberts, W.P., 1992. Organic carbon levels
and associated properties of a red earth after 10 years of rotation under different stubble and tillage practices. Aust. J. Soil Res. 30, 71–83.
Cornish, P.S., Nguyen, V.Q., 1989. Use of high soil solution electrical conductivity to improve the quality of fresh market tomatoes from coastal New South Wales. Aust. J. Exp. Agric. 29, 893–900. Cornish, P.S., Kuczera, G., Murison, J., 1992. Managing horticulture
in the Sydney basin to achieve better economic and environmental outcomes — a model for application of systems methodology. Proceedings of the Conference on Engineering in Agriculture, Albury, Institute of Engineers Australia, Canberra, pp. 357–361. Department of Planning and Community Development, 1993. Wollondilly Shire Council Agricultural Lands Study. NSW Government, Sydney, 65 pp.
Hollinger, E., Baginska, B., Cornish, P.S., 1998. Factors influencing soil and nutrient loss in storm water from a market garden. Proceedings of the 9th Australian Agronomy Conference, Wagga, Australian Society of Agronomy, Parkville, Vic., pp. 741–744.
Jaszberenyi, I., Loch, J., 1970. Soil phosphate adsorption and desorption in 0.01 M calcium chloride electrolyte. In: Hood, T.M. (Ed.), Soil and Plant Analysis in Sustainable Agriculture and Environment. Marcel Dekker, New York, pp. 279–294. Jinadasa, K.B.P.N., Milham, P.J., Hawkins, C.A., Cornish, P.S.,
Williams, C.J., Kaldor, C.J., Conroy, J.P., 1997. Survey of Cadmium levels in vegetables and soils of greater Sydney, Australia. J. Environ. Qual. 26, 924–933.
Keeney, D.R., 1982. Nitrogen — availability indices. In: Page, A.L., Miller, R.H., Keeney, D.R. (Eds.), Methods of Soil Analysis — Part 2 Chemical and Microbial Properties, 2nd Edition. American Society of Agronomy, Madison, WI, pp. 711–733.
Lorenz, O.A., Maynard, D.N., 1980. Knott’s Handbook for Vegetable Growers, 2nd Edition. Wiley, New York.
McKenzie, D.C., Thompson, A.L., Hawkins, C.A., 1997. Baseline soil data for the ‘Alternative vegetable production systems’ experiments at Somersby and Richmond. Report 2, Agricultural Resource Management Report Series, NSW Agriculture, Orange. Murison, J.A., 1995. Environmental impact of alternative horticultural systems in the Hawkesbury-Nepean catchment. Final Report for the Horticultural Research and Development Corporation, Sydney, 36 pp.
National Association for Sustainable Agriculture, Australia (NASSA) Ltd, 1993. Standards for Organic Agricultural Production. NASSA, Stirling, SA, 30 pp.
Nelson, D.W., Sommers, L.E., 1982. Total carbon, organic carbon and organic matter. In: Page, A.L., Miller, R.H., Keeney, D.R. (Eds.), Methods of Soil Analysis — Part 2 Chemical and Microbial Properties, 2nd Edition. American Society of Agronomy, Madison, WI, pp. 539–579.
NSW Agriculture, 1997. Best Practice Guidelines for Growing Vegetables. NSW Agriculture, Orange.
Penfold, C.M., Miyan, M.S., Reeves, T.G., Grierson, I.T., 1995. Biological farming for sustainable agricultural production. J. Aust. Exp. Agric. 35, 849–856.
Peverill, K.I., Sparrow, L.A., Reuter, D.J., 1999. Soil analysis: an interpretation manual. CSIRO Publishing, Collingwood, Victoria, Australia.
Porter, G.A., Opera, G.B., Bradbury, W.B., McBurnie, V.C., Sisson, J.A., 1999. Soil management and supplemental irrigation effects on Potato: I. Soil properties, tuber yield and quality. Agronomy J. 91, 416–425.
Robinson, J.S., Sharpley, A.N., 1995. Release of Nitrogen & Phosphorus from Poultry Litter. J. Environ. Qual. 24, 62–67. Stace, H., Hubble, G., Brewer, R., Northcote, K., Sleeman, J.,
Mulcahy, M., Hallsworth, E., 1972. A Handbook of Australian Soils. Rellim.
Tisdall, J.M., Oades, J.M., 1982. Organic matter and water-stable aggregates in soils. J. Soil Sci. 33, 141–163.
Varvel, G.E., 1994. Rotation and nitrogen fertilization effects on changes in soil carbon and nitrogen. Agron. J. 86, 319–325. Wu, J.T., Joergensen, R.G., Pommerening, B., Chaussod, R.,