Summary In summer 1992, isoprene emission was meas-ured on intact leaves and branches of Quercus alba (L.) at two heights in a forest canopy. Isoprene emission capacity (meas-ured at 30 °C and a photosynthetic photon flux density of 1000 µmol m−2
s−1) was significantly higher in sun leaves than in shade leaves when expressed on a leaf area basis (51 versus 31 nmol m−2 s−1; P < 0.01). Because leaf mass per unit area (LMA,
g m−2) was higher in sun leaves than in shade leaves, emissions of sun and shade leaves expressed on a dry mass basis did not differ significantly (99 versus 89 µg C gDW−1 h−1; P = 0.05).
Similar measurements in 1995 were consistent with the 1992 data, but data from leaves in more shaded locations demon-strated that isoprene emission capacity decreased with decreas-ing growth irradiance, irrespective of units of expression. Isoprene emission capacity in leaves of Q. coccinea Muenchh. and Q. velutina Lam. also declined steeply with canopy depth. Emission capacity, on a dry mass basis, showed no obvious pattern with canopy position in Q. prinus L. There was no difference in the temperature response of sun versus shade leaves of Q. alba, but shade leaves exhibited a greater quantum efficiency and saturated at lower irradiance than sun leaves. Rates of isoprene emission measured on branches of Q. alba were approximately 60% of those measured on individual leaves, as a result of self-shading within branch enclosures. It is recommended that within-canopy variation in isoprene emis-sion capacity be incorporated into regional emisemis-sion models.
Keywords: canopy, Fagaceae, hydrocarbons, oaks, Quercus alba, Quercus coccinea, Quercus prinus, Quercus velutina, volatile organic compounds, white oak.
Introduction
Isoprene is emitted from leaves of numerous plant species, including many trees (Hewitt and Street 1992, Guenther et al. 1994) and when released at significant rates is a principal reactant in the formation of tropospheric ozone in both rural (Trainer et al. 1987) and urban landscapes (Chameides et al. 1988). It is highly reactive with the hydroxyl radical and other oxidizing species and plays an important role in determining the oxidative capacity of the troposphere (Thompson 1992).
Increased understanding of the physiological and biochemi-cal controls over isoprene emission at the leaf level is neces-sary to improve our ability to predict source strengths for this important tropospheric constituent (Sharkey et al. 1991a, Monson et al. 1995). Isoprene emissions have long been known to respond to short-term changes in incident photosyn-thetic photon flux density (PPFD) (Sanadze and Kursanov 1966, Tingey et al. 1979, Monson and Fall 1989, Loreto and Sharkey 1990, Harley et al. 1996) and leaf temperature (Tingey et al. 1979, Tingey 1981, Monson and Fall 1989, Loreto and Sharkey 1990, Harley et al. 1996), and recent studies have demonstrated that the PPFD to which leaves are exposed during growth also affects their capacity to emit isoprene (Sharkey et al. 1991b, Harley et al. 1994, 1996, Litvak et al. 1996).
Because isoprene emissions are strongly dependent on inci-dent PPFD, it is necessary to characterize the light environ-ment within a forest canopy if one wishes to scale up from leaf-level measurements to regional estimates of isoprene emissions. In parameterizing a canopy emission model, it is also important to assess the amount of leaf to leaf variation in isoprene emission characteristics and to determine how leaf properties vary with canopy depth (Harley et al. 1996, Sharkey et al. 1996).
In July--August 1992 and in July 1995, we measured iso-prene fluxes in a temperate, deciduous forest in Oak Ridge, TN. In this paper, we describe measurements made on individ-ual leaves and intact branches at different canopy heights. Leaf measurements made under controlled conditions of light and temperature provided data for parameterizing a leaf-level iso-prene emission model for sun-adapted leaves at the top of the canopy and increasingly shade-adapted leaves lower down. In companion studies (Baldocchi et al. 1995, Lamb et al. 1997), these leaf-level data are incorporated into a canopy model and our ability to scale isoprene fluxes from leaves to forest canopy is evaluated by comparing model predictions with canopy-scale micrometeorological measurements of isoprene flux (Guenther et al. 1996a). In conjunction with these measure-ments, fluxes of CO2 and water vapor were measured in 1992
and modeled at both leaf and canopy scales (Baldocchi and Harley 1995, Harley and Baldocchi 1995).
Environmental controls over isoprene emission in deciduous oak
canopies
P. HARLEY, A. GUENTHER and P. ZIMMERMAN
Atmospheric Chemistry Division, National Center for Atmospheric Research, Boulder, CO 80307, USA
Received August 2, 1996
Materials and methods Site description
Measurements were made in a mixed deciduous forest domi-nated by oaks (Quercus spp.), hickories (Carya spp.) and maples (Acer spp.). The site is located on the United States Department of Energy reservation near Oak Ridge, TN (35°57′30″ N; 84°17′15″ W; elevation 365 m above sea level). Canopy height was approximately 30 m and a 44 m walk-up tower provided access to leaves of white oak (Quercus alba L.) at both canopy top and 3--5 m down in the canopy where leaves were shaded. In 1995, a vehicle with a platform on an extend-able boom provided continuous access to the canopy to a height of about 20 m, sufficient to reach sun-adapted leaves of several oak species in canopy gaps.
Experimental methods
Two sampling schemes were employed in 1992, one for assess-ing isoprene fluxes from individual leaves of Q. alba, and one for measuring branch-level emissions. To determine mean leaf-level emission rates and to establish the effects of varying light and temperature on isoprene emissions, an open-path gas exchange system (MPH-1000, Campbell Scientific, Logan, UT) was employed. Air of specified water vapor and CO2
concentration was generated by mass flow controllers (Type 825, Edwards High Vacuum International, Wilmington, MA), and passed to a temperature-controlled cuvette. The flow rate of gas entering the cuvette was measured with a mass flow meter (Type 821, Edwards High Vacuum International). Ex-cept when natural light was used, light was provided by a quartz halogen bulb (ELH 120V-300W, General Electric, Cleveland, OH) mounted in a slide projector lamp holder and directed at a Tempax cold mirror (Optical Coating Labs, Inc., Santa Rosa, CA) mounted at 45° to reflect visible light onto the cuvette. Blackened window screens were inserted in the light path to vary the intensity. To follow the diurnal pattern of isoprene emission under natural conditions, we modified the Campbell MPH-1000 to control cuvette temperature at the external air temperature, measured with a shielded thermistor (YSI, Yellow Springs, OH). Air exiting the cuvette was col-lected in 10-ml glass syringes (Dynatech, Baton Rouge, LA) and analyzed by gas chromatography.
In 1995, we used a portable photosynthesis system (LI-6400, Li-Cor, Inc., Lincoln, NE) to measure leaves of Q. alba growing in a wide range of light environments, as well as leaves from three additional oak species, Q. prinus L., Q. coc-cinea Muenchh. and Q. velutina Lam. Measurements were made from the tower, from the ground and from the platform of an extendable 20-m boom. An accessory LED light source (LI-6400-02, Li-Cor, Inc.) was employed. The cuvette was modified slightly by inserting a T-junction in the air line exiting the cuvette, thus directing air from the cuvette to the sample loop of a gas chromatograph located adjacent to the photosynthesis system.
Branch-level isoprene emission rates were also measured in 1992 with a 24-l flow-through branch enclosure, consisting of 5-mil Teflon film placed over a stainless steel wire support
frame. Ambient air was pumped through the enclosure at a rate of approximately 9 l min−1. Leaf and air temperatures inside the enclosures were measured with shielded thermistors (YSI) and incident PPFD was measured with a quantum sensor (LI-190SA, Li-Cor, Inc.) mounted next to the enclosure. Sam-ples of air entering and leaving the enclosure were collected in 10-ml glass syringes and isoprene concentration was deter-mined by gas chromatography.
Leaf area was measured for all experimental leaves (CI-201, CID, Inc., Moscow, ID) which were subsequently oven-dried at 60 °C for 48 h and weighed. Total leaf N content was determined for 1992 leaves with a carbon--nitrogen analyzer (Model NA 1500, Carlo Erba Instruments, Saddle Brook, NJ). In 1992, all samples were collected in glass syringes and injected into the 2-ml sample loop of a portable, isothermal gas chromatograph within 10 min. In 1995, air exiting the cuvette was drawn directly through the sample loop of the gas chroma-tograph. Isoprene was separated on a stainless steel column (1.3 m long × 2 mm i.d.) packed with Unibeads 3S, 60/80 mesh (Alltech Assoc., Deerfield, IL) and measured with a reduction gas detector (RGD2, Trace Analytical, Menlo Park, CA). Peak integration was accomplished with a commercial integrator (Model 3390, Hewlett-Packard, Avondale, PA). Details of this analytical system may be found in Greenberg et al. (1993). The system was calibrated several times daily against a standard cylinder containing 71 ppb (v/v) isoprene, referenced to a National Institute of Standards and Technology propane stand-ard (SRM 1660a; 1 ppm propane in N2, Rochester, NY).
Results
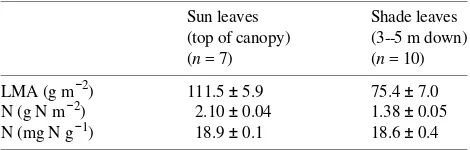
Within a tree canopy, leaf morphology and physiology change continuously with reductions in solar irradiance (Sellers et al. 1992). In 1992, because we were restricted to making meas-urements at two heights on the tower, we compared isoprene emission rates of leaves growing in full sun at the top of the canopy with those growing in a more shaded environment, 3--5 m within the canopy. The two groups of leaves differed morphologically, as evidenced by large differences in leaf mass per unit area (LMA, g m−2) (Table 1). In addition, the amount of N per unit leaf area was significantly higher in leaves at the top of the canopy than in shaded leaves; however,
Table 1. Mean values (± SE) of leaf mass per unit area (LMA) and leaf nitrogen content (N) for sun leaves of white oak at the top of the canopy and shade leaves 3--5 m down. Leaf nitrogen is expressed on both a leaf area and leaf mass basis. Mean values of LMA and N (g N m−2) for sun and shade leaves are significantly different at P = 0.01. Data are from 1992 only.
Sun leaves Shade leaves (top of canopy) (3--5 m down) (n = 7) (n = 10)
leaf N concentration expressed on a leaf dry mass basis was similar in the sun and shade leaves (Table 1).
Short-term controls over isoprene emission: temperature and PPFD
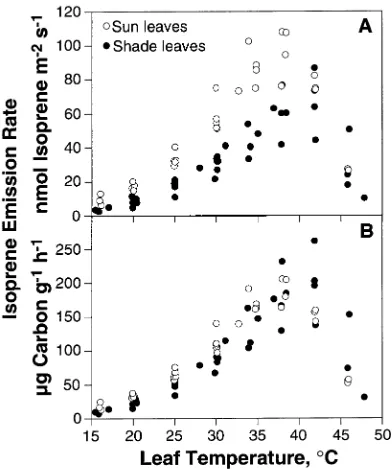
Figure 1 shows the temperature response of isoprene emission at the two canopy positions, expressed both on a leaf area (nmol isoprene m−2 s−1) and leaf dry mass basis (µg C gDW−1
h−1). Leaves growing in full sun had much higher rates of isoprene emission than shaded leaves when expressed on a leaf area basis (Figure 1A). However, because of systematic vari-ation in LMA (Table 1), these differences were substantially reduced when isoprene emission rates were expressed on a leaf dry mass basis (Figure 1B).
To compare the shape of the temperature responses of iso-prene emission of sun and shade leaves, we normalized the data in Figure 1 by assigning a value of 1.0 to the emission rate at 30 °C, and scaling other data proportionately (Figure 2), thereby generating a temperature scaling factor, CT (Guenther
et al. 1991, 1993). We used nonlinear least squares regression (Systat, Evanston, IL) to fit the response of CT to the
tempera-ture algorithm developed by Guenther et al. (1991, 1993). Because there was no apparent difference between sun and shade leaf responses to temperature, the data were pooled. For the fit shown in Figure 2, CT1 and CT2, the activation energy
and energy of deactivation, respectively, were assigned values of 78,000 and 379,800 J mol−1. The empirical coefficient T
M
was assigned a value of 315.8 K.
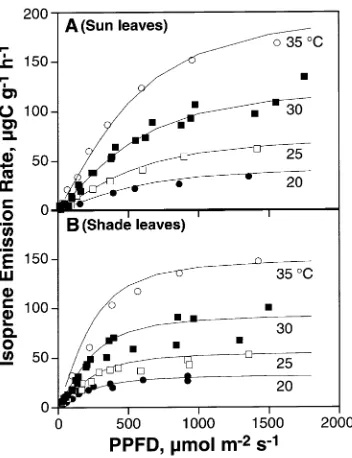
The effect of varying incident PPFD on isoprene emission rate was determined at four leaf temperatures for leaves
grow-ing in full sun at the top of the canopy (Figure 3A) and shaded leaves below (Figure 3B). Both the initial slope of the response and the light-saturated rate of isoprene emission increased with increasing leaf temperature. Isoprene emission of shade-grown leaves reached saturation at lower irradiances than that of sun leaves.
To obtain a quantitative assessment of these differences, we fit the data obtained at each temperature to the following equation, which has been used to model the effects of light on Figure 1. Rates of isoprene emission from sun and shade leaves of
white oak as a function of leaf temperature. Rates are expressed on a leaf area basis (A) and a leaf dry mass basis (B).
Figure 2. The temperature response factor (CT) as a function of leaf
temperature for leaves of white oak. Emission data are normalized to a value of 1.0 at a leaf temperature of 30 °C. Data from sun and shade leaves were pooled. Solid line is a fit to the data using the temperature algorithm of Guenther et al. (1993) with model parameters determined from these data.
CO2-saturated rates of photosynthesis (Smith 1937, Harley
et al. 1992),
I= QY PPFD
√
1 +QY2 PPFD2 (Imax)2
, (1)
where I is isoprene emission rate, QY is quantum yield (µmol isoprene per mol of incident photons) and Imax is the predicted
rate of emission as PPFD → ∞. The resulting fits (Figure 3) were obtained using the values of QY and Imax in Table 2. There
were large differences in Imax between sun and shade leaves at
a given temperature. Quantum yield clearly increased with leaf temperature, but there was no consistent difference in QY between sun and shade leaves.
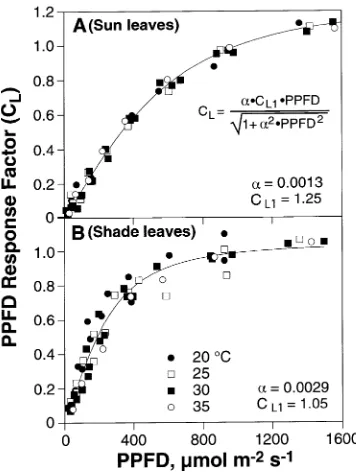
There were strong interactions between PPFD and leaf tem-perature. However, when a light response factor, CL, was
gen-erated by normalizing the data to a value of 1.0 at PPFD = 1000 µmol m−2 s−1, the effects of leaf temperature on isoprene
emission rate were eliminated (Figure 4). The initial slope of the CL response was significantly higher for shade leaves than
for sun leaves. This is a result of the normalization procedure, in which emission rates of sun leaves, which have a higher emission rate than shade leaves at PPFD = 1000 µmol m−2
s−1, are divided by a larger number, thereby depressing the initial slope of the normalized response. Normalized data obtained over a range of leaf temperatures were fit to an algorithm describing CL developed by Guentheret al.(1993). The
result-ing fits are shown in Figure 4, where CL1 is the value of CL as
PPFD → ∞ and α is an empirical fitting factor.
If we define isoprene emission capacity (IS) as the rate of
isoprene emission when PPFD = 1000 µmol m−2
s−1 and leaf temperature = 30 °C, then the effects of light and temperature on isoprene emission rate (I) may be combined in a single expression:
I= ISCT CL. (2)
In Figure 3, each set of light curves obtained at a different temperature was fit independently to Equation 1. Figure 5 depicts a simulation of the same data (expressed on a leaf dry mass basis) using Equation 2. Values of CT were obtained from
fits to data in Figure 2 (sun and shade leaf data pooled) and values of CL were obtained from fits to data in Figure 4 (sun
and shade leaves treated separately). The values of IS used for
sun and shade leaf simulations were 98.9 and 88.7 µg C g−1 h−1, respectively, the mean values for all measured leaves (Table 3).
Diurnal patterns of isoprene emission, measured approxi-mately every 15 min, are shown for a leaf growing at the top of the canopy (Figure 6A) and a leaf within the canopy (Fig-ure 6B). Both PPFD and leaf temperat(Fig-ure were meas(Fig-ured con-currently (Figures 6C and 6D). The measured values of IS for
the sun and shade leaves were 95.7 and 68.0 µg C g−1 h−1,
respectively. Equation 2 was used to predict isoprene emission rates as PPFD and leaf temperature varied through the day, using values of CT and CL obtained from fits to data in Figures
Table 2. Values for quantum yield (QY) and maximum rate of isoprene emission (Imax) providing the best least squares fit to Equation 1, based on
data collected at each leaf temperature in Figure 3.
Quantum yield Imax
µmol mol−1 nmol m−2 s−1
Leaf 20 25 30 35 20 25 30 35
temperature (°C)
Sun leaves 27 48 81 148 19.6 37.1 66.1 96.3
(top of canopy)
Shade leaves 42 52 82 107 10.7 16.6 31.5 50.9
(3--5 m down)
Figure 4. The light response factor (CL) as a function of incident PPFD
2 and 4. Correspondence between measured and modeled isoprene emissions was good for the sun leaf, but isoprene emissions for the shade leaf were underestimated in the after-noon.
Long-term controls over isoprene emission capacity: canopy position
We used the 1992 cuvette data collected at 30 °C and PPFD = 1000 µmol m−2
s−1 to calculate mean values of isoprene emis-sion capacity (IS) for sun leaves at the top of the canopy and
shade leaves growing 3--5 m within the canopy (Table 3). On a leaf area basis, the mean emission capacity of leaves growing
within the canopy was 40% less than that of sun leaves at the canopy top (P < 0.01). On a dry mass basis, emission rates from sun leaves were 11% higher on average than emission rates from shade leaves, but the difference was not significant (P > 0.10).
In 1995, measurements on white oak were extended to include leaves from a wide range of growth light environments, including leaves of seedlings, saplings, and leaves at lower canopy positions than in 1992. We did not characterize the light environment for each leaf measured, but made the as-sumption that LMA was directly related to growth irradiance. When IS was plotted versus LMA, using data from both 1992
and 1995 (Figure 7), IS increased with increasing LMA, and
the correlation was stronger on a leaf area basis (Figure 7A; r2 = 0.80) than on a dry mass basis (Figure 7B; r2 = 0.30). Isoprene emission rates expressed per unit area varied sixfold within the canopy, whereas rates on a dry mass basis varied two- to threefold.
In many earlier studies, isoprene emission rates were deter-mined using branch enclosures. In 1992, we compared iso-prene emission rates obtained using individual leaf enclosures with those obtained using a branch enclosure. Numerous measurements were made from a branch enclosure at the top of the canopy and a shaded branch enclosure within the can-opy. Because these enclosures lacked environmental control, incident PPFD and leaf temperature varied widely. To facilitate comparisons between these measured rates and rates deter-mined using the controlled cuvette systems, values of CT and
CL were calculated for sun and shade leaves, using the values
of PPFD and leaf temperature at the time of each measurement. We then inverted Equation 2 and solved for IS, given the
measured values of isoprene emission.As PPFD decreased to low values or leaf temperature increased above the temperature optimum, the values of CL and CT declined; as either value
became very small, the calculation of IS became increasingly
prone to large errors. Consequently, data collected at PPFDs below 100 µmol m−2
s−1 or at temperatures exceeding 39 °C were eliminated from our analysis. Pooling the results from all other measurements, we arrived at mean estimates of IS for
branches at two canopy levels (Table 3).
Table 3. Summary of measurements made in 1992 on sunlit and shaded leaves and branches of white oak. Isoprene emission capacity (PPFD = 1000 µmol m−2 s−1 and leaf temperature of 30 °C) is given in two sets of units. For uncontrolled branch enclosures, only data collected when PPFD > 100 µmol m−2 s−1 and leaf temperature < 39 °C were used in the analysis.
Type of Height in IS IS
measurement canopy (m) (µg C g−1 h−1) (nmol m−2 s−1)
Leaf cuvette Sun leaves at top 24--25 98.9 ± 4.6 50.8 ± 2.7
with of canopy (n = 8) (n = 8) (n = 8)
environmental Shade leaves 3--5 m 19--22 88.7 ± 4.2 30.5 ± 1.8
control down (n = 8) (n = 8) (n = 8)
Branch enclosure Branch at top 24 58.5 ± 13.5 24.5 ± 5.7
without of canopy (n = 1) (n = 7) (n = 7)
environmental Branch 3 m 21 49.7 ± 26.8 17.5 ± 9.4
control down (n = 1) (n = 27) (n = 27)
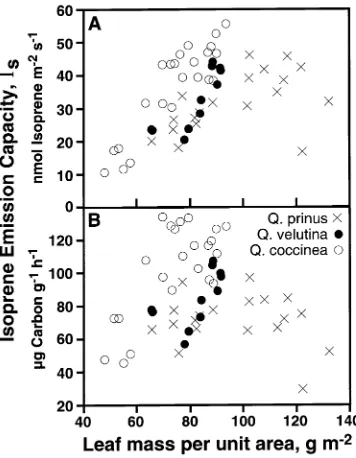
In 1995, isoprene emission data were collected on three other oak species and related to LMA (Figure 8). The range of variation in emission capacity in leaves of Q. coccinea was similar to that of Q. alba (Figure 7), and IS increased with
increasing LMA. There was only a two- to two and a half-fold variation in emission rates of Q. velutina (n = 11) and Q. prinus
(n = 19) irrespective of how rates were expressed, although it should be noted that the sample size was less than for either Q. alba (n = 60) or Q. coccinea (n = 23). The range of variation in LMA was also much less in Q. velutina, perhaps because fully sun-adapted leaves were not accessible. When expressed on a dry mass basis, IS appeared to be independent of LMA
and, presumably, canopy position for leaves of Q. prinus. Figure 8. Isoprene emission capacity of leaves of three oak species at various heights in a canopy as a function of leaf mass per unit area. Emission capacity (emission rate at 30 °C and PPFD = 1000 µmol m−2 s−1) is expressed on both a leaf area basis (A) and a dry mass basis (B).
Figure 7. Isoprene emission capacity of leaves at various heights in a Quercus alba canopy as a function of leaf mass per unit area. Data from both 1992 and 1995 are shown, and emission capacity (emission rate at 30 °C and PPFD = 1000 µmol m−2 s−1) is expressed on both a leaf area basis (A) and a dry mass basis (B). The data are divided into three compartments, representing the three layers used in a canopy radiation transfer model.
Discussion
Short-term controls over isoprene emission: temperature and PPFD
Variations in PPFD and leaf temperature constitute the primary short-term controls over isoprene emission (Monson et al. 1995). In common with other studies (Tingey 1981, Monson and Fall 1989, Loreto and Sharkey 1990, Guenther et al. 1991, Harley et al. 1996), isoprene emission rates were strongly temperature dependent (Figure 1), increasing exponentially to an optimum between 38 and 40 °C. In this study, the Q10 for
isoprene emission exceeded 3.5 between 15 and 30 °C. Above the optimum temperature, emission rates declined sharply, and above approximately 40 °C, it was impossible to obtain steady-state rates. The algorithm developed by Guenther et al. (1991) to model the temperature response of isoprene emission ade-quately described our data. In contrast to the findings reported for sweetgum (Liquidambar styraciflua L.) (Harley et al. 1996), there was no apparent difference in the temperature dependency for sun and shade leaves of white oak.
Our results (Figure 3, Table 2) on the interactive effects of light and temperature on isoprene emission extend the meas-urements made on velvet bean by Monson et al. (1992), in which both the initial slope of the light response and the light-saturated emission rate increased between 26 and 34 °C. Although the light response of isoprene emission is superfi-cially similar to that of net photosynthesis, the interaction between light and temperature for isoprene synthesis differs from that for photosynthesis. If photorespiration is eliminated by measuring under conditions of high CO2 or low O2,
quan-tum yield of photosynthesis becomes independent of tempera-ture (Ehleringer and Björkman 1977). The finding that both the initial slope and the maximum rate of isoprene emission in-crease with increasing temperature supports the suggestion of Monson et al. (1992) that isoprene emission is controlled primarily by isoprene synthase activity. Even under low light conditions, isoprene synthase activity, rather than products of the light reactions, appears to limit isoprene production. Nev-ertheless, isoprene production increases with increasing light, suggesting that enzyme activation is controlled, directly or indirectly, by PPFD.
Tingey (1981) concluded that light and temperature effects on isoprene emission were independent and could not be modeled by a single expression. However, Equation 2 de-scribed the measured responses to PPFD and temperature and their interactions extremely well (Figure 5), and simulated the measured diurnal pattern of isoprene emission in Figure 6.
Long-term effects of growth light environment and canopy position
In the 1992 study, sun leaves had significantly higher rates of isoprene emission than shade leaves when isoprene emission was expressed on a leaf area basis (Figure 1A, Table 3). However, because sun leaves had significantly higher LMA than leaves lower in the canopy (Table 1), when rates were converted to a leaf dry mass basis, the difference between the two groups of leaves was not significant. It is possible that the
differences in leaf-area-based emission rates between sun and shade leaves in 1992 resulted from significantly different amounts of N per unit leaf area (Table 1). However, differences in N content also resulted from differences in leaf morphology, because mean N concentrations of sun and shade leaves were identical when N was expressed per unit mass (Table 1).
In 1995, we did not characterize the light environment in which each experimental leaf was growing, but assumed that LMA decreased with depth in canopy, as indicated by the 1992 data. When plotted against LMA, the 1992 and 1995 white oak data were indistinguishable (Figure 7). Furthermore, the 1995 data confirmed the roles of canopy position and light environ-ment on isoprene emission capacity indicated by the 1992 data. There was as much as a sixfold increase in isoprene emission capacity, expressed per unit leaf area, with increasing LMA, and LMA and IS were highly correlated (r2 = 0.80). The effect
of canopy position on isoprene emission capacity in leaves of Q. coccinea and Q. velutina (Figure 8) was similar to that of white oak, but canopy position exerted less control in leaves of Q. prinus.
When expressed on a leaf mass basis, the range of variation in IS in white oak leaves was reduced to two- to threefold.
Although there was a positive relationship between IS and
LMA, the relationship was weak (r2 = 0.30). The range of variation in IS was similarly reduced in leaves of Q. coccinea
and Q. velutina. When expressed on a leaf mass basis, IS in
Q. prinus was independent of canopy position, i.e., variation in IS, expressed per unit leaf area, was fully explained by
vari-ation in LMA.
Differences in the capacity for isoprene emission on a leaf area basis were largely, but not entirely, the result of changes in LMA with depth in canopy. The observed reductions in LMA are an expected result of acclimation to reduced growth irradiance (cf. Boardman 1977, Jurik 1986); Geron et al. (1994) assumed a 37% decrease in LMA between the top and bottom of a deciduous canopy. Such changes will always tend to increase the rates of physiological processes of shade-adapted leaves versus sun-shade-adapted leaves, when rates are con-verted from an area to a mass basis. Thus, within a sugar maple (Acer saccharum L.) canopy, Ellsworth and Reich (1993) found that twofold reductions in net photosynthesis and nitro-gen concentration, both expressed on a per unit area basis, were almost completely explained by a parallel decrease in LMA, and similar results were found in a Nothofagus fusca (Hook. f.) Ørst. canopy (Hollinger 1996). Photosynthetic rates in white oak followed a similar pattern (Harley and Baldocchi 1995).
capacity within the canopy are sharply reduced, but not elimi-nated, when expressed per unit dry mass. Harley et al.(1996) found that isoprene emission capacity declined significantly with depth in a sweetgum canopy, even when rates were expressed on a dry mass basis. Litvak et al.(1996) found that isoprene emission rates were significantly lower in saplings of white oak and aspen (Populus tremuloides Michx.) grown in reduced light, although the percentage reduction was substan-tially less if rates were expressed on a dry mass rather than a leaf area basis.
On modeling canopy emissions
We are confident in our ability to predict leaf-level behavior if leaf temperature, PPFD and emission capacity are known (Figure 6; see also Guenther et al.(1996b)). In a whole-canopy context, therefore, it is critical to characterize accurately changes in PPFD and leaf temperature with depth in the can-opy, and to determine the impact of within-canopy variation in isoprene emission capacity.
Because of the strong PPFD dependency of isoprene emis-sion, Pierce and Waldruff (1991) and Lamb et al. (1993) developed multiple-layer canopy light-extinction models to calculate PPFD values used to drive isoprene emission at different canopy depths. They did not incorporate within-can-opy variation in leaf morphology or isoprene emission capac-ity. Geron et al. (1994) investigated the importance of leaf biomass distribution within a canopy, and found that a dispro-portionate share of isoprene emitting biomass typically occurs in the upper canopy layers where PPFD is higher. As a result, model flux estimates increased by about 10% if LMA was allowed to vary realistically. Harley et al.(1996) used a radia-tion transfer model to estimate the effects on canopy isoprene flux of including realistic variations in both leaf morphology and isoprene emission capacity within a sweetgum canopy.
Although the range of variation in both isoprene emission capacity and LMA is less for white oak than for sweetgum, a similar exercise using the canopy radiation transfer model of Norman (1982) and our white oak data confirms this conclu-sion. Leaf area index (LAI) was assumed to be 4.5, and the canopy was divided into three layers of equal LAI. The sunlit and shaded leaf fraction in each layer was calculated, assuming a solar elevation of 60° and a realistic average leaf angle of 60°, and the mean PPFD incident on sunlit and shaded leaves in each layer was calculated. Isoprene emission capacities were assigned to each layer based on data in Figure 7. Leaves with LMA above 92.2 g m−2 were assigned to the top layer, those between 92.2 and 66.5 to the middle layer, and those below 66.5 to the bottom layer. Mean values of isoprene emission capacity for leaves in each layer were then assigned to the entire layer (top: 47.6; middle: 32.2; bottom: 18.9 nmol iso-prene m−2 s−1). Assuming full sunlight above the canopy and uniform leaf temperatures of 30 °C, the model predicts a canopy scale emission rate of 21.8 mg C m−2 (ground) h−1. Sixty percent of the total flux originated from the top canopy layer (28 and 12% from the middle and bottom layers, respec-tively). However, if values for sun leaves were assigned to all leaves in the canopy, the simulated canopy flux was
overesti-mated by 31%. Although these values will change depending on leaf angle distribution, total LAI, solar angle, and other factors, they demonstrate that models should incorporate within-canopy variation in isoprene emission capacity. The range of variation depends on the units of expression, because over half the variation in rates expressed on a leaf area basis results from parallel changes in LMA. Whichever units are employed, it is important to present LMA data to allow con-version between units.
Guentheret al.(1994) assigned to oaks an isoprene emission capacity of 70 ± 35 µg C g−1
h−1. The rates of isoprene emission capacity for sun leaves of three of the four oak species in our study were at the upper end of that range (mean ± SE): Q. alba = 99.3 ± 5.0 (n = 15); Q. coccinea = 114.5 ± 4.5 (n = 10); Q. prinus = 70.7 ± 6.4 (n = 10); and Q. velutina = 97.0 ± 4.1 µg C g−1
h−1 (n = 6). This represents the largest data set of isoprene emission by oaks under controlled conditions, and justifies raising the emission capacity of these trees to at least 90 µg C g−1
h−1 (cf. Sharkey et al. 1996).
Although current emission models (Geron et al. 1994, Bal-docchi et al. 1995, Guenther et al. 1995, Lamb et al. 1997) are parameterized using leaf-level data, many earlier measure-ments of isoprene emission were obtained using branch enclo-sures, in which self-shading occurs (Guenther et al. 1994). Thus, rates determined for branches tend to be considerably lower than rates determined on individual leaves (Table 3). If branch-level data are used to parameterize emission models, therefore, rates need to be adjusted upward to compensate for the shading effect. For our data, the ratio of leaf to branch emission capacities is 1.69 for sun leaves and 1.78 for shade leaves, bracketing the value of 1.75 used by Guentheret al. (1994) to convert from branch to leaf estimates.
Acknowledgments
This research was supported in part by the U.S. Environmental Protec-tion Agency (Interagency Agreement DW49935389-01-0), and the Southern Oxidants Study (Southern Oxidants Research Program on Emissions and Effects). The National Center for Atmospheric Re-search is sponsored by the National Science Foundation.
References
Baldocchi, D.D. and P.C. Harley. 1995. Scaling carbon dioxide and water vapour exchange from leaf to canopy in a deciduous forest. II. Model testing and application. Plant Cell Environ. 18:1157--1173.
Baldocchi, D., A. Guenther, P. Harley, L. Klinger, P. Zimmerman, B. Lamb and H. Westberg. 1995. The fluxes and air chemistry of isoprene above a deciduous hardwood forest. Philos. Trans. R. Soc. Lond. A. 350:279--296.
Boardman, N.K. 1977. Comparative photosynthesis of sun and shade plants. Annu. Rev. Plant Physiol. 28:355--377.
Chameides, W., R. Lindsay, J. Richardson and C. Kiang. 1988. The role of biogenic hydrocarbons in urban photochemical smog: At-lanta as a case study. Science 241:1473--1475.
Ehleringer, J. and O. Björkman. 1977. Quantum yields for CO2 uptake
in C3 and C4 plants. Dependence on temperature, CO2 and O2
concentration. Plant Physiol. 59:86--90.
Ellsworth, D.S. and P.B. Reich. 1993. Canopy structure and vertical patterns of photosynthesis and related leaf traits in a deciduous forest. Oecologia 96:169--178.
Gates, D.M. 1968. Transpiration and leaf temperature. Annu. Rev. Plant Physiol. 19:211--238.
Geron, C.D., A.B. Guenther and T.E. Pierce. 1994. An improved model for estimating emissions of volatile organic compounds from forests in the eastern United States. J. Geophys. Res. 99:12,773--12,791.
Greenberg, J.P., P.R. Zimmerman, B.E. Taylor, G.M. Silver and R. Fall. 1993. Sub-parts per billion detection of isoprene using a reduction gas detector with a portable gas chromatograph. Atmos. Environ. 27A:2689--2692.
Guenther, A., R. Monson and R. Fall. 1991. Isoprene and monoterpene emission rate variability: Observations with Eucalyptus and emis-sion rate algorithm development. J. Geophys. Res. 96:10,799--10,808.
Guenther, A., P. Zimmerman, P. Harley, R. Monson and R. Fall. 1993. Isoprene and monoterpene emission rate variability: Model evalu-ation and sensitivity analysis. J. Geophys. Res. 98:12,609--12,617. Guenther, A., P. Zimmerman and M. Wildermuth. 1994. Natural vola-tile organic compound emission rate estimates for U.S. woodland landscapes. Atmos. Environ. 28:1197--1210.
Guenther, A.B., C.N. Hewitt, D. Erickson, R. Fall, C. Geron, T. Graedel, P. Harley, L. Klinger, M. Lerdau, W.A. McKay, T. Pierce, R. Scholes, R. Steinbrecher, R. Tallamraju, J. Taylor and P. Zimmerman. 1995. A global model of natural volatile organic compound emissions. J. Geophys. Res. 100:8873--8892.
Guenther, A., W. Baugh, K. Davis, G. Hampton, P. Harley, L. Klinger, P. Zimmerman, E. Allwine, S. Dilts, B. Lamb, H. Westberg, D. Bal-docchi, C. Geron and T. Pierce. 1996a. Isoprene fluxes measured by enclosure, relaxed eddy accumulation, surface-layer gradient, mixed-layer gradient, and mass balance techniques. J. Geophys. Res. 101:18,555--18,567.
Guenther, A., J. Greenberg, P. Harley, D. Helmig, L. Klinger, L. Vier-ling, P. Zimmerman and C. Geron. 1996b. Leaf, branch, stand, and landscape scale measurements of volatile organic compound fluxes from U.S. woodlands. Tree Physiol. 16:17--24.
Harley, P.C. and D.D. Baldocchi. 1995. Scaling carbon dioxide and water vapor exchange from leaf to canopy in a deciduous forest. I. Leaf level parameterization. Plant Cell Environ. 18:1146--1156.
Harley, P.C., R.B. Thomas, J.F. Reynolds and B.R. Strain. 1992. Modelling the effects of growth in elevated CO2 on photosynthesis
in cotton. Plant Cell Environ. 15:271--282.
Harley, P.C., M.E. Litvak, T.D. Sharkey and R.K. Monson. 1994. Isoprene emission from velvet bean leaves. Interactions among nitrogen availability, growth photon flux density, and leaf develop-ment. Plant Physiol. 105:279--285.
Harley, P., A. Guenther and P. Zimmerman. 1996. Effects of light, temperature and canopy position on net photosynthesis and iso-prene emission from sweetgum (Liquidambar styraciflua L.) leaves. Tree Physiol. 16:25--32.
Hewitt, C.N. and R.A. Street. 1992. A qualitative assessment of the emission of non-methane hydrocarbon compounds from the bio-sphere to the atmobio-sphere in the U.K.: present knowledge and uncertainties. Atmos. Environ. 26A:3069--3077.
Hollinger, D.Y. 1996. Optimality and nitrogen allocation in a tree canopy. Tree Physiol. 16:627--634.
Jurik, T.W. 1986. Temporal and spatial patterns of specific leaf weight in successional northern hardwood tree species. Am. J. Bot. 73:1083--1092.
Lamb, B., D. Gay and H. Westberg. 1993. A biogenic hydrocarbon emission inventory for the USA using a simple forest canopy model. Atmos. Environ. 27:1673--1690.
Lamb, B., E. Allwine, S. Dilts, H. Westberg, T. Pierce, C. Geron, D. Baldocchi, A. Guenther, L. Klinger, P. Harley and P. Zimmer-man. 1997. Evaluation of forest canopy models for estimating isoprene emissions. J. Geophys. Res. 101:22,787--22,797. Litvak, M.E., F. Loreto, P.C. Harley, T.D. Sharkey and R.K. Monson.
1996. The response of isoprene emission rate and photosynthetic rate to photon flux and nitrogen supply in aspen and white oak trees. Plant Cell Environ. 19:549--559.
Loreto, F. and T.D. Sharkey. 1990. A gas-exchange study of photosyn-thesis and isoprene emission in Quercus rubra L. Planta 182:523--531.
Monson, R. and R. Fall. 1989. Isoprene emission from aspen leaves. Influence of environment and relation to photosynthesis. Plant Physiol. 90:267--274.
Monson, R., C. Jaeger, W. Adams, E. Driggers, G. Silver and R. Fall. 1992. Relationships among isoprene emission rate, photosynthesis, and isoprene synthase activity as influenced by temperature. Plant Physiol. 92:1175--1180.
Monson, R.K., M.T. Lerdau, T.D. Sharkey, D.S. Schimel and R. Fall. 1995. Biological aspects of constructing volatile compound emis-sion inventories. Atmos. Environ. 29:2989--3002.
Norman, J. 1982. Simulation of microclimates. In Biometeorology in Integrated Pest Management. Eds. J.L. Hatfield and I.J. Thomason. Academic Press, New York, pp 65--99.
Pierce, T. and P. Waldruff. 1991. PC-BEIS: A personal computer version of the biogenic emissions inventory system. J. Air Waste Manage. Assoc. 41:937--941.
Sanadze, G.A. and A.L. Kursanov. 1966. On certain conditions of the evolution of the diene C5H8 from poplar leaves. Soviet Plant
Physiol. 13:184--189.
Sharkey, T.D., F. Loreto and C.F. Delwiche. 1991a. The biochemistry of isoprene emission from leaves during photosynthesis. In Trace Gas Emissions by Plants. Eds. T.D. Sharkey, E.A. Holland and H.A. Mooney. Academic Press, San Diego, pp 153--184.
Sharkey, T.D., F. Loreto and C.F. Delwiche. 1991b. High carbon dioxide and sun/shade effects on isoprene emission from oak and aspen tree leaves. Plant Cell Environ. 14:333--338.
Sharkey, T.D., E.L. Singsaas, P.J. Vanderveer and C. Geron. 1996. Field measurements of isoprene emission from trees in response to temperature and light. Tree Physiol. 16:649--654.
Smith, E. 1937. The influence of light and carbon dioxide on photo-synthesis. Gen. Physiol. 20:807--830.
Thompson, A.M. 1992. The oxidizing capacity of the earth’s atmos-phere: probable past and future changes. Science 256:1157--1165. Tingey, D. 1981. The effect of environmental factors on the emission
of biogenic hydrocarbons from live oak and slash pine. In Atmos-pheric Biogenic Hydrocarbons. Eds. J. Bufalini and R. Arnts. But-terworth, Stoneham, MA, pp 53--72.
Tingey, D.T., M. Manning, L.C. Grothaus and W.F. Burns. 1979. The influence of light and temperature on isoprene emission rates from live oaks. Physiol. Plant. 47:112--118.