LAMPIRAN A
FORMAT KUISIONER PENELITIAN
ANALISA PEMILIHAN MODA TRANSPORTASI BUS DENGAN METODE
STATED PREFERENCE
(STUDI KASUS : MEDAN-SIDIKALANG)
A.
1. Lokasi survei : Stasiun Bus DATRA Stasiun Bus BTN
Diisi oleh surveyor
2. Tanggal : ………..
3. Hari : Kerja Libur 4. Waktu : Pagi (06.00-11.00 WIB)
Siang (12.00-14.00 WIB Sore (15.00-17.00 WIB) B.
1. Data Responden Diisi oleh Responden
Nama : ………
Jenis Kelamin : Pria Perempuan
Umur : ……tahun
Pendidikan Terakhir : SD Akademi
SLTP Diploma
SLTA Sarjana
Status : Sudah Menikah Belum Menikah
Pekerjaan : ……….
2. Apakah Anda pernah menggunakan bus BTN maupun bus DATRA dalam perjalanan Medan-Sidikalang ?
Ya, kedua-duanya pernah Ya, salah satunya pernah 3. Dari kedua angkutan diatas, mana yang lebih sering Anda gunakan ?
Bus BTN Bus DATRA
4. Latar belakang/alasan Anda menggunakan Moda diatas ?
Pertimbangan kecepatan/waktu Pertimbangan kemudahan Pertimbangan keselamatan/keamanan Pertimbangan harga (murah) Pertimbangan kenyamanan
5. Apa maksud perjalanan Anda ?
Bisnis/bekerja Belanja
Pendidikan
Lain-lain………..(tuliskan) Berlibur/rekreasi
6. Berapa frekuensi rata-rata Anda menggunakan angkutan bus BTN ?
Seminggu…….kali Setahun………..kali
Sebulan………kali
7. Berapa frekuensi rata-rata Anda menggunakan bus DATRA ?
Seminggu…….kali Setahun………..kali
Sebulan………kali
8. Kendaraan pribadi yang Anda miliki ?
10. Berapa lama waktu yang dibutuhkan untuk mencapai tujuan (Medan – Sidikalang)? Menggunakan DATRA ±3.5 jam ±4.5 jam ±4 jam Menggunakan BTN ±3.5 jam ±4.5 jam ±4 jam ±5 jam
11. Berapa lama waktu yang anda butuhkan untuk sampai ke stasion bus dari rumah? Menggunakan DATRA ±5 menit ±15 menit ±10 menit ±lain-lain…..(tuliskan) Menggunakan BTN ±5 menit ±15 menit ±10 menit ± lain-lain…..(tuliskan)
1. PERUBAHAN PADA ATRIBUT BIAYA PERJALANAN (COST)
(KONDISI ATRIBUT LAINNYA TETAP)
SILAHKAN DIJAWAB DI KOLOM INI
Biaya
Biaya
POINT RATING
perjalanan
perjalanan Pasti pilih
Mungkin
pilih
Pilihan
Mungkin
pilih
Pasti pilih
bus
DATRA
bus BTN
bus
DATRA
bus DATRA
berimbang
bus BTN
bus BTN
(Rupiah)
(Rupiah)
1
2
3
4
5
a
30.000
30.000
b
30.000
32.500
c
30.000
35.000
d
32.500
30.000
e
35.000
30.000
2. PERUBAHAN PADA ATRIBUT WAKTU TEMPUH PERJALANAN (TIME)
(KONDISI ATRIBUT LAINNYA TETAP)
Waktu
Waktu
SILAHKAN DIJAWAB DI KOLOM INI
Tempuh
Tempuh
POINT RATING
perjalanan
perjalanan
Pasti pilih
Mungkin
pilih
Pilihan
Mungkin
pilih
Pasti pilih
bus
DATRA
bus BTN
bus DATRA bus DATRA berimbang
bus BTN
bus BTN
(jam)
(jam)
1
2
3
4
5
a
4.5
4
b
4.5
4.5
c
4.5
5
d
5.0
4
e
5.5
4
3. PERUBAHAN PADA ATRIBUT JADWAL KEBERANGKATAN (HEADWAY)
(KONDISI ATRIBUT LAINNYA TETAP)
4. PERUBAHAN PADA ATRIBUT KENYAMANAN PELAYANAN BUS (SERVICE)
(KONDISI ATRIBUT LAINNYA TETAP)
SILAHKAN DIJAWAB DI KOLOM INI
Kenyamanan
Kenyamanan
POINT RATING
Pelayanan
Pelayanan
Pasti
pilih
Mungkin
pilih
Pilihan
Mungkin
pilih
Pasti pilih
bus DATRA
bus BTN
bus
DATRA
bus DATRA berimbang
bus BTN
bus BTN
1
2
3
4
5
a
Tetap
Aqua
b
Tetap
Aqua, Musik
c
Tetap
Aqua, Musik,
Ketenangan
sopir saat
mengemudi
d
Aqua
Tetap
e Aqua, Musik
Tetap
SILAHKAN DIJAWAB DI KOLOM INI
Jadwal
Jadwal
POINT RATING
Keberangkatan Keberangkatan Pasti pilih
Mungkin
pilih
Pilihan
Mungkin
pilih
Pasti pilih
bus DATRA
bus BTN
bus
DATRA
bus DATRA berimbang
bus BTN
bus BTN
(jam)
(jam)
1
2
3
4
5
a
Tiap 1/2 jam
Tiap 1/2 jam
b
Tiap 1/2 jam
Tiap 1 jam
c
Tiap 1/2 jam
Tiap 2 jam
d
Tiap 1 jam
Tiap 1/2 jam
5. PERUBAHAN PADA ATRIBUT LAMA/WAKTU PERJALANAN MENUJU STASION
(TIME ACCES)
(KONDISI ATRIBUT LAINNYA TETAP)
SILAHKAN DIJAWAB DI KOLOM INI
Lama
Perjalanan
Lama
Perjalanan
POINT RATING
Menuju
Stasion
Menuju
Stasion
Pasti pilih
Mungkin
pilih
Pilihan
Mungkin
pilih
Pasti pilih
bus DATRA
bus BTN
bus
DATRA
bus DATRA berimbang
bus BTN
bus BTN
(menit)
(menit)
1
2
3
4
5
a
10
10
b
10
20
c
10
30
d
20
10
e
30
10
LAMPIRAN B
Penentuan Ukuran Sampel
Berdasarkan hasil pilot survey terhadap 50 responden, masing-masing
responden menjawab 26 option pada kelima pilihan atribut, baik itu atribut yang
dinaikkan ataupun diturunkan.
Jumlah option responden terkumpul = 50x 26 = 1300
Tabel Acuan menentukan jumlah sampel : probabilitas individu memilih bus
DATRA atau bus BTN.
No.
Makna Pilihan
Pr (Bus
DATRA)
Jumlah
n.p
(p-prerata)
n(p-
(p)
Responden
(n)
prerata)²
A
Pasti pilih Bus DATRA
0.9
561
504.9
0.4
89.76
B
Mungkin pilih Bus DATRA
0.7
104
72.8
0.2
4.16
C
Pilihan Berimbang
0.5
45
22.5
0
0
D
Mungkin pilih Bus BTN
0.3
148
44.4
-0.2
5.92
E
Pasti pilih Bus BTN
0.1
442
44.2
-0.4
70.72
Jumlah total
1300
688.8
170.56
Probabilitas rata-rata sampel, prerata = 688,8/1300
= 0.5
Variasi sampel,
σ
2α
=
∑
n
(
p
−
p
rerata) (
2/
n
−
1
)
= 0.131301001
Standar deviasi sampel,
σ
=
∑
n
.
(
p
−
p
rerata) (
2/
n
−
1
)
= 0.3623548
Asumsi tingkat keberartian (level of significant),
α/2
= 0.05 (5%)
Maka, dari tabel normal t diperoleh Za/2
= 1.96
Jumlah responden
26
n
= 49
Syarat minimal data yang dapat disebarkan kepada responden adalah 49
individu. Data yang diambil untuk disebarkan kepada responden, ambil : 100
LAMPIRAN C
Kompilasi Data
1. Variabel Bebas (Independent Variable)
Cost (X
1)
=
Selisih biaya perjalanan (bus DATRA-bus BTN)
Time (X2)
=
Selisih waktu tempuh perjalanan (bus DATRA-bus
BTN)
Headway (X3) =
Selisih jadwal keberangkatan (bus DATRA-bus BTN)
Service (X4)
=
Selisih tingkat pelayanan (bus DATRA-bus BTN)
Time Acces (X
5) =
Selisih waktu perjalanan menuju stasiun (bus
DATRA-bus BTN)
2. Variabel Tidak Bebas (Dependent Variable)
Adalah skala numerik yang diperoleh melalui transportasi logit biner pada
probabilitas masing-masing point rating.
3. Skala Numerik
Point
Rating
Skala Standart
Pr (DATRA)
Skala Numerik
A
0.9
R1 = 2.1972
B
0.7
R2 = 0.8473
C
0.5
R3 = 0.0000
E
0.1
R5 = -2.1972
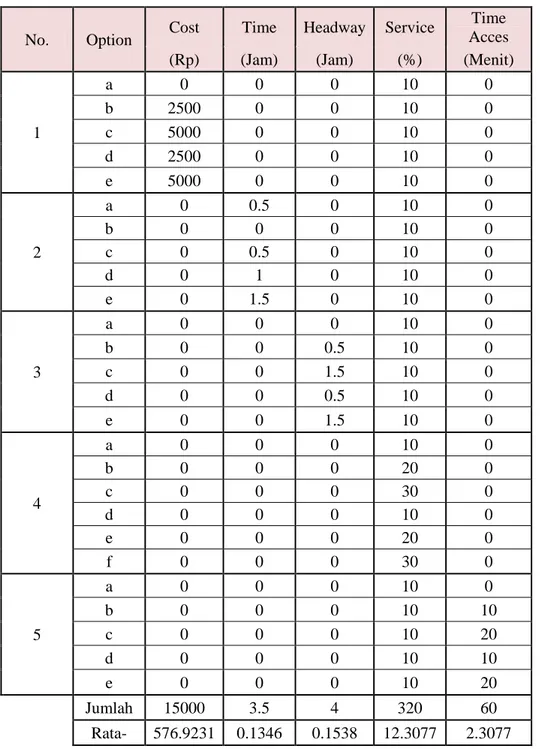
LAMPIRAN D
Tabel Nilai Rata-rata Atribut
No.
Option
Cost
Time
Headway
Service
Time
Acces
(Rp)
(Jam)
(Jam)
(%)
(Menit)
1
a
0
0
0
10
0
b
2500
0
0
10
0
c
5000
0
0
10
0
d
2500
0
0
10
0
e
5000
0
0
10
0
2
a
0
0.5
0
10
0
b
0
0
0
10
0
c
0
0.5
0
10
0
d
0
1
0
10
0
e
0
1.5
0
10
0
3
a
0
0
0
10
0
b
0
0
0.5
10
0
c
0
0
1.5
10
0
d
0
0
0.5
10
0
e
0
0
1.5
10
0
4
a
0
0
0
10
0
b
0
0
0
20
0
c
0
0
0
30
0
d
0
0
0
10
0
e
0
0
0
20
0
f
0
0
0
30
0
5
a
0
0
0
10
0
b
0
0
0
10
10
c
0
0
0
10
20
d
0
0
0
10
10
e
0
0
0
10
20
Jumlah
15000
3.5
4
320
60
Rata-
576.9231
0.1346
0.1538
12.3077
2.3077
rata
LAMPIRAN E
Sensitivitas Atribut Cost
Nilai Rata-rata Selisih Atribut (DATRA-BTN)
U(DATRA-BTN)
Cost
Time
Headway
Service
Waktu Menuju
Pr(DATRA)
(Rp)
(jam)
(jam)
(%)
Station (menit)
25000
0.1346
0.1538
12.3077
2.3077
-0.0119
0.4970
20000
0.1346
0.1538
12.3077
2.3077
0.0381
0.5095
15000
0.1346
0.1538
12.3077
2.3077
0.0881
0.5220
10000
0.1346
0.1538
12.3077
2.3077
0.1381
0.5345
5000
0.1346
0.1538
12.3077
2.3077
0.1881
0.5469
0
0.1346
0.1538
12.3077
2.3077
0.2381
0.5592
-5000
0.1346
0.1538
12.3077
2.3077
0.2881
0.5715
-10000
0.1346
0.1538
12.3077
2.3077
0.3381
0.5837
-15000
0.1346
0.1538
12.3077
2.3077
0.3881
0.5958
-20000
0.1346
0.1538
12.3077
2.3077
0.4381
0.6078
-25000
0.1346
0.1538
12.3077
2.3077
0.4881
0.6197
LAMPIRAN F
Sensitivitas Atribut Time
Nilai Rata-rata Selisih Atribut (DATRA-BTN)
U(DATRA-BTN)
Pr(DATRA)
Cost
Time
Headway
Service
Waktu Menuju
(Rp)
(jam)
(jam)
(%)
Station (menit)
5000
5
0.1538
12.3077
2.3077
-3.9815
0.0183
5000
4
0.1538
12.3077
2.3077
-3.1245
0.0421
5000
3
0.1538
12.3077
2.3077
-2.2675
0.0938
5000
2
0.1538
12.3077
2.3077
-1.4105
0.1961
5000
1
0.1538
12.3077
2.3077
-0.5535
0.3650
5000
-5
0.1538
12.3077
2.3077
4.5885
0.9899
LAMPIRAN G
Sensitivitas Atribut Headway
Nilai Rata-rata Selisih Atribut (DATRA-BTN)
U(DATRA-BTN)
Cost
Time
Headway
Service
Waktu Menuju
Pr(DATRA)
(Rp)
(jam)
(jam)
(%)
Station (menit)
5000
0.1346
5
12.3077
2.3077
-0.2044
0.4491
5000
0.1346
4
12.3077
2.3077
-0.1234
0.4692
5000
0.1346
3
12.3077
2.3077
-0.0424
0.4894
5000
0.1346
2
12.3077
2.3077
0.0386
0.5096
5000
0.1346
1
12.3077
2.3077
0.1196
0.5299
5000
0.1346
0
12.3077
2.3077
0.2006
0.5500
5000
0.1346
-1
12.3077
2.3077
0.2816
0.5699
5000
0.1346
-2
12.3077
2.3077
0.3626
0.5897
5000
0.1346
-3
12.3077
2.3077
0.4436
0.6091
5000
0.1346
-4
12.3077
2.3077
0.5246
0.6282
5000
0.1346
-5
12.3077
2.3077
0.6056
0.6469
LAMPIRAN H
Sensitivitas Atribut Service
Nilai Rata-rata Selisih Atribut (DATRA-BTN)
U(DATRA-BTN)
Pr(DATRA
)
Cost
Time
Headwa
y
Servic
e
Waktu Menuju
(Rp)
(jam)
(jam)
(%)
Station (menit)
5000
0.1346
0.1538
25
2.3077
0.4800
0.6178
5000
0.1346
0.1538
20
2.3077
0.3650
0.5903
5000
0.1346
0.1538
15
2.3077
0.2500
0.5622
5000
0.1346
0.1538
10
2.3077
0.1350
0.5337
5000
0.1346
0.1538
5
2.3077
0.0200
0.5050
5000
0.1346
0.1538
0
2.3077
-0.0950
0.4763
5000
0.1346
0.1538
-5
2.3077
-0.2100
0.4477
5000
0.1346
0.1538
-10
2.3077
-0.3250
0.4195
5000
0.1346
0.1538
-15
2.3077
-0.4400
0.3917
5000
0.1346
0.1538
-20
2.3077
-0.5550
0.3647
5000
0.1346
0.1538
-25
2.3077
-0.6700
0.3385
LAMPIRAN I
Sensitivitas Atribut Time Acces
Nilai Rata-rata Selisih Atribut (DATRA-BTN)
U(DATRA
-BTN)
Pr(DATRA
)
Cost
Time
Headway
Service
Waktu Menuju
(Rp)
(jam)
(jam)
(%)
Station (menit)
5000
0.1346
0.1538
12.3077
10
-0.1658
0.4587
5000
0.1346
0.1538
12.3077
8
-0.0737
0.4816
5000
0.1346
0.1538
12.3077
6
0.0183
0.5046
5000
0.1346
0.1538
12.3077
4
0.1103
0.5275
5000
0.1346
0.1538
12.3077
2
0.2023
0.5504
5000
0.1346
0.1538
12.3077
0
0.2943
0.5730
5000
0.1346
0.1538
12.3077
-2
0.3863
0.5954
5000
0.1346
0.1538
12.3077
-4
0.4783
0.6173
5000
0.1346
0.1538
12.3077
-6
0.5703
0.6388
5000
0.1346
0.1538
12.3077
-8
0.6623
0.6598
5000
0.1346
0.1538
12.3077
10
-0.1658
0.4587
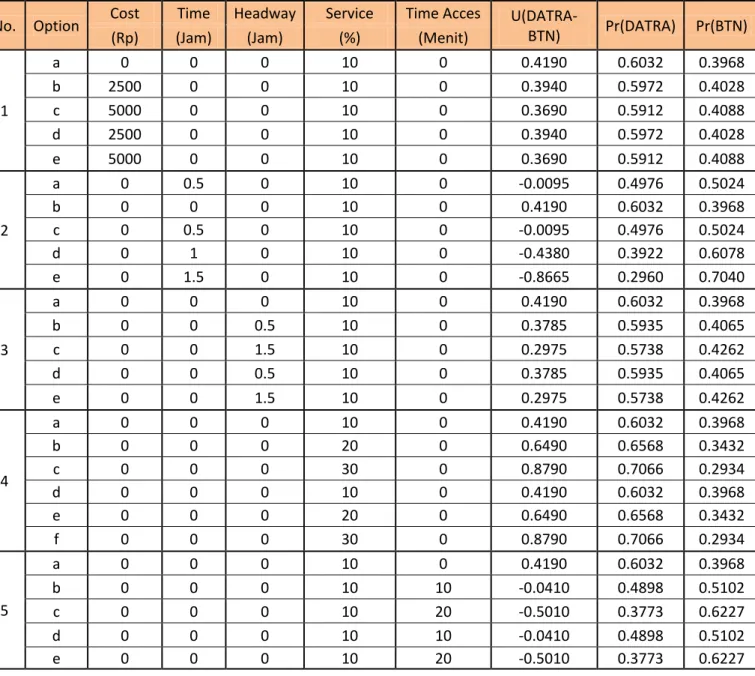
LAMPIRAN J
Tabel Pemilihan Moda
No.
Option
Cost
Time
Headway
Service
Time Acces
U(DATRA-
BTN)
Pr(DATRA)
Pr(BTN)
(Rp)
(Jam)
(Jam)
(%)
(Menit)
1
a
0
0
0
10
0
0.4190
0.6032
0.3968
b
2500
0
0
10
0
0.3940
0.5972
0.4028
c
5000
0
0
10
0
0.3690
0.5912
0.4088
d
2500
0
0
10
0
0.3940
0.5972
0.4028
e
5000
0
0
10
0
0.3690
0.5912
0.4088
2
a
0
0.5
0
10
0
-0.0095
0.4976
0.5024
b
0
0
0
10
0
0.4190
0.6032
0.3968
c
0
0.5
0
10
0
-0.0095
0.4976
0.5024
d
0
1
0
10
0
-0.4380
0.3922
0.6078
e
0
1.5
0
10
0
-0.8665
0.2960
0.7040
3
a
0
0
0
10
0
0.4190
0.6032
0.3968
b
0
0
0.5
10
0
0.3785
0.5935
0.4065
c
0
0
1.5
10
0
0.2975
0.5738
0.4262
d
0
0
0.5
10
0
0.3785
0.5935
0.4065
e
0
0
1.5
10
0
0.2975
0.5738
0.4262
4
a
0
0
0
10
0
0.4190
0.6032
0.3968
b
0
0
0
20
0
0.6490
0.6568
0.3432
c
0
0
0
30
0
0.8790
0.7066
0.2934
d
0
0
0
10
0
0.4190
0.6032
0.3968
e
0
0
0
20
0
0.6490
0.6568
0.3432
f
0
0
0
30
0
0.8790
0.7066
0.2934
5
a
0
0
0
10
0
0.4190
0.6032
0.3968
b
0
0
0
10
10
-0.0410
0.4898
0.5102
c
0
0
0
10
20
-0.5010
0.3773
0.6227
d
0
0
0
10
10
-0.0410
0.4898
0.5102
e
0
0
0
10
20
-0.5010
0.3773
0.6227
Untuk tingkat signitifikansi 0.05 tercetak di garis atas
Untuk tingkat signitifikansi 0.01 tercetak di baris bawah
LAMPIRAN K
DISTRIBUSI T
LAMPIRAN L
DISTRIBUSI T
Proporsi dalam satu ekor
df
0.25
0.1
0.05
0.025
0.01
0.005
Derajat Kebebebasan Numerator
df
1
2
3
4
5
6
7
8
9
10
11
12
14
16
20
48
4.04 3.19 2.80 2.56 2.41 2.30 2.21 2.14 2.08 2.03 1.99 1.96 1.90 1.86 1.79
7.19 5.08 4.22 3.74 3.42 3.20 3.04 2.90 2.80 2.71 2.64 2.58 2.48 2.40 2.28
50
4.03 3.18 2.79 2.56 2.40 2.29 2.20 2.13 2.07 2.02 1.98 1.95 1.90 1.85 1.78
7.17 5.06 4.20 3.72 3.41 3.18 3.02 2.88 2.78 2.70 2.62 2.56 2.46 2.39 2.26
55
4.02 3.17 2.78 2.51 2.38 2.27 2.18 2.11 2.05 2.00 1.97 1.93 1.88 1.83 1.76
7.12 5.01 4.16 3.68 3.37 3.15 2.98 2.85 2.75 2.66 2.59 2.53 2.43 2.35 2.23
60
4.00 3.15 2.76 2.52 2.37 2.25 2.17 2.10 2.04 1.99 1.95 1.92 1.86 1.81 1.75
7.08 4.98 4.13 3.65 3.34 3.12 2.95 2.82 2.72 2.63 2.56 2.50 2.40 2.32 2.20
65
3.99 3.14 2.75 2.51 2.36 2.24 2.15 2.08 2.02 1.98 1.94 1.90 1.85 1.80 1.73
7.04 4.95 4.10 3.62 3.31 3.09 2.93 2.79 2.70 2.61 2.54 2.47 2.37 2.30 2.18
70
3.98 3.13 2.74 2.50 2.35 2.23 2.14 2.07 2.01 1.97 1.93 1.89 1.84 1.79 1.72
7.01 4.92 4.08 3.60 3.29 3.07 2.91 2.77 2.67 2.59 2.51 2.45 2.35 2.28 2.15
80
3.96 3.11 2.72 2.48 2.33 2.21 2.12 2.05 1.99 1.95 1.91 1.88 1.82 1.77 1.70
6.96 4.88 4.01 3.56 3.25 3.04 2.87 2.74 2.64 2.55 2.48 2.41 2.32 2.24 2.11
100
3.94 3.07 2.70 2.46 2.30 2.19 2.10 2.03 1.97 1.92 1.88 1.85 1.79 1.75 1.68
6.84 4.78 3.98 3.51 3.20 2.99 2.82 2.69 2.59 2.51 2.43 2.36 2.26 2.19 2.06
125
3.91 3.07 2.68 2.44 2.29 2.17 2.08 2.01 1.95 1.90 1.86 1.83 1.77 1.72 1.65
6.81 4.78 3.94 3.47 3.17 2.95 2.79 2.65 2.56 2.47 2.40 2.33 2.23 2.15 2.03
150
3.89 3.06 2.67 2.43 2.27 2.16 2.07 2.00 1.94 1.89 1.85 1.82 1.76 1.71 1.60
6.81 4.75 3.91 3.41 3.44 2.92 2.76 2.62 2.53 2.44 2.37 2.30 2.20 2.12 2.00
200
3.89 3.04 2.65 2.41 2.26 2.11 2.05 1.98 1.92 1.87 1.83 1.80 1.74 1.69 1.62
6.76 4.71 3.88 3.41 3.11 2.90 2.73 2.60 2.50 2.41 2.34 2.28 2.17 2.09 1.97
400
3.86 3.02 2.62 2.39 2.23 2.12 2.03 1.96 1.90 1.85 1.81 1.78 1.72 1.67 1.60
6.70 4.66 3.83 3.36 3.06 2.85 2.69 2.55 2.46 2.37 2.25 2.23 2.12 2.04 1.92
1000 3.85 3.00 2.61 2.38 2.22 2.10 2.02 1.95 1.89 1.84 1.80 1.76 1.70 1.65 1.58
6.66 4.62 3.80 3.31 3.04 2.82 2.66 2.53 2.43 2.34 2.26 2.20 2.09 2.01 1.89
3.84 2.99 2.60 2.37 2.21 2.09 2.04 1.94 1.88 1.83 1.79 1.75 1.69 1.64 1.57
6.64 4.60 3.78 2.32 3.02 2.80 2.64 2.54 2.41 2.32 2.24 2.18 2.07 1.99 1.87
Proporsi dalam dua ekor
0.5
0.2
0.1
0.05
0.02
0.01
1
1
3.078
6.314
12.706
31.812
63.657
2
0.816
1.886 2.920
4.303
6.965
9.925
3
0.765
1.638 2.353
3.182
4.541
5.841
4
0.741
1.533 2.132
2.776
3.747
4.604
5
0.727
1.473 2.015
2.571
3.365
4.032
6
0.718
1.44 1.943
2.447
3.143
3.707
7
0.711
1.415 1.895
2.365
2.998
3.499
8
0.706
1.397 1.860
2.306
2.896
3.355
9
0.703
1.383 1.833
2.262
2.821
3.25
10
0.7
1.372 1.812
2.228
2.764
3.169
11
0.697
1.363 1.769
2.201
2.718
3.106
12
0.695
1.356 1.782
2.179
2.781
3.055
13
0.694
1.35 1.771
2.16
2.65
3.012
14
0.692
1.345 1.761
2.145
2.624
2.977
15
0.691
1.341 1.753
2.131
2.602
2.947
16
0.69
1.337 1.746
2.12
2.583
2.921
17
0.689
1.333 1.740
2.11
2.567
2.898
18
0.688
1.33 1.734
2.101
2.552
2.878
19
0.688
1.328 1.729
2.093
2.539
2.861
20
0.687
1.325 1.725
2.086
2.528
2.845
21
0.686
1.323 1.712
2.08
2.518
2.831
22
0.686
1.321 1.717
2.074
2.508
2.819
23
0.685
1.319 1.714
2.069
2.5
2.807
24
0.685
1.318 1.711
2.064
2.492
2.797
25
0.684
1.316 1.708
2.06
2.485
2.787
26
0.684
1.315 1.706
2.056
2.479
2.779
27
0.684
1.314 1.703
2.052
2.473
2.771
28
0.683
1.313 1.701
2.048
2.467
2.763
29
0.683
1.311 1.699
2.045
2.462
2.756
30
0.683
1.31 1.697
2.042
2.457
2.75
40
0.681
1.303 1.684
2.021
2.423
2.704
60
0.679
1.296 1.671
2
2.39
2.66
120
0.677
1.289 1.658
1.98
2.358
2.617
@
0.674
1.282 1.645
1.96
2.326
2.576
LAMPIRAN M
Hasil Kalibrasi Persamaan
Alternatif 1
Regression
Descriptive Statistics .295407 1.9284938 2600 .00 1550.732 2600 SK ALA _NILAI_NUMERIK COSTMean St d. Deviat ion N
Correlations 1.000 -.109 -.109 1.000 . .000 .000 . 2600 2600 2600 2600 SK ALA _NILAI_NUMERIK COST SK ALA _NILAI_NUMERIK COST SK ALA _NILAI_NUMERIK COST Pearson Correlation Sig. (1-tailed) N SK ALA _ NILAI_
Variables Entered/Removedb COSTa . Enter Model 1 Variables Entered Variables Removed Method
All requested variables entered. a.
Dependent Variable: SKALA_NILAI_NUMERIK b. Model Summaryb .109a .012 .011 1.9174226 Model 1 R R Square Adjusted R Square Std. Error of the Estimate Predictors: (Constant), COST
a.
Dependent Variable: SKALA_NILAI_NUMERIK b. ANOVAb 114.338 1 114.338 31.100 .000a 9551.572 2598 3.677 9665.910 2599 Regres sion Residual Total Model 1 Sum of
Squares df Mean S quare F Sig.
Predic tors: (Constant), COS T a.
Dependent Variable: SK ALA _NILAI_NUMERIK b.
Coefficientsa .295 .038 7.856 .000 .222 .369 .000 .000 -.109 -5. 577 .000 .000 .000 (Const ant) COST Model 1 B St d. E rror Unstandardized Coeffic ient s Beta St andardiz ed Coeffic ient s
t Sig. Lower Bound Upper Bound
95% Confidenc e Interval for B
Dependent Variable: SK ALA_NILAI_NUMERIK a. Residuals Statisticsa -.380873 .971686 .295407 .2097457 2600 -3. 224 3.224 .000 1.000 2600 .038 .127 .047 .025 2600 -.392226 .985642 .295375 .2098344 2600 -3. 16889 2.5780728 .0000000 1.9170537 2600 -1. 653 1.345 .000 1.000 2600 -1. 656 1.348 .000 1.000 2600 -3. 18284 2.5894265 .0000317 1.9184924 2600 -1. 657 1.348 .000 1.000 2600 .000 10.396 1.000 2.799 2600 .000 .006 .000 .001 2600 .000 .004 .000 .001 2600
Predic ted V alue St d. P redic ted Value St andard E rror of Predic ted V alue
Adjust ed P redicted Value Residual
St d. Residual St ud. Residual Deleted Residual St ud. Deleted Residual Mahal. Dis tanc e Cook's Dis tanc e
Centered Leverage Value
Minimum Maximum Mean St d. Deviat ion N
Dependent Variable: SK ALA _NILAI_NUMERIK a.
Hasil Kalibrasi Persamaan
Alternatif 2
Regression
Descriptive Statistics .295407 1.9284938 2600 .096 .3675 2600 SK ALA _NILAI_NUMERIK TIMEMean St d. Deviat ion N
Correlations 1.000 -.157 -.157 1.000 . .000 .000 . 2600 2600 2600 2600 SK ALA _NILAI_NUMERIK TIME SK ALA _NILAI_NUMERIK TIME SK ALA _NILAI_NUMERIK TIME Pearson Correlation Sig. (1-tailed) N SK ALA _ NILAI_
Variables Entered/Removedb TIMEa . Enter Model 1 Variables Entered Variables Removed Method
All requested variables entered. a.
Dependent Variable: SKALA_NILAI_NUMERIK b. ANOVAb 239.266 1 239.266 65.942 .000a 9426.645 2598 3.628 9665.910 2599 Regres sion Residual Total Model 1 Sum of
Squares df Mean S quare F Sig.
Predic tors: (Constant), TIME a.
Dependent Variable: SK ALA _NILAI_NUMERIK b. Coefficientsa .375 .039 9.706 .000 .299 .451 -.826 .102 -.157 -8. 120 .000 -1. 025 -.626 (Const ant) TIME Model 1 B St d. E rror Unstandardized Coeffic ient s Beta St andardiz ed Coeffic ient s
t Sig. Lower Bound Upper Bound
95% Confidenc e Interval for B
Dependent Variable: SK ALA_NILAI_NUMERIK a.
Residuals Statisticsa -.863717 .787637 .295407 .3034150 2600 -3. 820 1.622 .000 1.000 2600 .039 .148 .047 .024 2600 -.882194 .791814 .295357 .3035884 2600 -2. 98484 3.0609174 .0000000 1.9044757 2600 -1. 567 1.607 .000 1.000 2600 -1. 568 1.612 .000 1.000 2600 -2. 98901 3.0793939 .0000500 1.9058891 2600 -1. 569 1.612 .000 1.000 2600 .068 14.594 1.000 2.988 2600 .000 .008 .000 .001 2600 .000 .006 .000 .001 2600
Predic ted V alue St d. P redic ted Value St andard E rror of Predic ted V alue
Adjust ed P redicted Value Residual
St d. Residual St ud. Residual Deleted Residual St ud. Deleted Residual Mahal. Dis tanc e Cook's Dis tanc e
Centered Leverage Value
Minimum Maximum Mean St d. Deviat ion N
Dependent Variable: SK ALA _NILAI_NUMERIK a.
Hasil Kalibrasi Persamaan
Alternatif 3
Regression
Descriptive Statistics Mean Std. Deviation N SKALA_NILAI_NUMERIK .295407 1.9284938 2600 HEADWAY -.115 .4232 2600 Correlations 1.000 -.037 -.037 1.000 . .030 .030 . 2600 2600 2600 2600 SK ALA _NILAI_NUMERIK HE ADWAY SK ALA _NILAI_NUMERIK HE ADWAY SK ALA _NILAI_NUMERIK HE ADWAY Pearson Correlation Sig. (1-tailed) N SK ALA _ NILAI_Variables Entered/Removedb HEADWAYa . Enter Model 1 Variables Entered Variables Removed Method
All requested variables entered. a.
Dependent Variable: SKALA_NILAI_NUMERIK b. Model Summaryb .037a .001 .001 1.9275468 Model 1 R R Square Adjusted R Square Std. Error of the Estimate Predictors: (Constant), HEADWAY
a.
Dependent Variable: SKALA_NILAI_NUMERIK b. ANOVAb 13.206 1 13.206 3.554 .060a 9652.705 2598 3.715 9665.910 2599 Regres sion Residual Total Model 1 Sum of
Squares df Mean S quare F Sig.
Predic tors: (Constant), HEA DW AY a.
Coefficientsa .276 .039 7.043 .000 .199 .353 -.168 .089 -.037 -1. 885 .060 -.344 .007 (Const ant) HE ADWAY Model 1 B St d. E rror Unstandardized Coeffic ient s Beta St andardiz ed Coeffic ient s
t Sig. Lower Bound Upper Bound
95% Confidenc e Interval for B
Dependent Variable: SK ALA_NILAI_NUMERIK a. Residuals Statisticsa .191745 .528645 .295407 .0712811 2600 -1. 454 3.272 .000 1.000 2600 .039 .129 .048 .024 2600 .189339 .540978 .295505 .0715573 2600 -2. 72585 2.0054550 .0000000 1.9271760 2600 -1. 414 1.040 .000 1.000 2600 -1. 417 1.041 .000 1.000 2600 -2. 73818 2.0078611 -.0000981 1.9286446 2600 -1. 418 1.041 .000 1.000 2600 .074 10.707 1.000 2.833 2600 .000 .005 .000 .001 2600 .000 .004 .000 .001 2600
Predic ted V alue St d. P redic ted Value St andard E rror of Predic ted V alue
Adjust ed P redicted Value Residual
St d. Residual St ud. Residual Deleted Residual St ud. Deleted Residual Mahal. Dis tanc e Cook's Dis tanc e
Centered Leverage Value
Minimum Maximum Mean St d. Deviat ion N
Dependent Variable: SK ALA _NILAI_NUMERIK a.
Hasil Kalibrasi Persamaan
Alternatif 4
Regression
Descriptive Statistics .295407 1.9284938 2600 7.69 11.202 2600 SK ALA _NILAI_NUMERIK SE RVICEMean St d. Deviat ion N
Correlations 1.000 .127 .127 1.000 . .000 .000 . 2600 2600 2600 2600 SK ALA _NILAI_NUMERIK SE RV ICE SK ALA _NILAI_NUMERIK SE RV ICE SK ALA _NILAI_NUMERIK SE RV ICE Pearson Correlation Sig. (1-tailed) N SK ALA _ NILAI_
Variables Entered/Removedb SERVICEa . Enter Model 1 Variables Entered Variables Removed Method
All requested variables entered. a.
Dependent Variable: SKALA_NILAI_NUMERIK b. Model Summaryb .127a .016 .016 1.9131294 Model 1 R R Square Adjusted R Square Std. Error of the Estimate Predictors: (Constant), SERVICE
a.
Dependent Variable: SKALA_NILAI_NUMERIK b. ANOVAb 157.064 1 157.064 42.913 .000a 9508.846 2598 3.660 9665.910 2599 Regres sion Residual Total Model 1 Sum of
Squares df Mean S quare F Sig.
Predic tors: (Constant), SERVICE a.
Dependent Variable: SK ALA _NILAI_NUMERIK b.
Coefficientsa .127 .046 2.781 .005 .037 .216 .022 .003 .127 6.551 .000 .015 .029 (Const ant) SE RV ICE Model 1 B St d. E rror Unstandardized Coeffic ient s Beta St andardiz ed Coeffic ient s
t Sig. Lower Bound Upper Bound
95% Confidenc e Interval for B
Dependent Variable: SK ALA_NILAI_NUMERIK a. Residuals Statisticsa -.531736 .784940 .295407 .2458304 2600 -3. 365 1.991 .000 1.000 2600 .038 .132 .048 .023 2600 -.544734 .790648 .295323 .2459251 2600 -2. 98214 2.7289357 .0000000 1.9127613 2600 -1. 559 1.426 .000 1.000 2600 -1. 560 1.430 .000 1.000 2600 -2. 98785 2.7419341 .0000834 1.9142110 2600 -1. 561 1.430 .000 1.000 2600 .042 11.321 1.000 2.504 2600 .000 .005 .000 .001 2600 .000 .004 .000 .001 2600
Predic ted V alue St d. P redic ted Value St andard E rror of Predic ted V alue
Adjust ed P redicted Value Residual
St d. Residual St ud. Residual Deleted Residual St ud. Deleted Residual Mahal. Dis tanc e Cook's Dis tanc e
Centered Leverage Value
Minimum Maximum Mean St d. Deviat ion N
Dependent Variable: SK ALA _NILAI_NUMERIK a.
Hasil Kalibrasi Persamaan
Alternatif 5
Regression
Descriptive Statistics .295407 1.9284938 2600 .00 6.203 2600 SK ALA _NILAI_NUMERIK TIME_ACCESMean St d. Deviat ion N
Correlations 1.000 -.149 -.149 1.000 . .000 .000 . 2600 2600 2600 2600 SK ALA _NILAI_NUMERIK TIME_ACCES SK ALA _NILAI_NUMERIK TIME_ACCES SK ALA _NILAI_NUMERIK TIME_ACCES Pearson Correlation Sig. (1-tailed) N SK ALA _ NILAI_
Variables Entered/Removedb TIME_ ACCE Sa . Enter Model 1 Variables Entered Variables Removed Method
All request ed variables entered. a.
Dependent Variable: S KALA_NILAI_NUMERIK b. Model Summaryb .149a .022 .022 1.9073969 Model 1 R R Square Adjusted R Square Std. Error of the Estimate Predictors: (Constant), TIME_ACCES
a.
Dependent Variable: SKALA_NILAI_NUMERIK b. ANOVAb 213.963 1 213.963 58.811 .000a 9451.947 2598 3.638 9665.910 2599 Regres sion Residual Total Model 1 Sum of
Squares df Mean S quare F Sig.
Predic tors: (Constant), TIME _ACCE S a.
Coefficientsa .295 .037 7.897 .000 .222 .369 -.046 .006 -.149 -7. 669 .000 -.058 -.034 (Const ant) TIME_ACCES Model 1 B St d. E rror Unstandardized Coeffic ients Beta St andardiz ed Coeffic ients
t Sig. Lower Bound Upper Bound
95% Confidenc e Int erval for B
Dependent Variable: SK ALA _NILAI_NUMERIK a. Residuals Statisticsa -.629717 1.220530 .295407 .2869238 2600 -3. 224 3.224 .000 1.000 2600 .037 .126 .047 .025 2600 -.642166 1.235581 .295411 .2870250 2600 -3. 41773 2.8269169 .0000000 1.9070299 2600 -1. 792 1.482 .000 1.000 2600 -1. 796 1.485 .000 1.000 2600 -3. 43278 2.8393664 -.0000047 1.9084096 2600 -1. 797 1.486 .000 1.000 2600 .000 10.396 1.000 2.799 2600 .000 .007 .000 .001 2600 .000 .004 .000 .001 2600
Predic ted V alue St d. P redic ted Value St andard E rror of Predic ted V alue
Adjust ed P redicted Value Residual
St d. Residual St ud. Residual Deleted Residual St ud. Deleted Residual Mahal. Dis tanc e Cook's Dis tanc e
Centered Leverage Value
Minimum Maximum Mean St d. Deviat ion N
Dependent Variable: SK ALA _NILAI_NUMERIK a.
Hasil Kalibrasi Persamaan
Alternatif 28
Regression
Descriptive Statistics .295407 1.9284938 2600 .00 1550.732 2600 .096 .3675 2600 7.69 11.202 2600 .00 6.203 2600 SK ALA _NILAI_NUMERIK COST TIME SE RVICE TIME_ACCESMean St d. Deviat ion N
Variables Entered/Removedb TIME_ ACCE S, SE RV ICE, COST, TIMEa . Enter Model 1 Variables Entered Variables Removed Method
All request ed variables entered. a.
Dependent Variable: S KALA_NILAI_NUMERIK b.
Correlations 1.000 -.109 -.157 .127 -.149 -.109 1.000 .000 .000 .000 -.157 .000 1.000 .054 .000 .127 .000 .054 1.000 .000 -.149 .000 .000 .000 1.000 . .000 .000 .000 .000 .000 . .500 .500 .500 .000 .500 . .003 .500 .000 .500 .003 . .500 .000 .500 .500 .500 . 2600 2600 2600 2600 2600 2600 2600 2600 2600 2600 2600 2600 2600 2600 2600 2600 2600 2600 2600 2600 2600 2600 2600 2600 2600 SK ALA _NILAI_NUMERIK COST TIME SE RV ICE TIME_ACCES SK ALA _NILAI_NUMERIK COST TIME SE RV ICE TIME_ACCES SK ALA _NILAI_NUMERIK COST TIME SE RV ICE TIME_ACCES Pearson Correlation Sig. (1-tailed) N SK ALA _ NILAI_
NUME RIK COST TIME SE RV ICE TIME_ACCES
Model Summaryb .278a .077 .076 1.8539293 Model 1 R R Square Adjust ed R Square St d. E rror of the Es timate Predic tors: (Constant), TIME_A CCE S, SERVICE, COST, TIME
a.
Dependent Variable: S KALA_NILAI_NUMERIK b.
ANOVAb 746.755 4 186.689 54.317 .000a 8919.155 2595 3.437 9665.910 2599 Regres sion Residual Total Model 1 Sum of
Squares df Mean S quare F Sig.
Predic tors: (Constant), TIME _ACCE S, S ERV ICE , COST, TIME a.
Dependent Variable: SK ALA _NILAI_NUMERIK b. Coefficientsa .198 .045 4.412 .000 .110 .286 .000 .000 -.109 -5.768 .000 .000 .000 -.864 .099 -.165 -8.721 .000 -1.059 -.670 .023 .003 .136 7.220 .000 .017 .030 -.046 .006 -.149 -7.890 .000 -.058 -.035 (Constant) COST TIME SERVICE TIME_ACCES Model 1 B Std. Error Unstandardized Coefficients Beta Standardized Coefficients
t Sig. Lower Bound Upper Bound 95% Confidence Interval for B
Dependent Variable: SKALA_NILAI_NUMERIK a.
Residuals Statisticsa -.863717 1.357802 .295407 .5360262 2600 -2. 162 1.982 .000 1.000 2600 .038 .144 .074 .034 2600 -.882194 1.373619 .295376 .5362613 2600 -3. 55500 3.0609174 .0000000 1.8525021 2600 -1. 918 1.651 .000 .999 2600 -1. 922 1.656 .000 1.000 2600 -3. 57082 3.0793939 .0000308 1.8560336 2600 -1. 923 1.657 .000 1.000 2600 .117 14.594 3.998 4.410 2600 .000 .003 .000 .001 2600 .000 .006 .002 .002 2600
Predic ted V alue St d. P redic ted Value St andard E rror of Predic ted V alue
Adjust ed P redicted Value Residual
St d. Residual St ud. Residual Deleted Residual St ud. Deleted Residual Mahal. Dis tanc e Cook's Dis tanc e
Centered Leverage Value
Minimum Maximum Mean St d. Deviat ion N
Dependent Variable: SK ALA _NILAI_NUMERIK a.
Hasil Kalibrasi Persamaan
Alternatif 31
Regression
Descriptive Statistics .295407 1.9284938 2600 .00 1550.732 2600 .096 .3675 2600 -.115 .4232 2600 7.69 11.202 2600 .00 6.203 2600 SK ALA _NILAI_NUMERIK COST TIME HE ADW AY SE RVICE TIME_ACCESCorrelations 1.000 -.109 -.157 -.037 .127 -.149 -.109 1.000 .000 .000 .000 .000 -.157 .000 1.000 .071 .054 .000 -.037 .000 .071 1.000 -.056 .000 .127 .000 .054 -.056 1.000 .000 -.149 .000 .000 .000 .000 1.000 . .000 .000 .030 .000 .000 .000 . .500 .500 .500 .500 .000 .500 . .000 .003 .500 .030 .500 .000 . .002 .500 .000 .500 .003 .002 . .500 .000 .500 .500 .500 .500 . 2600 2600 2600 2600 2600 2600 2600 2600 2600 2600 2600 2600 2600 2600 2600 2600 2600 2600 2600 2600 2600 2600 2600 2600 2600 2600 2600 2600 2600 2600 2600 2600 2600 2600 2600 2600 SKALA_NILAI_NUMERIK COST TIME HEADWAY SERVICE TIME_ACCES SKALA_NILAI_NUMERIK COST TIME HEADWAY SERVICE TIME_ACCES SKALA_NILAI_NUMERIK COST TIME HEADWAY SERVICE TIME_ACCES Pearson Correlation Sig. (1-tailed) N SKALA_ NILAI_
Variables Entered/Removedb TIME_ ACCES, SERVICE, COST, TIME, HEADWAYa . Enter Model 1 Variables Entered Variables Removed Method
All requested variables entered. a.
Dependent Variable: SKALA_NILAI_NUMERIK b. Model Summaryb .279a .078 .076 1.8539746 Model 1 R R Square Adjust ed R Square St d. E rror of the Es timate Predic tors: (Constant), TIME_A CCE S, SERVICE, COST, TIME, HEA DW AY
a.
Dependent Variable: S KALA_NILAI_NUMERIK b.
ANOVAb 749.757 5 149.951 43.626 .000a 8916.153 2594 3.437 9665.910 2599 Regres sion Residual Total Model 1 Sum of
Squares df Mean S quare F Sig.
Predic tors: (Constant), TIME _ACCE S, S ERV ICE , COST, TIME, HEADWA Y a.
Dependent Variable: SK ALA _NILAI_NUMERIK b. Coefficientsa .189 .046 4.136 .000 .100 .279 .000 .000 -.109 -5. 768 .000 .000 .000 -.857 .099 -.163 -8. 626 .000 -1. 052 -.662 -.081 .086 -.018 -.935 .350 -.250 .089 .023 .003 .135 7.151 .000 .017 .030 -.046 .006 -.149 -7. 890 .000 -.058 -.035 (Const ant) COST TIME HE ADW AY SE RVICE TIME_ACCES Model 1 B St d. E rror Unstandardized Coeffic ients Beta St andardiz ed Coeffic ients
t Sig. Lower Bound Upper Bound
95% Confidenc e Int erval for B
Dependent Variable: SK ALA _NILAI_NUMERIK a.
Residuals Statisticsa -.863717 1.347404 .295407 .5371024 2600 -2. 158 1.959 .000 1.000 2600 .040 .144 .083 .034 2600 -.882194 1.363304 .295475 .5373819 2600 -3. 54460 3.0609174 .0000000 1.8521904 2600 -1. 912 1.651 .000 .999 2600 -1. 916 1.656 .000 1.000 2600 -3. 56050 3.0793939 -.0000680 1.8564781 2600 -1. 917 1.657 .000 1.000 2600 .211 14.594 4.998 4.477 2600 .000 .003 .000 .001 2600 .000 .006 .002 .002 2600
Predic ted V alue St d. P redic ted Value St andard E rror of Predic ted V alue
Adjust ed P redicted Value Residual
St d. Residual St ud. Residual Deleted Residual St ud. Deleted Residual Mahal. Dis tanc e Cook's Dis tanc e
Centered Leverage Value
Minimum Maximum Mean St d. Deviat ion N
Dependent Variable: SK ALA _NILAI_NUMERIK a.