Predicting Coal Ash Fusion Temperature of South
Sumatera’s Blended Coal with Coal Blending Simulation
and Laboratory Analysis
David Bahrin1, M. Faizal1, Edy Ibrahim2, Adiarso3, T.B. Priambodo3, Darmawan3, Iman3
1
Chemical Engineering Department, Faculty of Engineering, Sriwijaya University 2
Mining Engineering Department, Faculty of Engineering, Sriwijaya University Jalan Raya Palembang-Prabumulih Km. 3.5 Inderalaya OI, 30664
E-mail: [email protected] 3
Fossil Energy Division, Energy Technology Center Balai Besar Teknologi Energi (B2TE) - BPPT
E-mail: [email protected]
ABSTRACT
Coal blending is the method to get good characteristic of blended coal for power plant. Ash fusion temperature (AFT) is parameter target in blended coal. AFT are parameter that having influence formation of slaging and fouling on heat transfer system of boiler. Beside using laboratory analysis, this study use simulation for prediction coal ash fusion temperature of blended coal. The name simulation are coal blending simulation. Coal blending simulation is a practically and quickly prosedur to get coal ash fusion temperature of blended coal without doing laboratory analysis. 13 coal samples as parent coals from South Sumatera, Indonesia were analyzed at Energy Fosil Laboratory B2TE-BPPT and including 21 blended coal. The simulation formula is taken away from Chen, W. M (China). Chen, W.M use multiple linier regression to predict coal ash fusion temperatures especialy coal ash softening temperature. The result of comparing AFT value between laboratory analysis and statical model/modelling are the maximum fractional error is 0.49, the minimum error is 0.01 and the average error is 0.05.
Key Word: coal blending, simulation, laboratory analysis, modelling.
1. INTRODUCTION
A part of the low rank coal at South Sumatera is not yet been exploited because of the low rank coal is not efficient and didn’t have high price to sell. Using low rank coal for the power station will influence the power station efficiency. Boiler
system of power station has certain operating condition and it is designed to use coal with spesific characteristic. Using coal with the different characteristic will cause some problems such as combustion efficiency degradation, hot transfer efficiency degradation that effect the slagging and foulling in convection area at the boiler system. The low rank coal contain high water and can cause the calorific value is lower because water of coal is the proportional with calorific value of coal. If the low rank coal used as fuel boiler at power station hence needed amount a lot of coal to produce electricity if using coal with high calorific value at the same yield of electricity.
To increase the using of low rank coal of three alternative scenarios of raw coal for power station, i.e. (1) using coal upgrading to increase quality of coal and (2) using coal blending (3) The change boiler design. Coal Upgrading system is the system to increase quality of coal without blending with other coal from various sources but it is only use a process such as thermal process, UBC process, mechanical proces and the other process. Coal upgrading have higher expense than coal blending process. Making of a new boiler design for handling of low rank coal is needed researchs that have long time and very expensive. If boiler design has been obtained, it has the highly of investment and operate cost. One method has a lower expense and no long time research is coal blending.
SISEST 2009 - RUSNAS PEBT
Sulphur (S) and ash contents are also sometimes considered mainly due to tight environmental limitations. In general, the resulted contents of the above parameters in the product of blended coals are simply calculated proportionally. Fusion temperature of ash in coal (AFT) is also important, particularly when concerning the operability of the running boiler, regardless the use of single or blended coals. AFT refers to the fusing temperature of the ash that remains after coal combustion, and is identified as four deformation temperatures, i.e. initial deformation (IT or ID), softening (ST), hemispherical (HT), and fluid (FT) temperatures. To avoid ash deposition, coal should have AFT higher than furnace exit gas temperature (FEGT) in the pulverized boiler, which is usually designed at about 1,200oC.
Blending coal is to produce the blended coals having characteristics suitable for the boiler specification and/or marketable properties. To meet the specifications, two or more parent coals may require blending. Then, a comprehensive investigation is required to elucidate the effect of elemental ash in coal on AFT of the blended coals. In this preliminary stage, however, the study was limited to the assessment of blended coals from two parent coals only.
Laboratory analysis of blended coal have high cost, sufficient time and high correctness. Coal blending simulation is a practically and quickly prosedur to get coal ash fusion temperature of blended coal without doing laboratory analysis for kinds of coal resources and blending ratio.
2. EXPERIMENTAL 2.1. Coal Samples
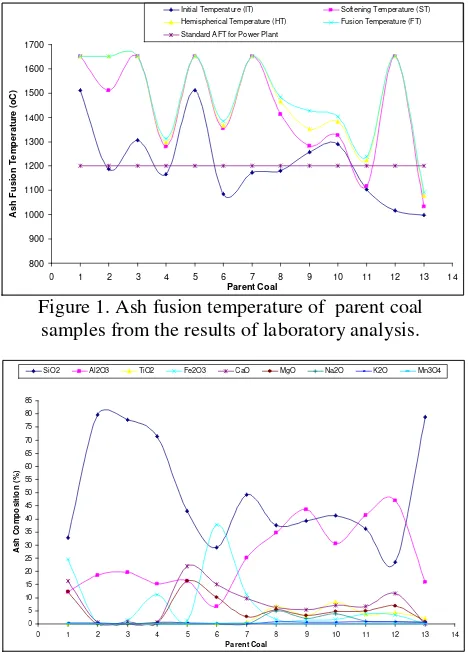
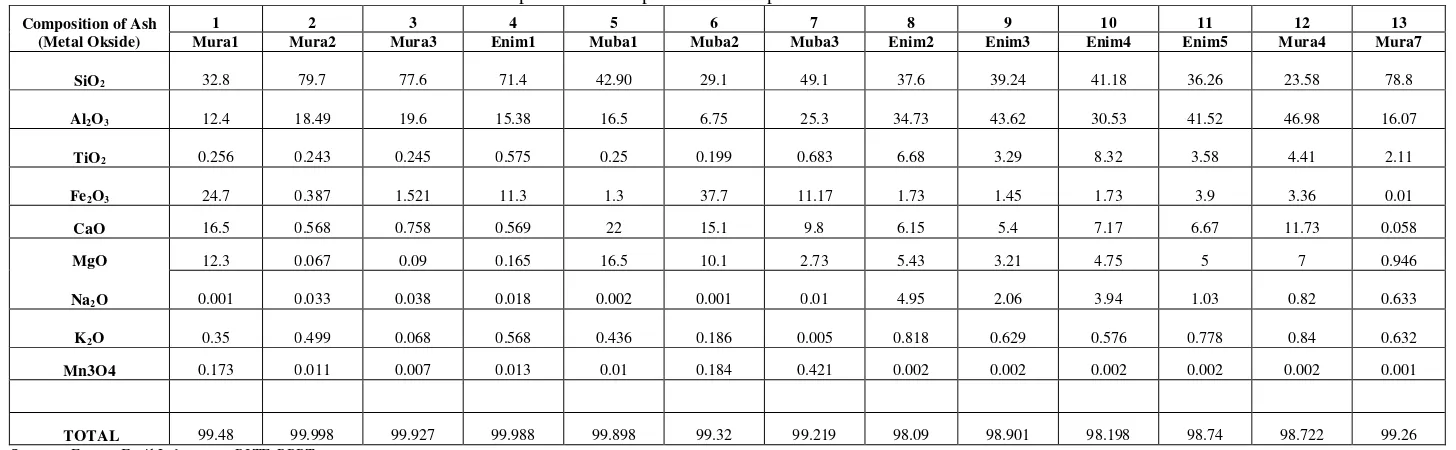
Coal samples of South Sumatera were taken from the selected Districts, i.e. ten samples from Musi Rawas (MURA 1 until MURA 5) and Tanjung Enim (ENIM 1 until ENIM 5) and three samples from Musi Banyuasin (MUBA 1 until MUBA 3). Preparation and laboratory analysis of the coal samples refer to standard procedures, i.e. ASTM. AFT analysis was carried out in both reduction and oxidation atmosphere. Table 1, table 2, figure 1 and figure 2 shows ash fusion temperature and Composition of ash parent coal samples of parent coal samples from the results of laboratory analysis. From figure 1, ash fusion temperature of parent coal for initial temperature (IT) have eight samples can not used as raw material in power
plant. Its because the value of initial temperature less than standard AFT for boiler. But for softening temperature (ST), there is only two samples of parent coal, the value is not include range in standard boiler.
Figure 1. Ash fusion temperature of parent coal samples from the results of laboratory analysis.
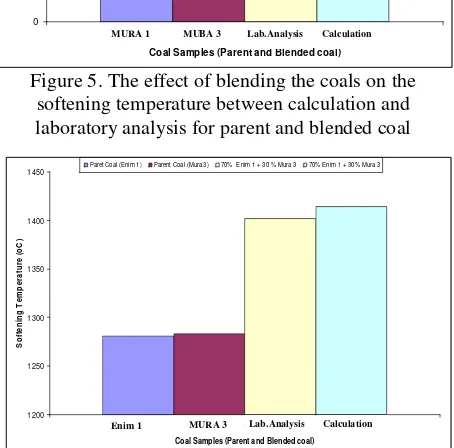
Figure 2. Composition of ash parent coal samples from the results of laboratory analysis.
2.2. Blended Coals
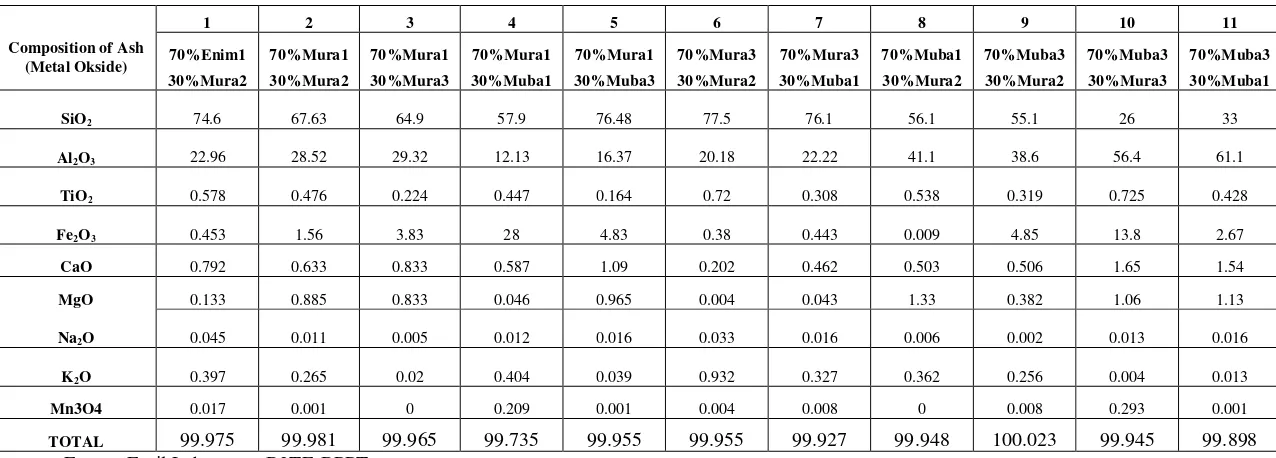
Too many matric and ratio of blended coal for analized. In this study, for technical reasons, a 70 : 30 (by weight) blending ratio was selected for each blended coals and 21 matric of blended coal. Table 3, table 4, figure 3 and figure 4 shows ash fusion temperature and the ash composition of blended coal samples from the results of laboratory analysis.
Initial Temperature (IT) Softening Temperature (ST)
Hemispherical Temperature (HT) Fusion Temperature (FT)
Standard AFT for Power Plant
0
SISEST 2009 - RUSNAS PEBT
Figure 3. Ash fusion temperature of blended coal samples from the results of laboratory analysis.
From figure 3, ash fusion temperature for all blended coal have the value include range in standard boiler except one sample of blended coal (Enim 1 + Mura 2) that have the different value.
Figure 4. Composition of ash blended coal samples from the results of laboratory analysis.
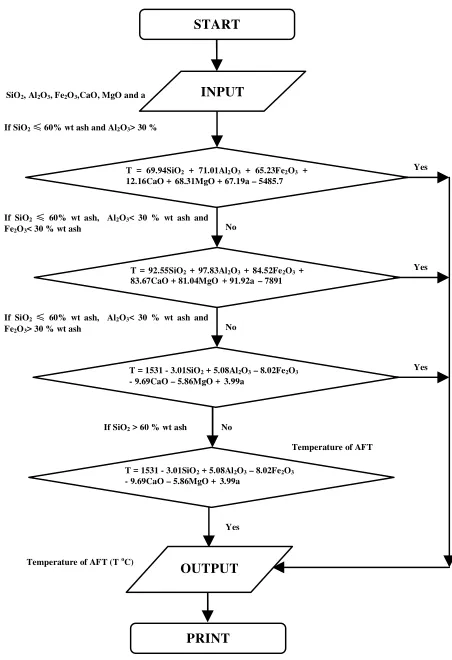
Effect of blending the coals on AFT is shown in table 3 and composition of ash blended coal samples is shown in table 4 and figure 4. The results were compared to the AFT obtained by calculation proportionally and laboratory analysis from the AFT of individual parent coals and blended coal as given in figure 5 and figure 6. In this study, the softening temperature was more concerned. As shown in figure 5 and 6, the resulted AFT of the blended coals lies between the AFT of individual parent coals. However, blending of the coals were considered to give synergistic effect on ST for some blended coals at the 70 : 30 blended coals ratio. This can be explained from the the softening temperature values obtained from AFT analysis which were higher than those obtained from calculation, and these differences were mostly higher than experimental error which is normally less than 50oC. However, the results on figure 5 and figure 6 show that larger synergistic effects were obtained for some coals. The ST of
blended coals obtained from AFT analysis was not only higher than individual parent coals, but also even lower than those of individual parent coals.
While for parameter the softening temperature of ash is obtained by the result of different analysis with the calculation of proporsional and blended coal lower than value of AFT of parent coal or each coal before blending (looked at figure 5 and figure 6). This result gives the indication that AFT represent difficult parameter estimated, so that before has to through steps laboratory analysis.
2.3. Mathematic Model to Predict the Fusing Temperature of The Ash
Several of researchers have described the relationships the exist between coal blending measure AFT and elemental ash composition. Bryers and Taylor (1976) proposed a multiple linier regression of AFT as a function of the percent basic constituents in the ash, viz. (Fe2O3,
MgO, CaO, Na2O + K2O), and its square. Figure 5. The effect of blending the coals on the
softening temperature between calculation and laboratory analysis for parent and blended coal 900
Initial Temperature (IT) Softening Temperature (ST)
Hemispherical Temperature (HT) Fusion Temperature (FT)
Standard AFT for Power Plant
0
SiO2 Al2O3 TiO2 Fe2O3 CaO MgO Na2O K2O Mn3O4
0
Coal Samples (Parent and Blended coal)
S
Figure 6. The effect of blending the coals on the softening temperature between calculation and laboratory analysis for parent and blended coal
1200
Coal Samples (Parent and Blended coal)
SISEST 2009 - RUSNAS PEBT
Winegarther and Rhodes (1975) used the mole percent rather than weight percent of the oxides and employed normalisation to eliminate some of the analytical errors. Huggins et al (1981) found that the effect of the basic component is to add to the effect of the major basic oxide ((FeO) or (CaO)). Rhinehart and Attar (1987) developed a thermodynamically based model for predicting AFT. The use of alkali based additives for alleviating boiler slagging has been studied by Cui, e.al.(1993). However, little investigation has been done on the AFT characteristics for the blended coals. Ash fusion characteristics and mineral behaviour have been investigated for a series of two component blended ash (Qiu, et.al, 1999). From study the value of coal ash softening temperature is not linearly affected by blending ratio and is strongly influenced by the mineral contents. From this consideration, simulation used mathematic model/equation from Chen, W. M et.al (China) to predict ash softening temperature. The equation are
1) when the content of SiO2is less than or equal to
60% and the content of Al2O3 is larger than
30%
T2= 69.94SiO2+ 71.01Al2O3+ 65.23Fe2O3+
12.16CaO + 68.31MgO + 67.19a – 5485.7 2) when the content of SiO2is less than or equal to
60% and the content of Al2O3 is less than to
30% and the content of Fe2O3less than 30%
T2= 92.55SiO2+ 97.83Al2O3+ 84.52Fe2O3+
83.67CaO + 81.04MgO + 91.92a – 7891 3) when the content of SiO2is less than or equal to
60% and the content of Al2O3 is less than to
30% and the content of Fe2O3large than 30%
T2= 1531 - 3.01SiO2+ 5.08Al2O3– 8.02Fe2O3
- 9.69CaO – 5.86MgO + 3.99a
4) when the content of SiO2is large than to 60%
T2= 1531 - 3.01SiO2+ 5.08Al2O3– 8.02Fe2O3
- 9.69CaO – 5.86MgO + 3.99a
where: a = 100 – (SiO2+ Al2O3+ Fe2O3+ CaO +
MgO).
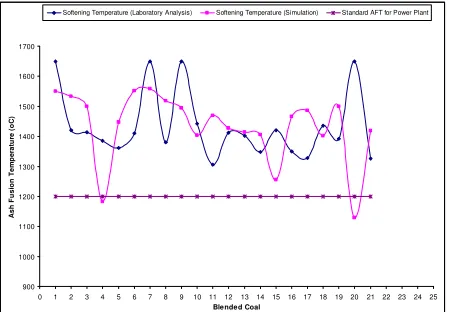
Flow chart to predict softening temperature of parent and blended coal for coal blending simulation can be looked below;
Figure 6. Flow chart to predict ash fusion temperature (softening temperature) for coal blending simulation
3. RESULTS AND DISCUSSION
3.1. Prosedure to create coal blending simulation
Prosedur to create coal blending simulation for prediction coal ash fusion temperature are
1. Making data base throught input data for several parent coal samples are obtained from South Sumatera and other location. For create base data used Microsoft SQL Server Software that connect to Visual Basic Program. Base data include proximate and ultimate analysis, AFT and chemical compound of ash).
2. Making formulas for calculate of the heating value, total moisture, ash, sulfur content, ash softening temperature (AFT). (Basic Program used to make formulas for calculate of the heating value, total moisture, ash, sulfur content, ash softening temperature (AFT) and they are connect toVisual Basic Program).
T = 69.94SiO2+ 71.01Al2O3+ 65.23Fe2O3+
12.16CaO + 68.31MgO + 67.19a – 5485.7 If SiO2≤60% wt ash and Al2O3> 30 %
INPUT
Yes
T = 92.55SiO2+ 97.83Al2O3+ 84.52Fe2O3+
83.67CaO + 81.04MgO + 91.92a – 7891 No
Yes If SiO2≤60% wt ash, Al2O3< 30 % wt ash and
Fe2O3< 30 % wt ash
T = 1531 - 3.01SiO2+ 5.08Al2O3– 8.02Fe2O3
- 9.69CaO – 5.86MgO + 3.99a No
Yes If SiO2≤60% wt ash, Al2O3< 30 % wt ash and
Fe2O3> 30 % wt ash
T = 1531 - 3.01SiO2+ 5.08Al2O3– 8.02Fe2O3
- 9.69CaO – 5.86MgO + 3.99a No
Yes If SiO2> 60 % wt ash
Temperature of AFT (ToC)
Temperature of AFT SiO2, Al2O3, Fe2O3,CaO, MgO and a
START
SISEST 2009 - RUSNAS PEBT
3.2 The Comparison for The Softening Temperature
Figure 4 shows ash fusion temperature of blended coal samples from the results of laboratory analysis and calculation with mathematic model.
Figure 4 ash fusion temperature of blended coal samples from the results of laboratory analysis and calculation with mathematic model.
Figure 6. The comparison between laboratory analysis and coal blending simulation (statistical model) for the
softening temperature value.
Figure 6 showns comparison of simulation (statistical model) and laboratory analysis for all samples of parent and blended coal to measurement of ash softening temperature. The result of comparing AFT value between laboratory analysis and statical model/modelling are the maximum fractional error is 0.49, the minimum error is 0.01 and the average error is 0.05. This average error percentage is less than 10 %, so its enough accurate. So that, to get a small different value of ash softening temperature between laboratory analysis and statistical model (modelling), the equation used in modelling must be change with a new equation.
4. CONCLUSION
The results of investigation confirmed to previous studies that the AFT of blended coals is not
proportional to the coal blending ratio. It can lie between or lower or higher than that of individual parent coals.
It’s a close corellation exists between the softening temperature of coal and its chemical composition. The result of comparing AFT value between laboratory analysis and statical model are the maximum fractional error is 0.49, the minimum error is 0.01 and the average is 0.05.
This prosedurs is not very precise especially in used mathematic model for all prediction quality of coal. But this prosedur as practically can become more effective and efficient to get characteristic blended coal than traditional method. So that to get a small different value of ash softening temperature between laboratory analysis and statistical model (modelling), the equation used in modelling must be change with a new equation.
5. ACKNOWLEDGMENTS
This work was supported financially by the State Ministry of Research and Technology of Republic of Indonesia and the Local Government of South Sumatera Province under RUSNAS (National Strategic Research). Laboratory works have been conducted by research groups of B2TE (Energy Technology Center) – BPPT (Agency for the Assessment and Application of Technology) and Sriwijaya University.
6. REFERENCES
Adiarso, et. al. 2008. Blending Coal to Meet The Fuel Specification. SISEST, Sriwijaya University, Indonesia.
A. Rushdi, et.al. 2004. An Experimental Study of the Effect of Coal Blending on Ash Deposition, Fuel, 83, p. 495 – 506.
Bryers R.W. & Taylor T.E.J. 1975. An Examination of the Relationship Between Ash Chemistry and Ash Fusion Temperature in Various Coal Size and Gravity Fractions Using Polynomial Regression, Transactions of the ASME, 75 WA/CD-3.
Chen, W.M. and Jiang, N., Clean Coal Technology, 1996, 2(2), 34. (in China).
-60
Coal Samples (Parent Coal and Blended Coal)
P
SISEST 2009 - RUSNAS PEBT
Chungen, Y., et.al. 1998. Predicting coal ash fusion temperture with a back propagation neural network model, Fuel, 77, p. 1777-1782.
Cui,Y., et.al. 1993. A Study of Testing Additives and Application to Chinese Coals. Proceedings of the Engineering Foundation Conference. p.703 – 714, London, UK.
David Bahrin, et. al. 2008. Preliminary Study: Blending Coals Simulation to Predicting Coal Quality for Coal Fired Power Stations. SISEST, Sriwijaya University, Indonesia.
Gray V.R. 1987. Prediction of Ash Fusion Temperature from Ash Composition for Some New Zealand Coals, Fuel, 66, p.1230 – 1239.
Huggins F.E., Kosmack D.A., Huffman G.P. 1981. Correlation Between Ash Fusion Temperature and Ternary Equilibrium Phase Diagram, Fuel, 60, 577 – 584.
Qiu J.R, et.al. 1999. The Influences of Mineral Behaviour on Blended coals Ash Fusion Characteristics, Fuel, 78, p. 963 – 969
Rhinehart R.R., Attar A.A. 1987 A
Thermodinamically Based Model For Ash Fusion Temperature, Transactions of the ASME, 109, 124 – 128.
AFT (Red.)
PARENT COAL
1 2 3 4 5 6 7 8 9 10 11 12 13
Mura1 Mura2 Mura3 Enim1 Muba1 Muba2 Muba3 Enim2 Enim3 Enim4 Enim5 Mura4 Mura7
IT 1512 1186 1306 1166 1510 1085 1174 1181 1256 1290 1102 1016 998
ST 1650 1512 1650 1281 1650 1356 1650 1414 1283 1326 1116 1650 1032
HT 1650 1650 1650 1296 165 1367 1650 1466 1352 1384 1224 1650 1078
FT 1650 1650 1650 1312 1650 1385 1650 1483 1428 1405 1238 1650 1091
Sources:Energy Fosil Laboratory B2TE-BPPT
Table 2 Composition of ash parent coal samples from South Sumatera
Composition of Ash (Metal Okside)
1 2 3 4 5 6 7 8 9 10 11 12 13
Mura1 Mura2 Mura3 Enim1 Muba1 Muba2 Muba3 Enim2 Enim3 Enim4 Enim5 Mura4 Mura7
SiO2 32.8 79.7 77.6 71.4 42.90 29.1 49.1 37.6 39.24 41.18 36.26 23.58 78.8
Al2O3 12.4 18.49 19.6 15.38 16.5 6.75 25.3 34.73 43.62 30.53 41.52 46.98 16.07
TiO2 0.256 0.243 0.245 0.575 0.25 0.199 0.683 6.68 3.29 8.32 3.58 4.41 2.11
Fe2O3 24.7 0.387 1.521 11.3 1.3 37.7 11.17 1.73 1.45 1.73 3.9 3.36 0.01
CaO 16.5 0.568 0.758 0.569 22 15.1 9.8 6.15 5.4 7.17 6.67 11.73 0.058
MgO 12.3 0.067 0.09 0.165 16.5 10.1 2.73 5.43 3.21 4.75 5 7 0.946
Na2O 0.001 0.033 0.038 0.018 0.002 0.001 0.01 4.95 2.06 3.94 1.03 0.82 0.633
K2O 0.35 0.499 0.068 0.568 0.436 0.186 0.005 0.818 0.629 0.576 0.778 0.84 0.632
Mn3O4 0.173 0.011 0.007 0.013 0.01 0.184 0.421 0.002 0.002 0.002 0.002 0.002 0.001
TOTAL 99.48 99.998 99.927 99.988 99.898 99.32 99.219 98.09 98.901 98.198 98.74 98.722 99.26
Sources:Energy Fosil Laboratory B2TE-BPPT
AFT (Red.)
BLENDING COAL
1 2 3 4 5 6 7 8 9 10 11
70%Enim1 70%Mura1 70%Mura1 70%Mura1 70%Mura1 70%Mura3 70%Mura3 70%Muba1 70%Muba3 70%Muba3 70%Muba3
30%Mura2 30%Mura2 30%Mura3 30%Muba1 30%Muba3 30%Mura2 30%Muba1 30%Mura2 30%Mura2 30%Mura3 30%Muba1
IT 1375 1402 1410 1372 1350 1405 1294 1302 1436 1410 1298
ST 1650 1420 1414 1385 1362 1410 1650 1380 1650 1442 1306
HT 1650 1650 1422 1650 1412 1650 1650 1415 1650 1650 1368
FT 1650 1650 1650 1650 1650 1650 1650 1650 1650 1650 1388
Sources:Energy Fosil Laboratory B2TE-BPPT
Continue from table 3
AFT (Red.)
BLENDING COAL
12 13 14 15 16 17 18 19 20 21
70%Enim1 70%Enim1 70%Enim1 70%Enim1 70%Muba2 70%Muba2 70%Muba2 70%Muba2 70%Muba2 70%Muba2
30%Mura1 30%Mura3 30%Muba1 30%Muba3 30%Mura1 30%Mura2 30%Mura3 30%Muba1 30%Muba3 30%Enim1
IT 1398 1372 1302 1382 1302 1302 1314 1382 1375 1298
ST 1412 1402 1348 1420 1350 1328 1436 1392 1650 1326
HT 1460 1650 1650 1650 1428 1650 1650 1650 1650 1335
FT 1650 1650 1650 1650 1650 1650 1650 1650 1650 1348
Sources:Energy Fosil Laboratory B2TE-BPPT
Composition of Ash (Metal Okside)
1 2 3 4 5 6 7 8 9 10 11
70%Enim1 70%Mura1 70%Mura1 70%Mura1 70%Mura1 70%Mura3 70%Mura3 70%Muba1 70%Muba3 70%Muba3 70%Muba3
30%Mura2 30%Mura2 30%Mura3 30%Muba1 30%Muba3 30%Mura2 30%Muba1 30%Mura2 30%Mura2 30%Mura3 30%Muba1
SiO2 74.6 67.63 64.9 57.9 76.48 77.5 76.1 56.1 55.1 26 33
Al2O3 22.96 28.52 29.32 12.13 16.37 20.18 22.22 41.1 38.6 56.4 61.1
TiO2 0.578 0.476 0.224 0.447 0.164 0.72 0.308 0.538 0.319 0.725 0.428
Fe2O3 0.453 1.56 3.83 28 4.83 0.38 0.443 0.009 4.85 13.8 2.67
CaO 0.792 0.633 0.833 0.587 1.09 0.202 0.462 0.503 0.506 1.65 1.54
MgO 0.133 0.885 0.833 0.046 0.965 0.004 0.043 1.33 0.382 1.06 1.13
Na2O 0.045 0.011 0.005 0.012 0.016 0.033 0.016 0.006 0.002 0.013 0.016
K2O 0.397 0.265 0.02 0.404 0.039 0.932 0.327 0.362 0.256 0.004 0.013
Mn3O4 0.017 0.001 0 0.209 0.001 0.004 0.008 0 0.008 0.293 0.001
TOTAL 99.975 99.981 99.965 99.735 99.955 99.955 99.927 99.948 100.023 99.945 99.898
Sources: Energy Fosil Laboratory B2TE-BPPT
Continue from table 4
Composition of Ash (Metal Okside)
12 13 14 15 16 17 18 19 20 21
70%Enim1 70%Enim1 70%Enim1 70%Enim1 70%Muba2 70%Muba2 70%Muba2 70%Muba2 70%Muba2 70%Muba2
30%Mura1 30%Mura3 30%Muba1 30%Muba3 30%Mura1 30%Mura2 30%Mura3 30%Muba1 30%Muba3 30%Enim1
SiO2 63.1 44.8 46.4 69.6 63 59.4 23.5 34.03 49.4 37.7
Al2O3 25.89 40.2 43.1 11.36 29.1 36.4 54.5 60.16 11.33 50.58
TiO2 0.444 0.435 0.5 0.419 0.261 0.706 0.667 0.314 0.508 0.434
Fe2O3 1.85 5.96 1.44 17.01 4.52 0.784 18.13 3.22 34.3 3.9
CaO 3.38 1.55 2.18 1.012 1.75 0.903 1.26 0.949 2.594 1.923
MgO 2.39 1.08 2.87 0.146 1.12 1.33 1.151 0.955 0.351 2.49
Na2O 2.59 5.598 3.03 0.035 0.011 0.007 0.011 0.009 0.007 2.562
K2O 0.316 0.321 0.427 0.294 0.185 0.458 0.006 0.265 0.66 0.324
Mn3O4 0 0.003 0.001 0.017 0 0 0.53 0 0.176 0.001
TOTAL (%) 99.96 99.947 99.948 99.893 99.947 99.988 99.755 99.902 99.326 99.914