Analyzing a forest conversion history database to explore the spatial and
temporal characteristics of land cover change in Guatemala’s Maya
Biosphere Reserve
Daniel J. Hayes
1, Steven A. Sader
1,* and Norman B. Schwartz
21Department of Forest Management, University of Maine, Orono, ME, USA; 2Department of Anthropology,
University of Delaware, Newark, DE, USA; *Author for correspondence (e-mail: [email protected]; phone: (207) 581-2845; fax: (207) 581-2875)
Received 17 July 2000; accepted in revised form 28 September 2001
Key words:Forest Clearing, Maya Biosphere Reserve, Remote Sensing, Socio-Economic and Biophysical Indi-cators, Swidden Agriculture
Abstract
We analyzed forest clearing and regrowth over a 23-year time period for 21 forest concession and management units within the Maya Biosphere Reserve (MBR), Guatemala. The study area as a whole experienced a clearing rate of 0.16%/year from 1974 through 1997. The overall clearing rate appears rather low when averaged over the entire study area over 23 years because most of the reserve was inaccessible. However, despite the granting of legal protection to the MBR in 1990, clearing rates continued to rise, with the highest rates occurring in the most recent time period in the analysis, 1995 to 1997. Higher rates of clearing relative to regrowth occurred in newly established communities and in the Reserve’s buffer zone, where the clearing of high forest was preferred for pasture development. Exploratory models were built and analyzed to examine the effects of various landscape variables on forest clearing. The different units in the analysis showed different relationships of forest clearing with variables such as forest cover type and distance to access (roads and river corridors). Where available, so-cio-economic household survey data helped to explain patterns and trends observed in the time series Landsat imagery. A strong relationship between forest clearing and distance to access was demonstrated. More clearing occurred further from roads during later time periods as farmers moved deeper into the forest to find land to clear. Communities inside the MBR that were less dependent on farming had forest clearing to regrowth ratios of one:one or less. These communities used fallow fields in greater proportions than communities in the Reserve’s buffer zone. General trends in clearing by forest cover type suggest a preference for clearing high forest (bosque alto) types found on the higher elevation, better-drained soils, and fallow fields, and an avoidance of low-lying, seasonally flooded terrain (bajos). Satellite remote sensing observations of forest clearing and regrowth patterns can provide an objective source of information to complement socio-economic studies of the human driving forces in land cover and land use change.
Introduction
Impacts on the global environment resulting from hu-man activity are occurring at extraordinary magni-tudes, rates, and spatial scales. The potential conse-quences of land cover and land use change are of global concern, affecting climate and atmosphere, hy-drology and nutrient cycles, biodiversity, productiv-ity, sustainabilproductiv-ity, and the international economy
(Meyer and Turner 1994; Turner et al. 1994). Initia-tives such as the Land-Use/Cover Change (LUCC) project jointly created by the International Geo-sphere-Biosphere Programme (IGBP) and the Human Dimensions of Global Environmental Change (IHDP), as well as the U.S. National Aeronautics and Space Administration’s (NASA) Land Cover and Land Use Change (LCLUC) program, were born from the global scientific community’s aim to better
stand the consequences of land cover and land use change. These programs push a research agenda that attempts to improve the modeling and projection of indicators of environmental change (Turner et al. 1994). How human activities influence environmen-tal change, the factors that drive these activities, and the effects that environmental change has on both the human and natural landscapes are the subjects central to land cover and land use change research. The mis-sion of these programs is to understand the linkage among human activities, land use change, and envi-ronmental consequences, and thus provide a founda-tion for the sustainable use and management of global resources (Rindfuss and Stern 1998).
Monitoring deforestation in the tropics
Crucial to achieving a better understanding of defor-estation processes is improved knowledge of the mag-nitude and extent of the problem. Lambin (1994) de-fines deforestation monitoring as involving “the collection, processing and interpretation of data to as-sess the nature, magnitude, and rates of changes in forest cover.” Many aspects of land cover and land use change occur at broad, landscape scales. Further, processes of an ecological, social or economic nature will have important spatial components (Turner and Gardner 1991). Remote sensing technology provides an excellent source of data for measuring and moni-toring tropical forest change (Sader et al. 1990). Re-motely sensed data are relatively inexpensive to col-lect, cover the globe, can be updated in a timely manner, and are available at various spectral, tempo-ral, and spatial resolutions. Methods to process these data are being continually developed and are advanc-ing our ability to assess the magnitude and rates of tropical forest change. These data form an integral part of current programs to assess forest resources and monitor their changes, link the human dimensions of forest change, and model the effects of change on the global environment.
The spatial and temporal patterns as detected in remote sensing imagery can reveal important impacts on ecological and landscape processes as well as pro-vide clues about land use and socio-economic system indicators (Turner 1990; Lambin 1994; Rindfuss and Stern 1998). For example, Fox et al. (1995) assessed environmental change in northern Thailand on the ba-sis of measured spatial patterns in multi-temporal land cover classifications. Frohn et al. (1996) mod-eled deforestation trends in Brazil using contagion
and fractal dimension measures as landscape indica-tors. De Pietri (1995) developed spatial indices of vegetation cover to indicate areas in Argentina cur-rently and potentially at risk of environmental degra-dation from livestock grazing. Sader and Joyce (1988) analyzed deforestation trends, from 1940 to 1983 in Costa Rica, in relationship to ecological life zones, soils, slope, and roads. They found distance to roads to be the best explanatory variable for forest clearing in 3 out of 4 time periods analyzed. Liu et al. (1993) analyzed deforestation patterns in the Philippines and found the distance to roads and the perimeter to area ratio of forest patches to be good predictors of forest clearing. Sader (1995) analyzed and compared the size and shape of clearing and regrowth patches be-tween two areas in northern Guatemala. Forest-clear-ing patch sizes were larger in areas where recent mi-gration was occurring compared to those within a longer-established community. Localized estimates of deforestation in the Brazilian Amazon using Landsat imagery in studies by Fearnside (1986) and Skole and Tucker (1993) have demonstrated the spatial concen-tration of land cover change in certain political boundaries and along significant migration (road) cor-ridors.
Land Use and Environmental Change in Guatemala’s Maya Biosphere Reserve
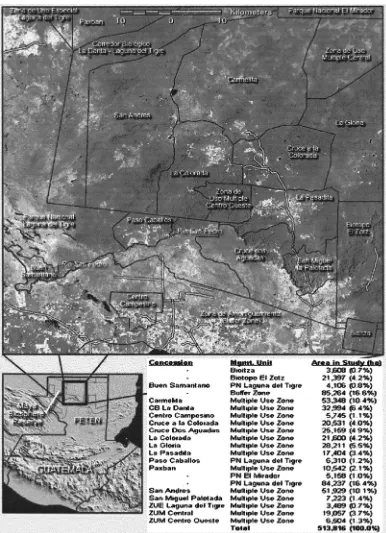
El Petén, Guatemala’s largest and northernmost de-partment (Figure 1), covers 36,000 square kilometers of mostly lowland tropical forests and wetlands. To-gether with adjacent forests in Mexico and Belize, the area known as La Selva Mayaconstitutes the largest contiguous tropical moist forest remaining in Central America (Nations et al. 1998). Along with supporting a rich diversity of plant and animal species, the Maya Forest of the Petén also contains some of the world’s most significant archeological sites as it provided the biological foundation for one of the most developed civilizations of the time, the Classic Maya period of A.D. 250 to 900.
forest that is being destroyed at an alarming rate (Sad-er et al. 2001). Forest is continually being cleared and
its resources greatly taxed as human migration and the expansion of the agricultural frontier threatens the
people and environment of the northern Petén (Sader et al. 1997). A thousand years ago, a postulated com-bination of factors including population growth, po-litical instability and warfare, overuse of resources, climate change, and environmental destruction may have led to the collapse of the ancient Mayan civili-zation (Rice 1991; Culbert 1993). A similar combina-tion of factors threatens the forest and its current in-habitants today, despite a much lower population and a much shorter time frame (Sever 1998).
In the face of this population expansion and de-struction of forests, the Maya Biosphere Reserve (MBR) was established by congressional decree of the Guatemalan government in 1990 to preserve the remaining intact forest and the rich biological and cultural resources that it holds. Spanning 1.6 million ha, the MBR is a complex of designated management units including five national parks, four biological re-serves (biotopos), a multiple use zone (MUZ), and a buffer zone. Within these management units, some areas were further delineated into forest concessions where management responsibilities (within the frame-work of the MBR) were delegated to the communi-ties therein.
Background and objectives
Given the current concerns over forest clearing in the MBR, a strong interest in obtaining landscape-level forest change information for the region has devel-oped among governmental agencies and the conser-vation community (Kristensen et al. 1997). In re-sponse, Sader and colleagues (e.g., Sader et al. (1994, 2001)) have monitored rates, trends, and patterns of forest clearing in the MBR using Landsat Thematic Mapper (TM) imagery. The objective of this research is to advance the ongoing study of deforestation in the MBR by bringing together an extensive archive of time-series satellite data with spatial, biophysical, and socio-economic determinants of land cover and land use change. Specifically, we created a forest conver-sion history database, derived from satellite image analysis, to monitor the rates and spatial extent of forest change in several forest concessions within the MBR, over a twenty-three year period. We used the database to quantify rates of forest clearing and re-growth, as well as to analyze patch, landscape, and proximity metrics. We compared the temporal and spatial trends among several concession areas and discussed in the context of socio-economic studies
conducted in some of the forest concession commu-nities (Schwartz 1998).
Methods
Data acquisition and pre-processing
We acquired seven dates of Landsat imagery (Multi-Spectral Scanner (MSS) and Thematic Mapper (TM)), covering a span of 23 years, for the World-wide Reference System (WRS) Path 20, Row 48 scene. This scene covers approximately 90% of the land area of the MBR. The first two dates (1974, 79) were represented by MSS data and the others (1986, 90, 93, 95, 97) were TM. The MSS data with 80m pixel resolution were resampled to 30m to match the spatial resolution of the optical bands of the TM data. The seven images were subset to cover a large por-tion of the MBR containing all or parts of 21 discrete management units and forest concession areas (Fig-ure 1). This study area represents 32% of the area within the MBR, located mostly in the MUZ and buffer zone.
Each scene from each date was geographically ref-erenced to a previously rectified 1995 Landsat TM scene, in Universal Transverse Mercator Projection Zone 16. Information in the visible red (RED, MSS Band 2 and TM Band 3) and near infrared (NIR, MSS Band 4 and TM Band 4) portion of the spectrum was used for discrimination between forest and non-forest areas of the imagery. These data were radiometrically normalized using bright and dark target areas and band-by-band linear regression techniques, to correct for differences in the recording properties of the two sensors and for seasonal and atmospheric differences between dates (Eckhardt et al. 1990; Hall et al. 1991; Jensen et al. 1995). Each date of imagery was masked to eliminate clouds, water, non-forested wetlands, and natural savanna through image classification proce-dures and Geographic Information System (GIS) ed-iting. The analysis was based on the calculation of the normalized difference vegetation index (NDVI) for each date, according to the following formula:
NDVI⫽共NIR⫺RED兲
共NIR⫹RED兲 (1)
veg-etation parameters (Tucker 1979; Sellers 1985; Singh 1986; Running et al. 1986).
Time-series change detection
An accurate and efficient change detection methodol-ogy, based on time-series classification of the NDVI, was developed and tested (Hayes and Sader 2001 (in press)). All image processing was performed with ERDAS Imagine, v.8.3, software (ERDAS 1997). The RGB-NDVI method (Sader et al. 2001) was used, three dates at a time, on three data sets (1974, 79, 86; 1986, 90, 93; and 1993, 95, 97). By simultaneously projecting each date of NDVI through the red, green, and blue (RGB) computer display write functions, major changes in NDVI (and hence forest cover) be-tween dates will appear in combinations of the pri-mary (RGB) or complimentary (yellow, magenta, cyan) colors. Knowing which date of NDVI is cou-pled with each display color, the analyst can visually interpret the magnitude and direction of forest cover changes in the study area over the three dates. Auto-mated classification was performed on three or more dates of NDVI by unsupervised cluster analysis (Hayes and Sader 2001 (in press); Sader et al. 2001), using the ERDAS “isodata” routine, a minimum dis-tance to the mean classifier (ERDAS 1997). Change and no change categories are labeled and dated by in-terpreter analysis of the cluster statistical data and guided by visual interpretation of RGB-NDVI color composites. Clusters were segmented between change and no change and then reclustered to reduce confu-sion and to better distinguish between clearing and regrowth areas (Hayes and Sader 2001 (in press)). Jensen (1996) referred to this technique as “cluster busting”.
For each time period, each pixel was classified as cleared, regrown, or no change. For each resulting change detection image, on-screen digitizing and GIS editing techniques were used to eliminate spurious change due to natural fluctuations in vegetation and soil moisture, changes in water level, clouds and cloud shadows, and forest fires. Binary images repre-senting forest clearing were created for each time pe-riod (i.e. clearing 1974–79, 1979–86, 1986–90, 1990– 93, 1993–95, and 1995–97). Binary images were also created which represented areas of regrowth at each time period. As a result of the low amount of clearing activity from 1974–79 and 1979–86, along with the limited temporal, spectral and spatial resolution of the MSS data, no significant regrowth areas were
de-tected for the first two time periods. Binary images representing regrowth were created for 1986–90, 1990–93, 1993–95, and 1995–97.
Development of forest clearing and regrowth patches
Contiguous patches of pixels representing forest clearing and regrowth at each time period were iden-tified by employing the ERDAS “clump” command to each binary image. In a raster image, this process identifies and groups contiguous pixels of the same class, based on all 8 neighboring pixels (ERDAS 1997). Clumped images were exported from Imagine raster format to ARC (ESRI 1998) vector format. Re-sulting coverages were merged by time period so that one coverage containing both clearing and regrowth patches was created for all time periods. A vector coverage containing polygons representing forest concession areas of the MBR was obtained from Con-servation International/ProPetén and added to the da-tabase so that each patch had a unit identifier. The area of each patch was calculated and added as an item in the database. Patches less than 1 ha in size were merged with the adjacent polygon that shared the longest border to avoid sliver polygons resulting from spurious change and mis-registration.
Development of land cover history and distance from access database
class (including both low biomass natural non-forest as well as agricultural areas). A previously developed mask was applied to separate wetland and savanna from agriculture and other cleared forest. An attribute was added to the existing land cover history database that contained the majority 1986 land cover for each patch.
Subsequently, the land cover of each patch at each date was identified by updating the 1986 land cover classification using the conversion history from the time-series database. If a patch had not experienced change through the following time periods, it was la-beled as the cover type classified in 1986. Patches that had regrown and were not cleared thereafter were classified as second growth (guamil). In the same way, cleared areas that had not been regrown were labeled as non-forest. Age classes for regrowth or clearing were determined from the patch change his-tory in the database.
Roads and river corridors were digitized on-screen from 1986 and 1997 TM color composite imagery and saved in raster format. Based on analysis by lo-cal field experts, the 30m pixel resolution of TM im-agery was sufficient for locating major roads and riv-ers. It should be noted that many smaller foot and mule paths do exist and provide farmers access to their fields, but were not digitized. However, the ma-jor roads and rivers that were detected are more im-portant for direct access to forest for clearing as well as for the transportation of goods to local markets. No significant changes in the major road coverage of the study area occurred between dates spanning the anal-ysis, therefore only one road file was used. The dis-tance to “access” (roads and rivers) was calculated in
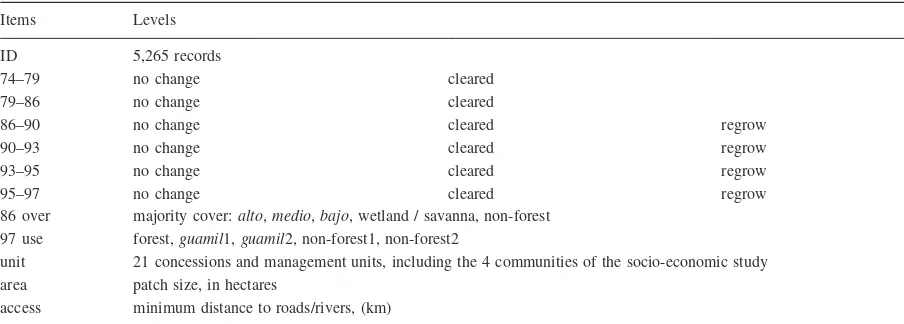
kilometers and added to the database as an attribute. The distance of each patch to access item calculates the minimum distance of each patch to roads or riv-ers, whichever was closest. The final database struc-ture, including all attributes and the levels or catego-ries of each attribute, is shown in Table 1.
Database analysis
The information contained in the database allows for the use of illustrative, descriptive, and statistical anal-yses for exploring the spatial and temporal character-istics of land cover and land use change. The analysis included the investigation of the general trends in est clearing and regrowth over time and between for-est concession units. Subsequent analysis involved re-lating these statistics to measurable factors that are hypothesized to affect land cover and land use change patterns, such as distance to access, forest type, and forest type availability.
The total area of forest cleared and regrown in each time period was calculated for each concession unit directly from the database. Annual rates of clear-ing (as a percent of remainclear-ing forest, per year) were calculated by the following formula:
Ct/Ft
Yt ⫻100, (2)
whereCtis the area cleared during time period t; Ft
is the area of forest remaining at the beginning of time period t, and Ytis the number of years in time
period t. Concessions that showed little or no
clear-Table 1. The attributes and levels of the time-series database.
Items Levels
ID 5,265 records
74–79 no change cleared
79–86 no change cleared
86–90 no change cleared regrow
90–93 no change cleared regrow
93–95 no change cleared regrow
95–97 no change cleared regrow
86 over majority cover:alto,medio,bajo, wetland / savanna, non-forest 97 use forest,guamil1,guamil2, non-forest1, non-forest2
unit 21 concessions and management units, including the 4 communities of the socio-economic study area patch size, in hectares
ing during the time period of this study were omitted from further analysis.
For each time period and each concession unit, the amount (area) of forest clearing was compared with the amount of regrowth to report clearing:regrowth ratios. Also for each time period and each concession unit, the database was examined according to the amount of clearing within each forest cover type (alto,medio,bajo, andguamil) and the distance of the cleared patch from road or river access. Forest clear-ing by cover type was also analyzed with respect to the total area of each cover type available in each concession unit during each time period.
The distance from access relationship to forest clearing was analyzed using a distance from access “zone” file. This file was created from a raster file depicting roads and rivers, using the ERDAS “search” routine (ERDAS 1997) that consolidated pixels in the image into 1 pixel (0.03km) intervals (“zones”) from access points. The number of observations was con-strained to 254 pixels (7.62km) maximum from ac-cess, to keep within the limits of an 8-bit image of 30m pixel data (0–255, with 0 being adjacent to roads or rivers and 255 representing those areas greater than 7.62km from access). Furthermore, it was found that less than 0.5% of the clearing in the study area oc-curred greater than 7km from access points. Distance from access (the “zone” file) was compared against each date of clearing (the “class” file) using the ER-DAS raster “summary” routine (ERER-DAS 1997). The procedure produces cross-tabulation statistics com-paring class values between two files, including the area (ha) in common.
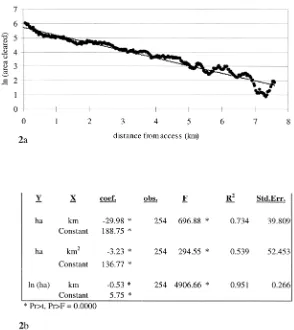
Total area cleared, all time periods combined, was plotted against distance from access, in kilometers. The relationship was tested by simple bivariate re-gression analysis using the correlation coefficients and R-squared calculations between the independent variable (distance from access) and the dependent variable (forest clearing). Area cleared as a function of the interaction between time and distance from ac-cess was also examined using regression analysis. As with the regression analysis of total area cleared (all time periods combined), area cleared for each time period was summarized within 1 pixel intervals from access, with 254 observations. The area cleared was plotted against distance from access, using a separate curve for each time period for comparison.
Having demonstrated the effect of distance to ac-cess on forest clearing, distance to acac-cess was added to the analysis of clearing by cover type according to
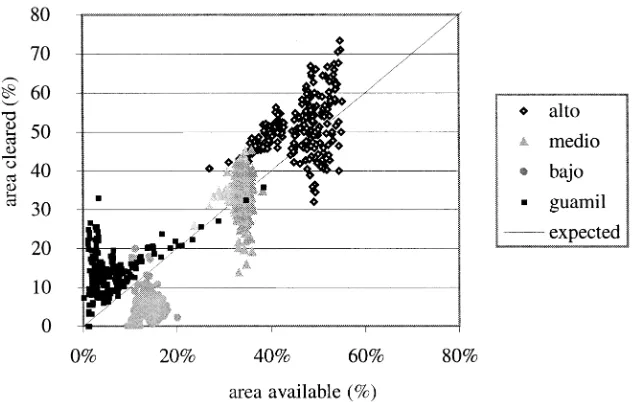
cover type “availability”. To explore this relationship, the percent of available area cleared in each cover type was compared to the percent of total available area represented by each cover type, at each 1 pixel (30m) distance from access “zone”. The hypothesis was that, under a circumstance of no preference or avoidance among the forest cover types for establish-ing farm plots, that clearestablish-ing within each type would be proportional to the amount of that cover type that was available. Thus, we expected the points to fall along a line representing a 1:1 relationship of percent cleared to percent available. For each cover type, the distance (in percent) of each point from the expected line was calculated, and the mean of these residuals was calculated for each type. The set of residuals for each cover type was tested for significance using a one-sample t-test with a hypothesized mean of zero.
Results and discussion
The pre-processing techniques and multi-temporal change classification methodology described above resulted in an overall classification accuracy of 85% (Hayes and Sader 2001 (in press)). The accuracy was determined by error matrix analysis (Congalton and Green 1999) using a random set of reference points interpreted visually on the multiple dates of TM color composite imagery (Cohen et al. 1998).
Forest clearing rates
experienced its greatest amounts of forest clearing during 1974–79 and 1979–86 and then showed a de-crease in later time periods.
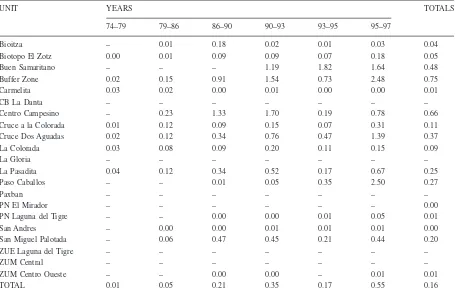
Forest clearing rates are reported by percent of forest cleared per year for each concession in each time period (Table 2). These rates provide a normal-ized perspective of forest clearing, as the time peri-ods vary in length and the concessions encompass very different extents of forest area. For example, a similar area was cleared in Carmelita during 1974–79 (65.0 ha) as Buen Samaritano during 1995–97 (74.1 ha). The community of Carmelita covers a consider-ably larger area of forest than Buen Samaritano, and the first time period spans five years as opposed to two years in 1995–97. The annual percent of forest cleared, then, is minimal for Carmelita during 1974–79 (0.03%/year) while significantly high for Buen Samaritano during 1995–97 (1.64%/year). The greatest annual clearing rate over the entire study area occurred during the 1995–97 time period (0.55%/ year). The highest clearing rate reported for any con-cession and any time period was 2.50%/year in Paso Caballos during 1995–97 and, during the same time
period, 2.48% of the forest in the buffer zone was cleared annually. Over the entire 23-year span of the study, the buffer zone had the highest annual clearing rate (0.75%/year), followed by Centro Campesino (0.66%/year). It should be noted that the community of Centro Campesino exists within the buffer zone (Figure 1), but is treated as a separate unit in this analysis. In comparison, the study area as a whole experienced a clearing rate of 0.16%/year from 1974 through 1997. The overall clearing rate appears rather low when averaged over the entire study area because most of the reserve was inaccessible.
Forest clearing to regrowth ratios
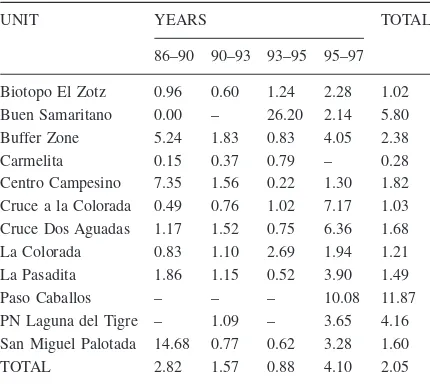
The relationship of forest cleared to regrowth for each time period is given in Table 3. The study area as a whole exhibited a ratio (including total area cleared and total regrown over all time periods since 1986) greater than one (2.05 overall, or approximately 2 ha cleared for every 1 ha regrown). The highest total ra-tios were found for Paso Caballos (11.9) and Buen Samaritano (5.8), two of the most recently established
Table 2. Annual forest clearing rates (% of forest remaining cleared per year) over time for the concession units in the study area.
UNIT YEARS TOTALS
74–79 79–86 86–90 90–93 93–95 95–97
Bioitza – 0.01 0.18 0.02 0.01 0.03 0.04
Biotopo El Zotz 0.00 0.01 0.09 0.09 0.07 0.18 0.05
Buen Samaritano – – – 1.19 1.82 1.64 0.48
Buffer Zone 0.02 0.15 0.91 1.54 0.73 2.48 0.75
Carmelita 0.03 0.02 0.00 0.01 0.00 0.00 0.01
CB La Danta – – – – – – –
Centro Campesino – 0.23 1.33 1.70 0.19 0.78 0.66
Cruce a la Colorada 0.01 0.12 0.09 0.15 0.07 0.31 0.11
Cruce Dos Aguadas 0.02 0.12 0.34 0.76 0.47 1.39 0.37
La Colorada 0.03 0.08 0.09 0.20 0.11 0.15 0.09
La Gloria – – – – – – –
La Pasadita 0.04 0.12 0.34 0.52 0.17 0.67 0.25
Paso Caballos – – 0.01 0.05 0.35 2.50 0.27
Paxban – – – – – – –
PN El Mirador – – – – – – 0.00
PN Laguna del Tigre – – 0.00 0.00 0.01 0.05 0.01
San Andres – 0.00 0.00 0.01 0.01 0.01 0.00
San Miguel Palotada – 0.06 0.47 0.45 0.21 0.44 0.20
ZUE Laguna del Tigre – – – – – – –
ZUM Central – – – – – – –
ZUM Centro Oueste – – 0.00 0.00 – 0.01 0.01
communities. The concession units showing ratios closest to one, since 1986, are Cruce a la Colorada (1.03) and Biotopo El Zotz (1.02), the latter a core area of the reserve. Carmelita, a community in which the population does not rely heavily on farming (Ta-ble 4), had a greater area regrown than area of forest cleared since 1986 (total ratio of 0.3). The buffer zone portion of the study area, where agriculture and ranching provide the major sources of income (Schwartz 1990), shows a total ratio of almost two and a half hectares of forest cleared for every hectare regrown (2.4), including a ratio of 4.1 in 1995–97. Over all concessions, there was a greater area re-grown than cleared only in 1993–95 (0.9). All other time periods had greater amounts of clearing than re-growth over the entire study area, the largest ratio oc-curring in 1995–97 (4.1).
Land management and adaptive strategies, time since establishment of communities, and changes in population immigration and emigration are likely to affect the amount of forest cleared relative to the amount regrown during a period of time (Schwartz 1998). The more recently established communities have had much higher rates of clearing than regrowth corresponding to the immigration of families and the subsequent establishment of farm plots (e.g. Paso Ca-ballos in 1995–97 and Buen Samaritano in 1993–95). During the first few years of establishment, little re-growth is expected as fields are within the first crop cycle. Depending on the crop to fallow ratios used, it
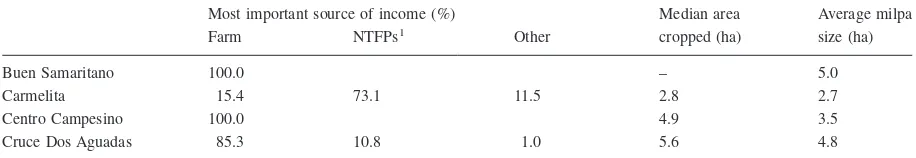
will be two or more years before significant regrowth can be observed. Inhabitants of Carmelita, a commu-nity in which the amount of regrowth since 1986 has exceeded the amount of clearing over the same time (total ratio of 0.3), are known to rely more on NTFP harvesting than agriculture (Table 4). Carmelita, fur-thermore, is the oldest established community in the study area and has a declining population (Schwartz
pers. comm.). Biotopo El Zotz, on the other hand, is a designated core area of the Reserve, and the clear-ing of forest is illegal. The clearclear-ing that has occurred in this area appears to be a result of farmers moving over the border from Cruce Dos Aguadas to establish farm plots. Communities in the buffer zone, includ-ing Centro Campesino (Centro Campesino plus the rest of the buffer zone equal a total clearing to re-growth ratio of 2.1 from 1986 to 1997), are also long established. However, in contrast to Carmelita, these communities generally have higher populations, NTFP harvesting is not a major source of income (Table 4), and the establishment of pasture for raising cattle is more prevalent than elsewhere in the study area (Schwartz 1998).
Forest clearing by cover type
An interesting question to explore is whether or not there is a preference, or avoidance, of certain cover types for establishing a farm plot. Further, by analyz-ing the area of forest clearanalyz-ing by cover type, the de-gree to which fallow fields are used for establishing farm plots can be examined. For example, since 1986, farmers and ranchers in Centro Campesino estab-lished 69.5% of their plots by clearing high forest (bosque alto). No low forest (bosque bajo) was cleared and the re-clearing of fallow fields (guamil) accounted for 11.2% of the total area cleared since 1986. By contrast, the majority of clearing in Buen Samaritano (66.7%) occurred in transition forest (bosque medio), and only 0.6% of the area cleared was in guamil. Biotopo El Zotz (13.5%), Cruce Dos Aguadas (6.1%), and Carmelita (5.9%) had the high-est proportion, among all concessions, cleared from
bajo forest. It should be noted, however, that the cleared hectares representing Carmelita are much lower than the other concession units. The higher pro-portions ofbajoclearing in Cruce Dos Aguadas may be partially explained by the occurrence of some Q’eqchi families planting a third farm plot (payapak) in low-lying areas (i.e. bajos) during the dry season. These are planted in addition to the dry and wet
sea-Table 3. Area of forest cleared to area regrown ratios over time, by concession unit.
UNIT YEARS TOTAL
86–90 90–93 93–95 95–97
Biotopo El Zotz 0.96 0.60 1.24 2.28 1.02 Buen Samaritano 0.00 – 26.20 2.14 5.80 Buffer Zone 5.24 1.83 0.83 4.05 2.38 Carmelita 0.15 0.37 0.79 – 0.28 Centro Campesino 7.35 1.56 0.22 1.30 1.82 Cruce a la Colorada 0.49 0.76 1.02 7.17 1.03 Cruce Dos Aguadas 1.17 1.52 0.75 6.36 1.68 La Colorada 0.83 1.10 2.69 1.94 1.21 La Pasadita 1.86 1.15 0.52 3.90 1.49 Paso Caballos – – – 10.08 11.87 PN Laguna del Tigre – 1.09 – 3.65 4.16 San Miguel Palotada 14.68 0.77 0.62 3.28 1.60 TOTAL 2.82 1.57 0.88 4.10 2.05
son plots that are normally planted (Schwartz 1998). As previously mentioned, Biotopo El Zotz is adjacent to Cruce Dos Aguadas and may have experienced clearing by farmers from the concession of Cruce Dos Aguadas crossing the border into the EL Zotz reserve area. Furthermore, a large bajo runs through these two units. The highest proportion of clearing from
guamil occurred in Carmelita (43.9%). Of all forest cleared since 1986 in the entire study area, the ma-jority was from alto forest (55.4%), the least from
bajo(3.0%), and 11.5% was fromguamil.
Statistics illustrating the percent of clearing by cover type can be misleading because those types cleared for establishing farm plots might be con-strained by the area available in each type. If clearing by cover type were proportional to what is available in each concession unit, it would be expected that the percent of total cleared area in each cover type should equal the proportional area represented by each cover type (other factors being equal). Over the entire study area, 55.4% of clearing from 1986–1997 occurred in
alto forest, compared to 41.5% available in 1986. 3.0% ofbajoforest was cleared, compared to 16.6% available. A substantially greater proportion of cleared alto forest than the available proportion oc-curred in the buffer zone (59.9% to 33.1%) and Cen-tro Campesino (69.5% to 38.7%). Results of the household survey by Schwartz (1998) indicate a pref-erence among respondents in Centro Campesino for using areas of high forest to create pasture for graz-ing cattle. This may also explain the low proportion of clearing in thebajoandguamiltypes found in the buffer zone and Centro Campesino. Most concessions showed a greater amount of clearing inguamil com-pared to the proportional availability of that type, no-tably Carmelita (43.8% of clearing area to 2.0% avail-able) and San Miguel Palotada (32.6% to 9.9% available). The one exception to this trend is the buffer zone (9.5% of clearing area to 14.5% avail-able). Schwartz (1990, 1998) suggests the lack of land tenure and political instability as major disincentives
for sustainable forestry, agriculture and soil conserva-tion practices, especially in the buffer zone.
Distance from access to forest clearing
In examining the use of the different forest types for establishing farm plots, the relationship of clearing to cover type proportion is helpful in illustrating trends. However, the relative amount of the various forest types in each unit does not completely explain avail-ability. For example, forest closer to access corridors (roads and rivers) is considered to be “more avail-able” than forest further from roads. The proximity relationship of clearing to points of access is an im-portant factor in the analysis of forest type clearing. First, it is necessary to test the general pattern of for-est clearing in proximity to access.
Total area cleared, all time periods combined, was plotted against distance from access, in kilometers. A curvilinear relationship is apparent in the data (Fig-ure 2), with area cleared decreasing exponentially as distance increases. Regression analysis indicates that distance from access is significantly and negatively associated with area cleared (coefficient = −29.98), with an R-square of 0.734 (Figure 2a). Distance squared was also significant to area cleared, with a negative coefficient and an R-square of 0.539. The strongest relationship was obtained by using the log transform of area cleared against distance from access (km), resulting in a coefficient of −0.53 and an R-square of 0.951 (Figure 2b).
Relationship of clearing and access among forest concessions
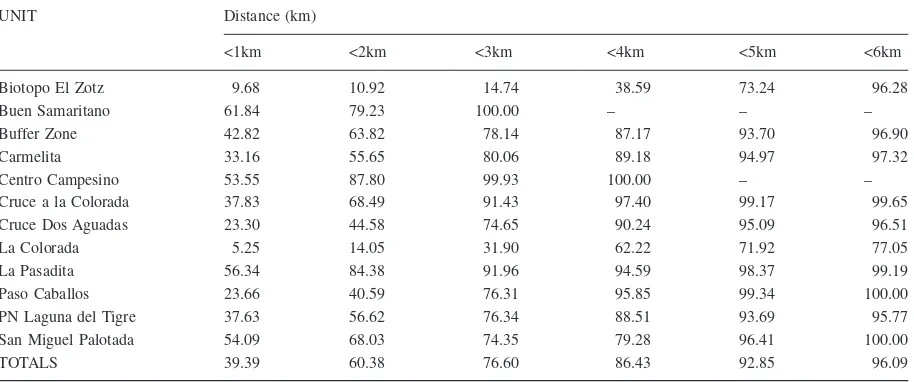
This relationship of the cumulative percent of area cleared to distance from access (roads and rivers) was also explored by individual forest concession unit (Table 5). Of all clearings in the study area since 1986, 96.1% were within 6 kilometers from access, with over 75% within 3 kilometers. Of all units, Buen
Table 4. Socio-economic survey respondent information regarding land use (from Schwartz (1998)).
Most important source of income (%) Median area Average milpa
Farm NTFPs1 Other cropped (ha) size (ha)
Buen Samaritano 100.0 – 5.0
Carmelita 15.4 73.1 11.5 2.8 2.7
Centro Campesino 100.0 4.9 3.5
Cruce Dos Aguadas 85.3 10.8 1.0 5.6 4.8
Samaritano had the greatest percentage of clearing concentrated within 1 km of access (61.8%) and all forest cleared was within 3 km. High percentages of clearing within 1 km of access were also found in Centro Campesino (53.6%) and the portion of the buffer zone included in the study area (42.8%). Cruce Dos Aguadas had the lowest concentration of cleared area within 1 km from access (23.3%). The lower concentration of clearing closer to access in Cruce Dos Aguadas may be due in part to findings of the socio-economic study. For example, Schwartz (1998) reported that survey respondents from Q’eqchi house-holds in Cruce Dos Aguadas tend to go further from roads to establish their farm plots than respondents from the Ladino households. Cruce Dos Aguadas had a higher Q’eqchi population than the other communi-ties included in the socio-economic survey. However, similar data are not available for the other communi-ties for comparison with Cruce Dos Aguadas.
The regression analysis demonstrates the strong re-lationship between clearing and distance from access (Figure 2). Among the concession units, differences in the amount of clearing within the 1, 2, and 3 km intervals from access (Table 5) may be, in part, due to the mode of transportation and type of agriculture used at varying distances from roads. It is expected that permanent agriculture and pasture would be lo-cated closer to roads for efficiency (Schwartz 1998). On the other hand, the major form of transportation to farm plots is walking (Schwartz (1990, 1998)) and farm plots will be established deeper into the forest as land for cropping and shifting cultivation becomes scarce closer to roads. Communities in the buffer zone, including Centro Campesino, tend to make more pasture than other communities (Schwartz 1998), which would account for the high percentage of clearing within 1km of access in these two units. Under this assumption, the smaller concentration of clearings within 1 km of access in Cruce Dos
das and Paso Caballos suggests a greater proportion of shifting cultivation agriculture than pasture man-agement in these concessions. The very low concen-tration of cleared area within 1 km of access in Biotopo El Zotz and Carmelita may correspond to the low density of access corridors in these units, accord-ing to the road coverage digitized from the Landsat imagery. However, there are often mule trails, unim-proved roads, and foot paths that connect farmers to their farm plots and can be considered as access, but were too small to be detected on the Landsat imag-ery. Furthermore, people in Carmelita are not depen-dent on farming, and El Zotz is a reserve core area, where forest clearing is illegal. The high percentage of clearing within 1 km of access in Buen Samaritano is a result of the relatively small size of this unit, much of which borders along the Rio San Pedro.
Time and distance relationship to forest clearing
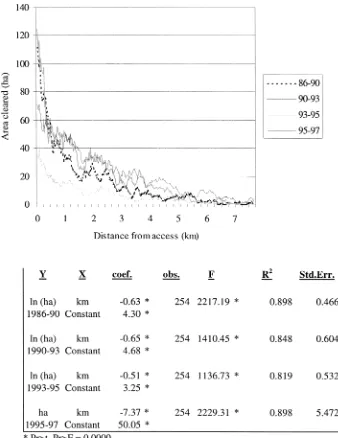
The effect of time period on forest clearing at differ-ent distances from access was examined by compar-ing area cleared against distance from access for sep-arate curves for each time period. Models for each time period were all highly significant, as were both the constant and coefficient in each model (Figure 3). The best-fit line for each time period was achieved by using the natural log of area cleared (ha) against distance to access (km), except for the last time pe-riod.
Regression statistics show that the slopes of the lines (coefficients) for 1986–90 and 1990–93 area
cleared are similar (−0.63 and −0.65, respectively), and the models have similar R-square values and standard errors. Visual examination of the line graph suggests that less area is cleared closer to roads and rivers in 1995–97 than the first two time periods, and that the regression line drops off gradually at further distance from access. This is reflected in the regres-sion statistics as well, as the 1995–97 model indicates a linear relationship between forest clearing and dis-tance from access in the last time period. An expected progression of deforestation would follow this trend, in that the majority of the area cleared will be con-centrated closer to access in earlier time periods (Sad-er and Joyce 1988; Liu et al. 1993). A great(Sad-er propor-tion of clearing will begin to occur further from roads in later time periods as forest remaining closer to roads diminishes and farmers must move deeper into the forest to clear land.
Proportional availability and clearing by forest type
Having established the relationships of forest clearing over time and from distance to access, it is important to consider these effects in exploring the question of how different cover types are utilized for establishing farm plots. It was demonstrated earlier that the area ofaltoandmedioforest cleared is higher thanguamil
(fallow fields) and bajo forest, corresponding to the total amount of clearing and the relative proportion of each type on the landscape. However, the area of each cover type available will change over time and the amount of each cover type cleared will vary at
Table 5. Cumulative percent of total forest cleared, by 1km intervals from access (roads and rivers) and concession unit.
UNIT Distance (km)
<1km <2km <3km <4km <5km <6km
Biotopo El Zotz 9.68 10.92 14.74 38.59 73.24 96.28
Buen Samaritano 61.84 79.23 100.00 – – –
Buffer Zone 42.82 63.82 78.14 87.17 93.70 96.90
Carmelita 33.16 55.65 80.06 89.18 94.97 97.32
Centro Campesino 53.55 87.80 99.93 100.00 – –
Cruce a la Colorada 37.83 68.49 91.43 97.40 99.17 99.65
Cruce Dos Aguadas 23.30 44.58 74.65 90.24 95.09 96.51
La Colorada 5.25 14.05 31.90 62.22 71.92 77.05
La Pasadita 56.34 84.38 91.96 94.59 98.37 99.19
Paso Caballos 23.66 40.59 76.31 95.85 99.34 100.00
PN Laguna del Tigre 37.63 56.62 76.34 88.51 93.69 95.77
San Miguel Palotada 54.09 68.03 74.35 79.28 96.41 100.00
different distances from access. We hypothesized that, if farmers showed no perference for a particular type over another in establishing plots, the area of each cover type should be equally proportionate to its availability. The percent of available area cleared in each cover type was plotted against the percent of to-tal available area represented by each cover type, at each 1 pixel interval from access (Figure 4). We ex-pected the points to fall along a line representing a 1:1 relationship of percent cleared to percent
avail-able. Points deviating from this line were examined by their residuals. Proportional clearing greater than availability had positive residuals, while proportional clearing less than that available had negative residu-als, and equal proportions were close to zero. Results show that clearing inmedioforest is not significantly different than the expected pattern (mean residual = −0.5%, t = −1.607). The mean residual ofbajoforest clearing shows the greatest deviation from what was expected based on availability (−9.7%); the
cantly negative residuals suggesting that bajo is avoided in farm plot establishment. Positive mean re-siduals and significant t-test results foraltoforest and
guamiltypes (5.4% and 8.1%) indicate that a greater proportional area was cleared in these types than their availability at each interval from access. This sug-gests a preference for these types in plot establish-ment, with a slightly higher propensity for using fal-low fields where available.
Conclusions
Information from a household level survey in the study area (Schwartz 1998) provided the socio-eco-nomic context for the analysis of land cover and land use change from the time-series database. Analysis of the database provided a general examination of the use of clearing and fallow in adaptive strategies. For example, the overall trend toward avoidance of clear-ing inbajossuggests a lack of adaptation by migrants from the highlands of southern portions of Guatemala to traditional lowland farming techniques. Indeed, Sever (1998) suggests that the Ancient Mayans farmed the seasonally flooded, lowland bajos, and that the techniques that they employed may be an im-portant clue to the question of how the civilization supported such high population densities.
Prior to the rapid immigration and population ex-plosion that began in the region around 1970, the
tra-ditional cultivation system used by Peteneros was based on swidden or shifting cultivation agriculture and the collection of NTFPs (Schwartz 1990). These patterns are apparent in Carmelita, the oldest estab-lished community in the study area in which farming is not heavily relied upon and where most people in the community receive the major portion of their in-come from the collection of NTFPs (Schwartz 1998). Here, the results of the time-series database analysis show more balanced clearing to regrowth ratios, low instances of clearing overall, and that where clearing does occur it is often in previously used fields rather than high forest. In contrast, the high clearing to re-growth ratios and low instances of clearing in previ-ously used fields within communities of the buffer zone suggest the lack of these adaptations, as well as the use of high forest for establishing permanent pas-ture lands.
Utility and limitations of the data
The construction of the time-series database using re-mote sensing image classification and change detec-tion methods coupled with GIS analysis techniques provide a useful tool to monitor forest change over time in a spatially explicit manner. The structure of the database allows for the relationships of landscape variables to forest clearing and regrowth to be readily analyzed. Deforestation patterns can be identified and studied, and there is potential to link the database to
other spatially explicit data sets for further analysis and modeling of the causes and effects of land cover and land use change. However, the availability and quality of the input data can limit the utility of the database. Potential sources of error in the remote sensing analysis can include misclassification and er-rors in change detection (overall accuracy of change detection methods was 85%) and the discrimination of small roads and trails. Classification of satellite imagery requires sufficient ground-level data for training algorithms and validation. The lack of histor-ical ancillary data available for this purpose is a com-mon problem in change detection studies. One artifact of the lack of sufficient ground data in this study was the inability to spectrally discriminate different land use classes in the imagery (e.g. crop fields vs. pas-ture). As a result, the database can identify and track changes in landcover, while landusecan only be in-ferred based on the temporal and spatial patterns of land cover change (e.g. “fallow” inferred from forest regrowth). The spatial and temporal scale at which imagery was collected also limits remotely sensed data. The temporal scale of the available imagery was a limiting factor in this study. Length of time between dates of imagery varied, with greater lengths of time in the earlier time periods greater (4 to 7 years). As the length of time between observation increases, the potential for error increases. Kimes et al. (1998) re-viewed the potential error from “temporal gaps” in-volved in sequential satellite image analyses of trop-ical forests.
Future research is recommended to address these concerns and further strive towards more explicitly linking land cover and land use change data from re-mote sensing and GIS analysis with ground-level so-cio-economic data. Such linkages hold promise for using the social, economic, and political information gathered at the household level to explain the patterns observed in the time-series spatial data. Conservation organizations and international donors are interested in the potential of satellite monitoring techniques. For example, successful satellite monitoring of change among forest community concessions may reduce the reliance on repeated household level socio-economic surveys which are time consuming, costly, and con-sidered an invasion of privacy by some participants. In some cases, the interviewer suspected biased or “courtesy” answers, as the interviewees understood the legal and political implications of forest clearing activities in some protected units of the MBR (Schwartz 1998). Remote sensing observations of
for-est clearing size, location and patterns can provide an objective source of information to compare or cross-check with NTFP harvester, farmer and rancher household survey results.
References
Cohen W.B., Fiorella M., Gray G., Helmer E. and Anderson K. 1998. An efficient and accurate method for mapping forest clearcuts in the Pacific Northwest using Landsat imagery. Pho-togrammetric Engineering and Remote Sensing 64: 293–300. Congalton R.G. and Green K. 1999. Assessing the Accuracy of
Remotely Sensed Data: Principles and Practices. CRC Press, Boca Raton, FL, USA, 137p.
Culbert T.P. 1993. Maya Civilization. Smithsonian Institution, Washington D.C., USA.
De Pietri 1995. The spatial configuration of vegetation as an indi-cator of landscape degradation due to livestock enterprises in Argentina. Journal of Applied Ecology 32: 857–865. Eckhardt D.W., Verdin J.P. and Lyford G.R. 1990. Automated
up-date of an irrigated lands GIS using SPOT HRV imagery. Pho-togrammetric Engineering and Remote Sensing 56: 1515–1522. ERDAS 1997. ERDAS (v.8.3) Field Guide. 4th edn. ERDAS Inc.,
Atlanta, Georgia, USA.
ESRI 1998. ARC version 7.2.1. Environmental Systems Research Institute. Redlands, California, USA.
Fearnside P.M. 1986. Spatial concentration of deforestation in the Brazilian Amazon. Ambio 15: 74–81.
Fox J.J., Krummel S., Yarnasarn M., Ekasingh and Podger N. 1995. Land use and landscape dynamics in northern Thailand: Assess-ing change in three upland watersheds. Ambio 24: 328–334. Frohn R.C., McGwire K.C., Dale V.H. and Estes J.E. 1996. Using
satellite remote sensing to evaluate a socio-economic and eco-logical model of deforestation in Rhondônia, Brazil. Interna-tional Journal of Remote Sensing 17: 3233–3255.
Hall et al. 1991. Radiometric rectification: toward a common ra-diometric response among multidate, multisensor images. Re-mote Sensing of Environment 35: 11–27.
Hayes D.J. and Sader S.A. 2001. Change detection techniques for monitoring forest clearing and regrowth in a tropical moist for-est. Photogrammetric Engineering and Remote Sensing 67: 1067–1075 (in press).
Jensen J.R. 1996. Introductory Digital Image Processing. 2nd edn. Prentice-Hall, Upper Saddle River, NJ, USA, 316p.
Jensen J.R., Rutchey K., Koch M.S. and Narumalani S. 1995. In-land wetIn-land change detection in the Everglades Water Conser-vation Area 2A using a time series of normalized remotely sensed data. Photogrammetric Engineering and Remote Sens-ing 61: 199–209.
Kimes D.S., Nelson R.F., Skole D.L. and Salas W.A. 1998. Accu-racies in mapping secondary tropical forest age from sequen-tial satellite imagery. Remote Sensing of Environment 65: 112– 120.
Interna-tional Workshop on Biodiversity Monitoring. Brazilian Institute for Environment and Renewable Resources, Pirenopolis, Bra-zil, pp. 129–144.
Lambin E.F. 1994. Modelling Deforestation Processes: A Review. Tropical Ecosystem Environment Observations by Satellites (TREES) Research Report No.1. European Commission, Lux-embourg.
Liu D., Iverson L.R. and Brown S. 1993. Rates and patterns of de-forestation in the Philippines: application of geographic infor-mation system analysis. Forest Ecology and Management 57: 1–16.
Meyer W.B. and Turner B.L. II 1994. Changes in Land Use and Land Cover: A Global Perspective. University of Cambridge, University press, Cambridge, UK, 537p.
Nations J.D., Primack R.B. and Bray D. 1998. Introduction: the Maya Forest. In: Primack R.B., Galleti H.A., Bray D. and Pon-ciano I. (eds), Timber Tourists and Temples. Island Press, Washington D.C., USA.
Rice D.S. 1991. Roots. Natural History 1991: 10–14.
Rindfuss R.R. and Stern P.C. 1998. Linking remote sensing and social science: the needs and challenges. In: People and Pixels, Linking Remote Sensing and Social Science. National Acad-emy Press, Washington D.C., pp. 1–27.
Running S.W., Peterson P.L., Spanner M.A. and Teubler K.B. 1986. Remote sensing of coniferous leaf area. Ecology 67: 273–276. Sader S.A. and Joyce A.T. 1988. Deforestation rates and trends in
Costa Rica, 1940-1983. Biotropica 20: 11–19.
Sader S.A., Stone T.A. and Joyce A.T. 1990. Remote sensing of tropical forests: an overview of research and applications using non-photographic sensors. Photogrammetric Engineering and Remote Sensing 56: 1343–1351.
Sader S.A., Sever T.L., Smoot J.C. and Richards M. 1994. Forest change estimates for the northern Petén region of Guatemala. Human Ecology 22: 317–322.
Sader S.A. 1995. Spatial characteristics of forest clearing and re-growth as detected by Landsat Thematic Mapper Imagery. Pho-togrammetric Engineering and Remote Sensing 61: 1145–1151.
Sader S.A., Reining C., Sever T. and Soza C. 1997. Human migra-tion and agricultural expansion: a threat to the Maya tropical forests. Journal of Forestry 1997: 27–32.
Sader S.A., Hayes D.J., Coan M., Hepinstall J.A. and Soza C. 2001. Forest change monitoring of a remote biosphere reserve. Inter-national Journal of Remote Sensing 22: 1937–1950. Schwartz N.B. 1990. Forest Society. University of Pennsylvania
Press, Philadelphia, PA, USA.
Schwartz N.B. 1998. Time series changes in land use: social sci-ence report, phase 1. Submitted to University of Maine, Orono, MA, USA, NASA LCLUC Program, Contract NAG5-6041. Sellers P.J. 1985. Canopy reflectance, photosynthesis, and
transpi-ration. International Journal of Remote Sensing 6: 1335–1372. Sever T.L. 1998. Validating prehistoric and current social phenom-ena upon the landscape of the Petén, Guatemala. In: People and Pixels, Linking Remote Sensing and Social Science. National Academy Press, Washington D.C., USA.
Singh A. 1986. Change detection in the tropical forest environment of northeastern India using Landsat,Remote Sensing and Trop-ical Land Management. John Wiley and Sons, New York, NY, USA, 365p.
Skole D. and Tucker C. 1993. Tropical deforestation and habitat fragmentation in the Amazon: satellite data from 1978 to 1988. Science 260: 1905–1910.
Tucker C.J. 1979. Red and photographic infrared linear combina-tions for monitoring Vegetation. Remote Sensing of the Envi-ronment 8: 127–150.
Turner M.G. and Gardner R.H. (eds) 1991. Quantitative Methods in Landscape Ecology. Springer-Verlag, New York, NY, USA, 536p.
Turner M.G. 1990. Spatial and temporal analysis of landscape pat-terns. Landscape Ecology 4: 21–30.