Volume 24, Number 3, 2009, 363 – 371
THE IMPACT OF FORESTRY SECTOR PERFORMANCE ON
ECONOMIC INCOME GROWTH: A SOCIAL ACCOUNTING
APPROACH
1Nur Arifatul Ulya
Forestry Research Institute Palembang, Forestry Research and Development Agency, Ministry of Forestry Republic of Indonesia
Syafrul Yunardy
Regional Development Planning Agency of South Sumatera Province, Indonesia ([email protected])
Abstract
Framework for Socio-economic Accounting System or the Social Accounting Matrix (SAM) states that the distribution of income received by each production factor specified in terms of economic sector concerned and called the factorial income distribution. Value added generated from the sum of total wages and salary plus capital income. Total of value added showed gross domestic product (GDP). Impact of Indonesia's forestry sector performance can be measured by knowing its contribution to economic income growth.
This paper discusses the impact of output growth in the forestry sector to factor income growth using Socio-economic Accounting System or the Social Accounting Matrix (SAM) approach. The impact of forestry sector production growth can be used to measure economic growth. Accounting multiplier is used to calculate the impact of output growth in the forestry sector to factor income growth in the year 2000 until the year 2005.
Forestry sector for 5 years (2000-2005) gave a positive contribution to income growth. There are 16 economic sectors contributes positively to the factor income. Decrease in income growth occurred only on one factor of production, which are; Laborship, Leadership, Administration, Military, Professionals Recipients of Wages & Salaries in the Village. Forestry sector as a whole increases income growth of 104.64 percent during the years 2000-2005.
Keywords: accounting multiplier, production factor, SAM, value added
INTRODUCTION1
Forest resources have become a major capital of Indonesia economic development in three last decades. It’s provided a positive impact on increasing government revenue, labor absorption and boosts regional
develop-1 This Article presented at 2nd IRSA Institute held on
22-23 July 2009 at Bogor Agriculture University.
in 2002, but the value added was increased from Rp. 141 trillion to Rp. 36.2 trillion (BPS, 2003).
Labor absorption of forestry sector in 1980 accommodated approximately 113 thou-sand people, and to about 179 thouthou-sand people 1985. In 1990 the amount labor of forestry sector was 285 thousand people and reached its peak in 1997 (388 thousand people). In 2000, labor absorption of forestry sector recorded approximately 3.092.470 people, with an average income of worker in conces-sionaire company amounted Rp. 7.3 million/ person/year and for industry amounted to Rp. 3.3 million/person/year (Simangunsong, 2004).
About 100 million people depend on forest products, both as goods and services to fill daily needs and also as source of income. At least one-third of rural population depends on the availability of firewood, drug crop, food, organic manure from forest floor to fill daily needs and as source of income (Vitalaya, 2004).
Forestry development also has a far greater contribution to regional development. This is shown by opening access of remote areas through availability of logging road for public roads in and around forest, increasing employment opportunities, and increase revenue of local government and society.
Data and information mentioned above can illustrate the contribution of forestry sector in Indonesia economic and development. However, those data and information cannot give information about the impact of forestry sector performance on economic income growth. This research was conducted to identify the impact of the increased output of forestry sector production on economic income growth. The amount of impact of the increased output of forestry sector production on production factor income can be used to measure the growth of economic income which represented by income of production
factor. The result of this research is expected to be utilized as a basis for determining the direction of forestry policy to boosts economic growth.
RESEARCH METHODOLOGY
The research used The Social Accounting Matrix (SAM) Model as approach. Accounting multiplier used to calculate the impact of the increased output of forestry sector production on production factor income growth in the year of 2000 and 2005.
The Indonesian SAM data that published by BPS used as the main data. These research analyzed the Indonesian SAM data that published in year 2000 and 2005. BPS publishes the Indonesian SAM every 5 years and has done this since 1975. The fact that many researchers—for example Lewis (1991), Thorbecke (1992), Azis (2000), Azis &
Mansury (2003), Bourguignon et al. (2003)
and Clements et al. (2007)—have used these
SAMs in their publications indicates the validity and reliability of the SAMs published by BPS (Hartono & Resosudarmo, 1998).
A. Framework of SAM
SAM is a traditional double accounting economic matrix in the form of a partition matrix that records all economic transactions between agents, especially between sectors in production blocks, sectors within institution blocks (including households) and sectors within production factors, in the economy (Pyatt & Round, 1979; Sadoulet & de Janvry, 1995; Hartono & Resosudarmo, 1998). It is a solid database system, since it summarizes all transaction activities in an economy within a certain period of time, thus giving a general picture of the socio-economic structure in an economy and illustrating the income distribution situation.
on a household’s income, hence illustrating the economic policy impact on income distribution; and (2) the application is relati-vely simple; thus, it can easily be applied to various countries (Hartono & Resosudarmo, 2008). As a data framework, the SAM is a snapshot which incorporates explicitly various crucial transformations among variables, such as the mapping of factorial income distribution from the structure of production and the mapping of the household income distribution from the factorial income distribution (Thorbecke, 1985).
If the SAM is to be used as a modular analytical framework complementary to its role as a data framework, the forms of the relationships underlying these transformations and mappings among variables have to be specified in a causal way through an appropriate set of behavioral and technical relations in at least a comparative-static if not dynamic setting. Furthermore, this conceptual framework, in order to be useful for policy purposes, should include potential policy means which can be controlled to move the system in the direction of growth and equity consistent with the preferences of the policymakers. Hence, in what follows, an attempt is made to identify the major causal relationships which a comprehensive and consistent conceptual planning framework should contain and to show how these relationships are implicitly-if not explicitly-incorporated into the SAM data system (Thorbecke, 1985).
The Social Accounting Matrix (SAM) has become used increasingly in the last years as a general equilibrium data system linking, among other accounts, production activities, factors of production and institutions (com-panies and households). As such, it captures the circular interdependence characteristic of any economic system among (a) production, (b) the factorial income distribution (i.e. the distribution of value added generated by each production activity to the various factors), and
(c) the income distribution among institutions and, particularly, among different socio-economic household groups.
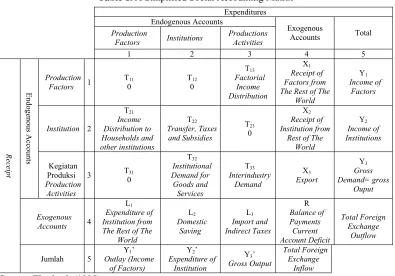
Under certain assumptions, such as excess capacity (i.e. availability of unused resources) and fixed prices, the SAM can be used as the basis for simple modeling. More specifically, the effects of exogenous injections on the whole economic system can be explored by multiplier analysis which requires partitioning the SAM into endogenous and exogenous accounts. Typically the former include (i) factors; (ii) institutions (companies and households); and, (iii) production activities; while the exogenous accounts consist of (iv) government; (v) capital; and (vi) rest of the world. Figure 1. Illustrates the major interrelationship among principal SAM accounts
Production
Note: T stands for the corresponding matrix in the simplified SAM that appears in table 10.1. Thus, for example, T1.3 refers to the matrix at the intersection of row 1 (account 1), that is, “factors” and column 3 (account 3), that is,”production activities”.
Source: Thorbecke (1985).
Figure 1. The major interrelationship among principal SAM accounts
Table 1. A Simplified Social Accounting Matrix
Expenditures Endogenous Accounts
Production
Factors Institutions
The major causal relationships which are shown in the interdependent diagram in Figure 1 find their counterpart in the simplified SAM data system presented in Table.1. Thus, the factorial income distribution is derived from the value added generated by various produc-tion activities - a transformaproduc-tion that is represented by matrix T13 (the intersection of row 1, "factors," and column 3,”production activities") in Table 1. Likewise, the mapping of the distribution of income among institutions (including households) from the factorial income distribution is given by matrix T2.1. In addition, the former distribution is affected by transfers, taxes, and subsidies which appear in T22. The final loop in Figure 1, showing the expenditures of institutions on the various commodities supplied by the production activities, appears on Table 1 as T32.
It is important to recall that in a SAM table the various causal relations (such as those shown in Figure 1) reveal the situation prevailing at one point in time. The causal process which generates any given SAM may be very complex and nonlinear and would have to be explicitly specified in equation form in a conceptual model. The generating mechanism is, of course, not reflected in the resulting static matrices in Table 1. Only in a special (linear) case does the SAM as a data system become identical with the SAM as a conceptual framework or model.
The basic framework of a SAM is a 4x4
partition matrix as shown in Table 1. The
accounts in a SAM are grouped into endoge-nous and exogeendoge-nous accounts. The main endogenous accounts are divided into three blocks: production factor, institutional and production activity blocks. The row shows income, while the column shows expenditure.
Sub-matrix Tij shows the income of the
account in row i from the account of column j.
Vector Yi shows the total incomes of all
accounts, and vector Yj’ shows the total
expenditure account of all accounts. In
addition, SAM requires that the vector Yi is the same as vector Yj’, or in other words Yj’ is a transpose of Yi, for every i = j. The relations in Table 1 can be written as (Defourny and Thorbecke, 1984).
Y = AY + X
where Y is total income (receipts) vectors of the first three accounts ; X represent the vector of exogenous injection of the other accounts (namely, capital and rest of the world); and A
the matrix whose members are Aij = Tij/
Y
ˆ
j .B. Multiplier Analysis
Multiplier analysis in SAM model can be divided into two main group, that is: accounting multiplier and fixed price multiplier. Accounting multiplier basically the same with multiplier from Leontief Inverse Matrix in Input-Output model. It means that all multiplier analysis in Input-Output model can be used in SAM analysis (Thorbecke, 1985).
An accounting multiplier matrix in a SAM framework is very important since it captures overall impacts of changes in a particular sector on other sectors within the economy, and is thus also used to explain the impacts of changes in exogenous accounts on endogenous accounts. The accounting multiplier matrix, which is a standard inversion of the (I-A) matrix, can be derived from the basic SAM framework and written as (Defourny and Thorbecke, 1984).
Thorbecke (1985) explained that ach of
the elements of the Tij matrices can be
expressed as a proportion of the corresponding column sum total which yields a new set of matrices Aij. Thus, Aij is obtained from Tij by dividing elements of the latter by the sum of the column in which they appear,
1 ˆ−
= ij j
ij T Y
where Yˆj−1 is a diagonal matrix of column sums.
Since the fourth row and column represent the sum of all other accounts which are assumed to be exogenously given, it follows
that the vectors of injections Xi and of
leakages Lj, respectively, are determined
outside the SAM framework. Conversely the endogenous part of the SAM consists of the income and expenditure determination of the first three accounts (factors, institutions, and production activities). Hence, the five nonzero A, matrices representing the interacting endo-genous part of the SAM can be grouped into a corresponding partitioned matrix A such that
⎥
It follows that
Y = AY + X (3)
where Y stands for the total income (receipts) vectors of the first three accounts and where X represents the vector of exogenous injections of the other accounts (namely, capital and rest of the world), which accrue as receipts or income to accounts 1 to 3.
It follows (3) that
Y = (I-A)-1X (4)
The meaning of this equation is that the income levels of factors (Yl), institutions (Y2), and production activities (Y3) are endogenous-ly determined as functions of the exogenous demand on the other accounts. All the beha-vioral and technical coefficients of the underlying interdependent system are expli-citly incorporated in the partitioned (fixed coefficient) matrix A. Thus, by way of illus-tration, Al3allocates the value added generated by the various production activities to the various factors such as labor skills as a propor-tion of the value of gross output of each
activity (sector). Likewise, A33 represents the intermediate (input-output) demand. As such, the elements of A13 and A33 must be based on an empirical knowledge of the sectoral duction functions. Each column of the pro-duction activities account represents, in fact, a linear Leontief-type sectoral production function.
If Ma = (I – A)-1 so:
Y = Ma X (5)
The Ma = (I – A)-1 is known as accounting multiplier matrix, which shows global impacts of changes in a particular economic sector on other sectors. Where A is direct coefficients that show change of a sector to other sectors.
Ma which known as accounting multiplier matrix explained that change 1 unit output of a sector will change output of whole economic sector will equal to Ma. Assumed that fixed price variable and income (expenditure) elasticity is 1.
To analyze the impact of the increased output of forestry sector production on total
economic sectors, the accounting multiplier
(Ma) used as basic analysis. Every 1 unit shock (injection) on forestry sector will give impact on total economic sector equal to the Ma (accounting multiplier).
THE IMPACT OF FORESTRY SECTOR PERFORMANCE ON ECONOMIC INCOME GROWTH
The core of the production activities are the production activity, production factors and institutions as owners of production factors. In SAM framework, income received by production factors can be specified by econo-mic sector that referred as factorial income distribution. Value added generated by output sales, wage and salary, and capital earning, where total value added mean Gross Domestic Product (GDP).
Accounting multiplier can be used to identify the impact of forestry sector perfor-mance on economic income growth. Accounting multiplier can provide information about contribution of the increased output of forestry sector production on increasing of economic income (GDP). This accounting multiplier originated from addition of accounting multiplier of labor production factors and accounting multiplier of non-labor production factors (government and private capital). High amount of accounting multiplier of production factors reflects high impact forestry sector performance on GDP growth.
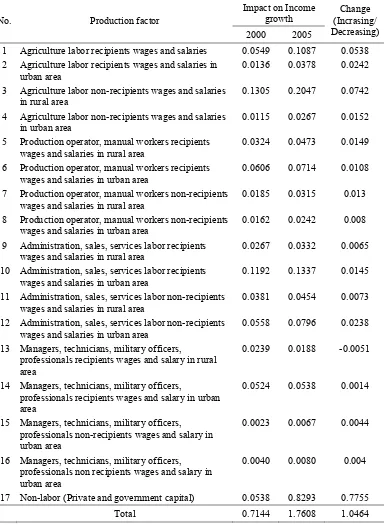
Tables 2 show the contribution of forestry sector performance on production factors income growth. Accounting multiplier provide information about impact of improvement 1 unit output of forestry sector on distribution and increasing of production factors income. By analyzing the impact of increased of forestry sector production on production factors income in the year 2000 and 2005, the forestry sector's performance in that period can be identified.
Tabel 2 shows that during 5 year (2000-2005) forestry sector give positive contri-bution on production factors income growth for whole economic sectors. Positive contri-bution given by the 16 production factors in which 15 production factors included in the group of labor production factor and 1 production factor is non-labor production factor (private sector and government capital).
Decreasing of income only happened at 1 production factor (managers, technicians, mili-tary officers, professionals recipients wages and salary in rural area). Its means that generally forestry sector during year 2000 and 2005 boost production factors income growth both labor and non-labor production factors.
The highest production factor income growth impact occurred in non-labor pro-duction factor as private sector and govern-ment capital (0.7755). Its means, that every improvement of 1 unit forestry sector output will improve non-labor production factor (private sector and government capital) inco-me equal to 0.7755 units. This fact indicates that production factor income growth in Indonesia economy during 2000-2005 is more driven by macro sector growth than micro sector.
Highest growth of labor production factor occurred in agriculture labor non-recipients wages and salaries in rural area (0.0742). Its means, that every improvement of 1 unit forestry sector output can improve income of agriculture labor non-recipients wages and salaries in rural area equal to 0.0742 unit. While for the production factor managers, technicians, military officers, professionals recipients wages and salary in rural area every improvement of 1 unit forestry sector output during 2000-2005 causing decreasing income equal to 0.0051 units. This shows that the growth factor is more based on informal activities when compared with formal activities.
Table 2. The Impact of Forestry Sector Performance on Economic Income Growth
Impact on Income growth
No. Production factor
2000 2005
Change (Incrasing/ Decreasing)
1 Agriculture labor recipients wages and salaries 0.0549 0.1087 0.0538
2 Agriculture labor recipients wages and salaries in urban area
0.0136 0.0378 0.0242
3 Agriculture labor non-recipients wages and salaries in rural area
0.1305 0.2047 0.0742
4 Agriculture labor non-recipients wages and salaries in urban area
0.0115 0.0267 0.0152
5 Production operator, manual workers recipients
wages and salaries in rural area
0.0324 0.0473 0.0149
6 Production operator, manual workers recipients
wages and salaries in urban area
0.0606 0.0714 0.0108
7 Production operator, manual workers non-recipients
wages and salaries in rural area
0.0185 0.0315 0.013
8 Production operator, manual workers non-recipients
wages and salaries in urban area
0.0162 0.0242 0.008
9 Administration, sales, services labor recipients wages and salaries in rural area
0.0267 0.0332 0.0065
10 Administration, sales, services labor recipients wages and salaries in urban area
0.1192 0.1337 0.0145
11 Administration, sales, services labor non-recipients wages and salaries in rural area
0.0381 0.0454 0.0073
12 Administration, sales, services labor non-recipients wages and salaries in urban area
0.0558 0.0796 0.0238
13 Managers, technicians, military officers,
professionals recipients wages and salary in rural area
0.0239 0.0188 -0.0051
14 Managers, technicians, military officers,
professionals recipients wages and salary in urban area
0.0524 0.0538 0.0014
15 Managers, technicians, military officers, professionals non-recipients wages and salary in urban area
0.0023 0.0067 0.0044
16 Managers, technicians, military officers, professionals non recipients wages and salary in urban area
0.0040 0.0080 0.004
17 Non-labor (Private and government capital) 0.0538 0.8293 0.7755
Total 0.7144 1.7608 1.0464
POLICY IMPLICATION
During 2000-2005 period, Indonesia forestry sector has been able to demonstrate its performance through increased Indonesia economic income (GDP) that indicates by the increased impact of production factor income and added value. Almost all of production factors both labor and non-labor (private and government capital) has increased the impact of income growth. This could be the basis for policy in order to provide more incentives to boost output of forestry sector.
Increased impact of factor income growth caused by the forestry sector's performance was more driven by the growth of macro sector (government and private capital) than the micro sector (real). Therefore, to prevent growing income and capital disparities it’s important to accelerate the distribution of credit/assistance for small and medium scale businesses for the people who live around and has economic activities in forestry sector.
The contribution of the forestry sector to increase economic growth through increasing the impact of the production sector growth during the years 2000-2005 were still rely on informal activities. This requires policies that can promote economic growth while enhancing the formal activities. Strategies that can be done are to increase among business units and scale the forestry sector.
REFFERENCES
Defourny, J., Thorbecke, E., 1984. “Structural path analysis and multiplier decompo-sition within a social accounting matrix
framework”. Economic Journal. 94, 111–
136.
Hartono, D., Resosudarmo, B.P., 1998. “ Eksis-tensi matriks pengganda dan dekomposisi matriks pengganda Pyatt dan Round dari sistem neraca sosial ekonomi. Ekonomi dan Keuangan Indonesia” [Multiply matrix existence and Pyatt & Round
multiply matrix sosio-economy balance
sheet]. Ekonomi Keuangan Indonesia
[Indonesian Financial Economy], 2 46 (4), 73–496.
Hartono, D., Resosudarmo, B.P., 2008. “The economy-wide impact of controlling energy consumption in Indonesia: An analysis using asocial accounting matrix
framework”. Energy policy, 36,
1404-1419.
Pyatt, G., Round, J., 1979. “Accounting and fixed price multipliers in a social
accounting matrix framework”. Economic
Journal, 89, 850–873.
Sadoulet, E., de Janvry, A., 1995. Quantitative Development Policy Analysis. Baltimore: Johns Hopkins University Press.
Simangunsong, B.C.H., 2004. The Economic Performance of Indonesia’s Forestry Sector in The Period 1980-2002. Briefing Paper#4. GTZ-SMCP. Jakarta.
Thorbecke, E., 1985. The social accounting matrix and consistency-type planning model in Pyatt, G. and J. I. Round Eds. Social Accounting Matrices A Basis for Planning. Washington DC: The World Bank.
Vitalaya, A. 2004. Pemiskinan Masyarakat