Volume 26, Number 1, 2011, 103 – 128
PUBLIC SECTOR EFFICIENCY IN INDONESIA
(FISCAL DECENTRALIZATION ERA, 2001
–
2008)
1Mayanggita Kirana
Universitas Gadjah Mada ([email protected])
Samsubar Saleh
Universitas Gadjah Mada ([email protected])
ABSTRACT
While many developing countries have devolved public responsibilities to local governments in recent years, some studies have examined whether decentralization actually leads to greater public sector allocation efficiency. This paper approaches this question by assessing the efficiency of government expenditure on public sector under fiscal decentralization. The area of public expenditure is of great importance making the findings have strong implications with regard to public sector efficiency.
We compute public sector performance (PSP) and public sector efficiency (PSE) indicators, comprising of composite and 9 sub indicators, for 33 provinces in Indonesia. The first 6 sub indicators are opportunity indicators that take into account education, health outcomes, poverty, gender equality, quality of public infrastructure (transportation and energy). 3 order indicators reflect the standard musgravian tasks for the government: allocation, distribution, and stabilization. The input and output efficiency of public sectors across provinces is then measured using a non-parametric production frontier technique. Free Disposable Hull (FDH) analysis is used to estimate the extent of slack in government expenditures. The study finds significant differences in PSP and PSE, which suggests a large potential for expenditure savings in many provinces. All these findings suggest diminishing marginal products of higher public spending.
We also estimate a semi parametric model of the public sector production process by regressing FDH analysis output scores on non discretionary variables using the Tobit procedure. We show that inefficiency is strongly related to GDP per capita, human development index, and degree of fiscal dependence. The central message of this paper is that increasing budgetary allocations for public sector may not be the only or most effective way to increase public sector outcome, and that more attention should be given to increasing the efficiency of expenditure.
Keywords: fiscal decentralization public sector performance, public sector efficiency, free disposable hull, Tobit
Journal of Indonesian Economy and Business January 104
INTRODUCTION
In providing public goods, the role and functions of the government cannot be ex-cluded (Hyman, 2008) which consist of distribution functions, allocation, and stability which all influences allocation of government expenditure. The government also plays an active role in actualizing the achievement of development goals through government activi-ties in the economy, particularly in relation to provision of public goods or related to the primary functions of the government.
Funding of the public sector cannot be separated from budget management which frequently contradicts the emergence of urgent needs to stabilize the economy and guarantees fiscal stability in the long term, however ignoring government expenditure efficiency. Gupta, et al. (2001), suggested that large budget al.locations do not serve as effective measures in improving outcomes; rather, it is the increase of efficiency towards the govern-ment expenditures that must be emphasized.
The initial periods of fiscal decentraliza-tion implementadecentraliza-tion was marked by a high dependency of the regional financial structure towards the Regional Government Budget (APBD Pemda). Alm (2000) observed the actions of the regional government in optimizing the PAD. The observations indicate that following the enactment of Law No.22, 1999 and Law No.25, 1999, the region intensified additional levies. The actions were consistent with the recommendations of the Regional Autonomy Implementation Monitor-ing Commission (RAIMC) (Komisi Pemantau Pelaksana Otonomi Daerah-KPPOD) who had made a recapitulation of the total Regional Regulations following the implementation of regional autonomy. RAIMC discovered a significantly increased number of regional laws related with tax and levy.
Such aspects do not serve as the primary goals from fiscal decentralization. De Mello et al. (2000) elaborated that decentralization is
basically aimed to bridge the government closer to the society, expecting to result in public sector efficiency, both from the aspects of transparency and accountability, as well as in the execution of public service and policy making. Accordingly, decentralization should be aimed to provide heightened benefits to the welfare of the local community.
Decentralization is in fact an instrument to actualize the ideals of an efficient and participative government management system (Tanzi, 2002). In this case, decentralization does not serve as a goal. However, it must be understood that decentralization is a complex instrument; therefore it becomes implausible to merely relate it with one single goal. Decentralization may consist of several goals, and this may lead to over-expectations from the policy (Bird, 1999). However, expectations for improved public service, reduction in poverty, although having to add to the dimensions of decentralization, is actually common and even said to be valid. Dillienger (1994), with his observations concerning implementation of decentralization in several parts of the world, discovered that the policy is actually triggered by desires or efforts to obtain a better public service.
Fiscal decentralization itself is expected to affect government expenditure allocations in form of government expenditure efficiency and also of equal importance is the improvement of public sector performance and efficiency (Adam et al., 2008; Akin et al., 2005; Bardhan, 2002; Ebel et al., 2002; Scully, 2001). Such claims are based on the assumption that the Regional Government holds a better understanding concerning the conditions, needs, and aspirations of the people compared to the central government, therefore each allocation from the
are expected to speed up the process of attaining the goals of development.
The implementation of fiscal decentraliza-tion in Indonesia is marked by several important events, both positive and negative events that may be utilized as a framework for evaluation, to improve the implementation of regional autonomy. In its positive aspect, decentralization provides positive benefits towards income distribution to the people through expenditure policies in the public sector, fiscal policy, as well as balance fund designs which bring particular emphasis on policies of reducing regional disparities (De Mello et al., 2000; Enikopolov et al., 2006; Stegarescu, 2005; Vazguez, 2001; Zhang, 1996). Regional disparities which are corrected through balance fund policies which use formulas relatively fair formulas balance the equalization standards that have been performed in several countries including China, Brazil, Canada, and Russia, by using rational, transparent, and accountable methods and have very positive implications towards regional development. Numerous empirical evidence in several countries indicate that the implementation of broad decentralization and provision of autonomy to a region or state, together with efforts of stabilization in the political, social, and economical aspects, will result in an impressive outcome. Success of decentralization requires the support of institutions and availability of competent and qualified human resources, availability of funds to increase the required community services, efficient tax administration, adequate tax levy authorization to cover all community income levels and groups, elasticity towards community service demands, representative local officials, transparency in formulating the budget in addition to regional tax consistent with the needs of the local community.
Decentralization may also be viewed as a means to expand authority and accountability from the regional apparatus. Decision making in the local level will reinforce responsibility,
increase a sense of ownership and of course incentive towards the regional apparatus. It is evident that providing larger responsibility and authority to the regions will improve the quality and efficiency of public service (Bardhan, 1997).
However empiric studies concerning decentralization that demonstrate opposing views are also abundant. Decentralization is certainly not a super remedy that can solve all public issues. Several complexities are evident that may result in the degradation of public service as well as economic development. From the negative perspective, fiscal decentralization may result in the following; first, the tendency for each region to prioritize the interests of their own region and can even compete with other regions in various aspects, particularly in obtaining PAD. Such events may occur, considering that regional auton-omy is translated as merely to increase PAD segments from the total regional budget (APBD). Second, the core of regional autonomy is focused on the district/ cities, however in fact, it is actually the district/ cities that are most dependent towards grants and aid from the central government, clearly demonstrated by the low PAD towards the total regional revenue compared to the size of the (grants) from the central government. Third, the presence of regional policies that encourage inflated economic expenditures (Kuncoro, 2004).
The Regional Government’s financial abilities are relatively limited compared to the needs to provide basic infrastructure as well as the several facilities of public service in the country. The relationship between welfare is viewed from the perspective as to how the development of the quality of basic public service quality, namely education, health, and infrastructure are considered to possess a strong influence towards the level of poverty within the society (Von Braun, 2002).
Journal of Indonesian Economy and Business January 106
and responsibilities that are bestowed upon them. Separation of financial responsibilities (funding) from the administration of expenditure may lead to inefficiency. Fiscal transparency may even reach a low degree when the regional government is strong and independent. Decentralization can actually create market fragmentation (example: India and Russia). Moreover, levy from customs performed by the regions tend to interfere with domestic trade. Bahl (1999) and Tanzi (2000) denote that several conditions must be met prior to the implementation and success of fiscal decentralization. Such conditions relate with tax administration, public expenditure management systems, and hard budget constraints. Chu et al. (1995), in his study discovered that numerous developing coun-tries have actually created unproductive expenditures by the regional government.
Several problems entail the implementa-tion of regional autonomy, and its effects are frequently undesirable to the regional econo-my and counterproductive to the primary goals of regional autonomy and fiscal decentrali-zation. Inefficiency in expenditures of the regional government presumes and therefore making it more difficult to achieve the targets of development that should have been accelerated through the process of fiscal decentralization. It is actual impacts of decentralization directed towards the people that should serve as the primary indicators.
PROBLEM FORMULATION
One of the goals of decentralization and regional autonomy policy is to improve public service. By bringing closer relations of the government to the people, it is expected that government services can be implemented efficiently and effectively. The current study is vital considering that public service constitutes one of the pillars of indicating that the government has transformed to serve the sole benefits of the people. The regional government is demanded to provide better
public services towards the community, at least to cover the most basic aspects of life for example health, education, infrastructure, and services to the poor, in line with the imple-mentation of regional autonomy and fiscal decentralization through the management of the regional budget.
The focus of the study attempts to answer whether fiscal decentralization in Indonesia impacts the improvement of public sector performance and efficiency with regard to the attainment of development goal indicators. Therefore composite measurement is required towards a number of public performance indi-cators and relevant development indiindi-cators. In addition to measuring public sector efficiency and performance, factor analysis of non-discretionary inputs is also required to observe what influences public sector efficiency in Indonesia.
RESEARCH OBJECTIVES
1. Analyze a series of objective and repre-sentative indicators (as a composite of public performance indicators) to measure public sector performance and efficiency (Provincial Regional Government) in Indonesia that will be further developed to become a model of measuring public sector efficiency and performance.
2. Analyze public sector relative production efficiency between provinces by using the Free Disposable Hull (FDH) approach. 3. Analyze the factors influencing variations
of public sector performance and efficien-cy between regions using the Tobit approach.
METHODOLOGY
Public Sector Performance (PSP) and Public Sector Efficiency (PSE)
technically obtained by compiling the mus-gravian and socio-economic sub-indicators. The PSP value depends on particular econo-mic indicators, consisting of socio-econoecono-mic and musgravian indicators.
i: government unit i or referred to in this study as Pemda I (Regional Government I) j: government performance unit on sector j or
referred to kinerja pemerintah daerah sektor j (government performance in sector j) with the following equation;
) I ( f
PSPij k (2)
i: musgravian and socio-economic indicators k: sub indicators of each musgravian and
socio-economic indicators
As a result, changes in PSP depends on changes of relevant musgravian and socio-economic indicator values.
k
Therefore, larger positive influences of relevant public expenditure in each sub indicator of public performance will result in improvements or increases in the PSP index. Based on such analyses, changes that occur towards the socio-economic indicators can be viewed as changes in public sector performance.
The next step is to calculate public sector efficiency with the PSE index. Based on equation 3.1 and equation 3.3, public sector efficiency values can be calculated by comparing the public sector performance value index, which is measured using the PSP indicator, with numerous relevant public expenditure (PEX) used to achieve public sector outcome. Therefore the PSE index can be calculated using the following formula:
i
Marginal Productivity from public expenditure with positive values and reducing, therefore
0
To produce public sector performance from numerous indicator components with different units of measurement, therefore data normalization for each performance indicator is required. Normalization is performed by calculating the average, and subsequently dividing each value with the average. Meanwhile for indicators with reverse per-formance orientations (ex. Unemployment, namely the higher the unemployment, the lower the performance of the Regional Government economy unit), its normalization is conducted by dividing the average values with the values of those sub-indicators. It is assumed that each indicator gives equal contribution to each level of the performance targets, therefore each sub-indicator measure variable is given the same value.
Journal of Indonesian Economy and Business January 108
transportation consist of 3 components namely, the province road length, total number of ship visits to the ports, and total number of plane departures in national and international airports. Sub-indicators of energy consist of 2 components, namely electricity distribution to customers, and water distribution to custom-ers. Sub indicators of distribution consist of 1 component, referring to the gini ratio. The sub-indicator of stability consists of 2 components, namely GDRP growth rate and inflation rates. The sub-indicator of economic performance consists of 3 components, namely GDRP growth rates, GDRP per capita, and the rate of open unemployment.
Free Disposable Hull (FDH)
FDH is used to measure the relative efficiency of the production units. FDH is one of analysis techniques used for non-parametric approaches developed by Deprins, Simar, and Tulkens in 1984 (Afonso et al., 2005). Within this framework, FDH enables the creation of efficiency rankings for each production unit through a comparison of performance of each production unit with the PPF.
Measuring public sector efficiency with the FDH technique has been conducted by
Eeckhaut et al. (1993) in his study on effi-ciency of Belgium government expenditures. Fakin et al. (1997) later analyzed efficiency of government expenditure by using data from government public services with OECD and Central Europe. Clements (2000) studied efficiency of government expenditure in the education sector in the European Union. Gupta et al. (2001) also used the FDH technique to analyze government expenditure in the education and health sector in African countries. Aubyn (2002) used the FDH to analyze efficiency of government expenditure for administrative, education, social activities, basic sanitation, and protection towards 51 cities in Portugal. Similar to this study Afonso et al. (2005) also measured efficiency of government expenditure for public services in 23 industrial countries who are OECD members.
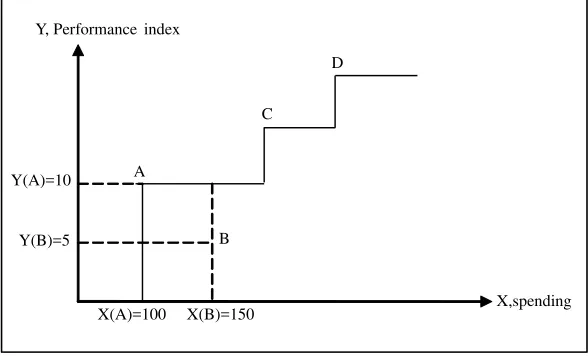
Figure 1 indicates that producer B is relatively more inefficient compared to producer A, because B uses larger output but gains smaller output compared to A. This implies that producer A is relatively more efficient compared to B. Producer C is relatively efficient because no other producer is able to gain an output equivalent to C, by
Source: Affonso et al (2005) Y, Performance index
D
C
A Y(A)=10
Y(B)=5 B
X,spending X(A)=100 X(B)=150
using a smaller input. Furthermore, producer D is relatively efficient because it uses a large input and gains a high output. Therefore D can be said to be relatively efficient.
In a simple sense, the FDH analysis identifies efficient and inefficient producers. Producers /UKE that are relatively inefficient are represented by a square in the low right relatively efficient and inefficient producers can be identified. However, to determine the degree of efficiency as well as to compare efficiency between producers, the efficiency score is required. The efficiency score is obtained by measuring the distance between
the producer’s production point with PPF.
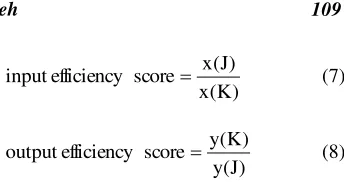
Measuring the distance between produc-tion point and PPF can be employed using 2 methods, namely input efficiency score or output efficiency score. Input efficiency score (IES) reflects the excess of input used by an inefficient producer compared to the relatively efficient producers. IES is equivalent to 1 for producers who are located on PPF, while, for inefficient producers, IES has a score of less than 1.
Output efficiency score (OES) reflects the degree of output that is unable to be achieved by the relatively inefficient producer compared to the relatively efficient producer, with equivalent levels of input or less. OES scores below 1 indicate that the producer is inefficient, while scores equivalent to 1 implies that the producer is on the PPF (efficient). In cases of production with one input and one output, the distance between the production point and PPF can be calculated with the following formula:
)
y (K) : total output used by a relatively ineffi-cient producer
while the distance between production
pint B with PPF, based on the output, is
Calculating the Tobit Regression
Journal of Indonesian Economy and Business January 110
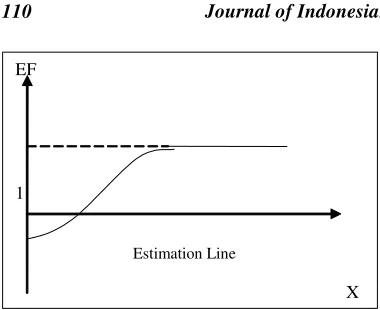
Figure 2. Tobit Model with Left Censored = 1
In this study, the public sector efficiency score (EFit) produced by the FDH method is determined by the non-discretionary inputs (Xit) variable which can be translated into the following equation:
The operational definitions of the varia-bles are as follows:
1. Life Expectancy Rate
Life expectancy refers to the estimation of
the average length of a person’s life (in
years) from birth in a particular region and time, calculated based on the mortality
2. Infant Mortality Rate
Infant mortality refers to the infant deaths occurring before 1 year of age. The infant mortality rate is calculated using the following formula:
Jumlah bayi yang meninggal di suatu wilayah tertentu selama setahun
Jumlah kelahiran hidup di walayah yang sama dan pada kurun waktu
yang sama
x 1000
3. Infant Basic Immunization Coverage Infant Basic Immunization Coverage refers to the total infants who have received mandatory immunization expressed in percentages. The coverage rate can be larger than 100% because it is possible for infants to live in regions along the borders. 4. Gross Participation Rate (GPR)
Elemen-tary School
The GPR Elementary School refers to the comparison between the total number of elementary school students with the residents under the appropriate school age group, expressed in percentages. The result of the figure is used to discover the percentage of students that undergo an elementary school education.
5. Gross Participation Rate (GPR) Junior High School Students
The GPR for Junior High School refers to the comparison between the total number of junior high school students with the residents under the appropriate school age group which is expressed in percentages.
Number of elementary school students Amount of people age elementary school
(age group of 7 - 12 years)
identify how many students undergo a junior high school education.
The higher the GPR the larger the number of school aged children that go to school in a particular region.
6. Literacy Rate
The literacy rate refers to the total number of residents aged 10 years who are able to read and write alphabetical letters and is expressed in percentages. The rate is used to observe the portion of the residents that are able to read and write as a basis to undergo an education. The higher the literacy rates the better.
7. Average Length of School
The average length of school refers to the total average years that have been spent by the residents aged 15 years above to complete all formal education that he/she has participated in.
8. Proportion of Total Number of Poor Indicators of poverty in the study are approached using the proportion of total poor residents with earnings below $1 per day.
9. Pure Participation Rate (PPR) Ratio of Women to Men (SD-PT)
The indicator for gender equality is approached using the PPR ration or women to men in the aspects of basic education, secondary education and higher education,
measured using the PPR of girls towards boys. This indicator serves as one of the indicators in the MDG which in its third goal strives to encourage gender equality and women empowerment
10.Length of Province Roads
Indicator of land transportation in this study is approached with the length of the province roads that are sufficient for travel purposes (in sufficient conditions and fulfills the indicators of the Transportation Department).
11.Total Ship Visits to Port
Indicator of transportation from the sea is approached with the total ship visits from domestic and international ships that enter the port.
12.Airway Departure Traffic
The indicator for airway transportation is approached by the total departures of airplanes (domestic and international flights).
13.Electricity Distribution to Customers The indicator for electrical energy in this study is approached using the total number of electrical distribution which is channeled to customers in each province. 14.Clean Water Distribution to Customers
Another energy indicator in this study is approached using the total distribution of clean water channeled to the customers of each province. Clean water is defined as water which originates from taps, bottled water, well pumps, protected wells, and protected springs with a distance from the septic tank > 10 meters.
15.Gini Ratio (GR)
The gini coefficient is used to observe any relations between the total income received by the household or total individuals with the total amount of income. The GR serves as a measure or to represent income equality and its score ranges from 0 to 1.
Amount of people age 10 years and above Who can read and write Amount of people age
10 years and above
x 100% Amount of secondary school students Amount of people age secondary school
(age grop of 13 - 15 years)
Journal of Indonesian Economy and Business January
0,35 < G < 0,50 : mild equality/inequality G > 0,50 : low equality/high
inequality
16.GDRP per capita
GDRP per capita of a region is divided with the total number of residents in the mid-year of the region and expressed as an absolute in Rupiah per year.
17.Economic Growth
Economic growth is approached using the GDRP production approach growth rate above the constant price of 2000 in million Rupiahs. The GDRP growth resembles the growth rate from year to year calculated using the following formula:
%
18.Level of Open Unemployment
The level of open unemployment demon-strates the level of the labor force that are actively seeking a job and calculated based on the total number of job seekers divided by the total number of the labor force
Meanwhile, for Public Sector Efficiency (PSE) the following definitions are used: 1. Government expenditure for the health
sector that is expressed in percentages from the GDRP which is used as a proxy
upon opportunity cost to achieve service performance targets in the health and women empowerment sector (gender equality).
2. Government expenditure for the education sector that is expressed in percentages from the GDRP which is used as a proxy upon opportunity cost to achieve the performance service targets in the education sector.
3. Government expenditure for the infrastruc-tural sector expressed in percentages from the GDRP which is used as a proxy upon opportunity cost to achieve the perform-ance targets in transportation, clean water and energy provision services.
4. Total government expenditure in perform-ing the functions of distribution, stability, economic performance, and poverty alleviation expressed in percentages from GDRP as a proxy upon opportunity cost to achieve service performance targets to reduce the level of poverty as well as performing the functions of distribution, stability and economic performance.
Factors of non-discretionary inputs serve as representative indicators in reflecting mechanisms of community monitoring to-wards the public sector as well as explanations in influencing variations of performance outcomes and public sector efficiency. The factors are mentioned as follows:
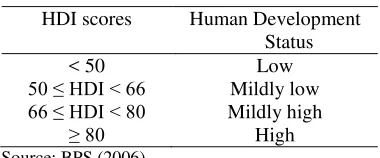
1. Human Development Index (HDI)
Table 1. HDI scores and Human Development Status
HDI scores Human Development Status
< 50 Low
50 ≤ HDI < 66 Mildly low
66 ≤ HDI < 80 Mildly high
≥ 80 High
Source: BPS (2006)
2. Level of Regional Fiscal Dependency This is the indicator used to measure the level of fiscal autonomy of a region, the higher the fiscal dependency of a region the lower the fiscal autonomy of a region. The degree of fiscal autonomy is related
with a region’s ability to manage the
resources they own.
The concept of fiscal decentralization in Indonesia, where the region is given the freedom to spend their income and increase their autonomy in funding their expenses, is usually actualized in the form of regional capacity to explore the poten-tial resources possessed by a region. Therefore the degree of the decentraliza-tion that is used is the Balanced Funds ratio and PAD ratio towards total regional income.
3. Level of Capital Availability
The variable GDRP per capita is used as a proxy to measure the availability of capital in a particular region, the higher the GDRP per capita therefore the higher the capital availability in a region. Therefore with large capital availability, the Regional government will be able to produce larger output (public services).
RESULTS AND DISCUSSION
Public Sector Performance (PSP) Index
Public sector performance indicators for each province based on the PSP index in 2001 and 2008 is presented in Table 2 and 3.
Table 2 indicates that the total PSP in 2001 in Indonesia ranges from 0,70 to 1,94 with an average of 1,07. It can be said that public sector performance in the initial phases of regional autonomy varies between regions although its variation is not large. The total PSP in 2001 demonstrates that 37% provinces in Indonesia that have public sector perform-ance scores that are equivalent or above the average performance, while the remaining 63% indicates public sector performance is below the average.
From the 30 provinces that are analyzed, in 2001, the province with the highest PSP total is DKI Jakarta. While the province with the lowest PSP total is Gorontalo. Based on the socio-economic sub indicators, the province with the highest sub-indicator for health is Bali. The province with the highest sub-indicator for education is DKI Jakarta. The province with the lowest sub indicator for poverty is Papua. The province with the highest sub indicator for gender equality is Aceh. The province with the highest sub indicator for transportation is Riau. The Province with the highest sub indicator for energy is East Java. Based on musgravian sub indicators, the province with the highest sub indicator distribution is North Maluku. The province with the highest sub indicator for stability is Riau. The province with the highest sub indicator for economic performance is West Nusa Tenggara.
Journal of Indonesian Economy and Business January 114
(
(
Journal of Indonesian Economy and Business January 116
Based on the socio-economic sub indicators in 2008, the province with the highest sub indicator for health and educations is DKI Jakarta. The province with the lowest sub indicator for poverty is Papua. The province with the highest sub indicator for gender equality is Aceh. The province with the highest sub indictor for transportation is Kepulauan Riau. The province with the highest sub indicator for energy is DKI Jakarta. Based on the musgravian indicator in 2008, the province with the highest sub indicator for distribution is Bangka Belitung. The province with the highest sub indicator for stability is Papua. The province with the highest sub indicator for economic perfor-mance is DKI Jakarta.
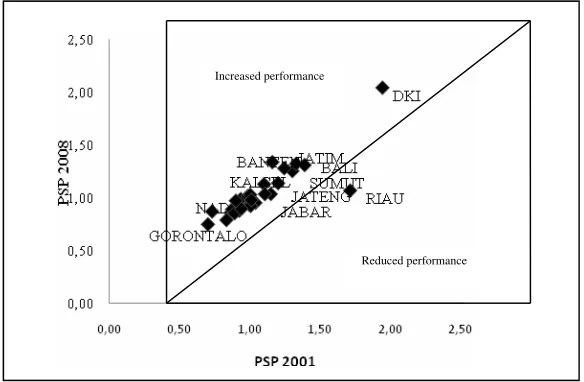
Understanding the changes (increase/ reduction) of public sector performance in Indonesia, based on the PSP index in 2001 and 2008, can be done by observing the scatter plot presented in the figure 3.
The figure above enables the identification of whether the total public performance in Indonesia experiences an increase or decrease in performance, by viewing whether the plot is above or below the diagonal line. The diagonal
line divides the space into two quadrants. The upper left quadrant is the plot that indicates the increased performance while the lower right quadrant for the plot indicates a reduction in performance.
Based on the comparison of total public performance (total PSP), it demonstrates that 15 provinces experienced an increase while 14 provinces experience a decrease, and 4 pro-vinces did not experience any change in performance. The provinces that had increased public sector performance include Aceh, Lampung, Bangka Belitung, Kepulauan Riau, DKI Jakarta, DI Yogyakarta, Banten, Central Kalimantan, South Kalimantan, East Kaliman-tan, Central Sulawesi, Gorontalo, West Sula-wesi, West Papua, and Papua. The province that experienced a decrease in public sector performance include North Sumatra, Riau, South Sumatra, Bengkulu, West Java, Central Java Tengah, Bali, West Nusa Tenggara, West Kalimantan, North Sulawesi, South Sulawesi, South East Sulawesi, Maluku, and North Maluku. While the provinces that did not experience any difference in public sector performance include West Sumatra, Jambi, East Java, and East Nusa Tenggara.
Source: Processed data, 2010
Reduced performance Increased performance
With regard to change in public sector performance in a particular province, it must be underlined that change of public sector performance (increase or reduction) is cal-culated relative towards the public sector performance of other provinces, and not calculated based on the public sector perfor-mance of a particular province on a particular year which is relative towards the preceding year.
Public Sector Efficiency (PSE) Index
Public sector efficiency indicators of each province in Indonesia, based on the PSE index in 2001 and 2008, can be observed in Table 4 and 5.
Table 4 indicates that the PSE total for 2001 in Indonesia ranges from 0,25 to 2,95 with an average of 1,19. Only 33% of the provinces in Indonesia have public sector performance scores equivalent or above the average performance, while the remaining 67 % indicates public sector performance scores that are below average.
In 2001, the province with the highest PSE total indicator is South Sumatra, while the province with the lowest PSP is Maluku. Based on the PSE sub indicators for socio-economic in 2001, the province with the highest sub indicator for health and gender equality is South Sumatra. The province with the highest sub indicator for education is Banten. The province with the lowest sub indicator for poverty is Maluku. The province with the highest sub indicator for transportation is East Java. The province with the highest sub indicator for energy is East Kalimantan. Based on the musgravian PSE sub indicators for 2001, the province with the highest sub indicator for distribution is Bangka Belitung. The province with the highest sub indicator for stability is Riau. The province
with the highest sub indicator for economic performance is East Kalimantan.
Table 5 indicates the PSE total for 2008 in Indonesia ranging from 0,24 to 4,02 with an average of 1,37 or higher compared to 2001. Only 36% of the Indonesian provinces had public sector performance scores equivalent or higher than the average performance, while the remaining 64% indicates that public sector performance is below average. In 2008, the province with the highest PSE total indicator is West Java. While the province with the lowest PSE score is Papua.
Based on the PSE sub indicator for socio-economics in 2008, the province with the highest sub indicator for health and gender equality is West Java. The province with the highest sub indicator for education is East Java. The province with lowest sub indicator for poverty is Papua. The province with the highest sub indicator for transportation and energy is Kepulauan Riau. Based on the musgravian PSE sub indicators in 2008, the province with the highest sub indicator for distribution and stability is West Java. The province with the highest sub indicator for economic performance is East Java.
Journal of Indonesian Economy and Business January 118
(
(
Journal of Indonesian Economy and Business January 120
East Kalimantan in 2001, was ranked highest among the other provinces in Kalimantan, however each year the trend indicates that it tends to reduce from year to year, and therefore resulting in West Kalimantan to elevate its ranks of its PSE index in the end of 2008. For the Sulawesi region, most of the provinces started from the PSE index level that is almost the same in 2001, however North Sulawesi was able to obtain the highest PSE among the other provinces with a trend to continue increasing in line with the period of fiscal decentra-lization. The province of West Papua is ranked with the highest PSE index compared to regions in East Indonesia although its trend indicates a reduction from year to year.
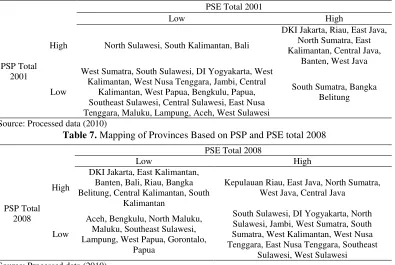
Mapping of Provinces Based on PSP and PSE Total
To understand relationships between PSP
total and PSE total in the province, it can be observed by the mapping of Indonesian provinces based on the PSP and PSE total. Whether a region is defined as either high or low is based on the average total of PSP and PSE scores, with scores below the average indicating a low score and vice versa.
Based on table 6 it can be observed that in 2001, 8 provinces had both high PSP and PSE scores, 3 provinces with high PSP and low PSE, and then 2 provinces with low PSP and high PSE, and finally 17 provinces with low PSP and PSE.
Based on table 7, it can be observed that in 2008, 5 provinces had both high PSP and PSE, 8 provinces had high PSP and low PSE, 11 provinces had low PSP and high PSE, and finally 9 provinces with both low PSP and PSE scores.
Table 6. Mapping of Provinces Based on PSP and PSE Total 2001
PSE Total 2001
Low High
PSP Total 2001
High North Sulawesi, South Kalimantan, Bali
DKI Jakarta, Riau, East Java, North Sumatra, East Kalimantan, Central Java,
Banten, West Java
Low
West Sumatra, South Sulawesi, DI Yogyakarta, West Kalimantan, West Nusa Tenggara, Jambi, Central
Kalimantan, West Papua, Bengkulu, Papua, Southeast Sulawesi, Central Sulawesi, East Nusa Tenggara, Maluku, Lampung, Aceh, West Sulawesi
South Sumatra, Bangka Belitung
Source: Processed data (2010)
Table 7. Mapping of Provinces Based on PSP and PSE total 2008
PSE Total 2008
Low High
PSP Total 2008
High
DKI Jakarta, East Kalimantan, Banten, Bali, Riau, Bangka Belitung, Central Kalimantan, South
Kalimantan
Kepulauan Riau, East Java, North Sumatra, West Java, Central Java
Low
Aceh, Bengkulu, North Maluku, Maluku, Southeast Sulawesi, Lampung, West Papua, Gorontalo,
Papua
South Sulawesi, DI Yogyakarta, North Sulawesi, Jambi, West Sumatra, South Sumatra, West Kalimantan, West Nusa Tenggara, East Nusa Tenggara, Southeast
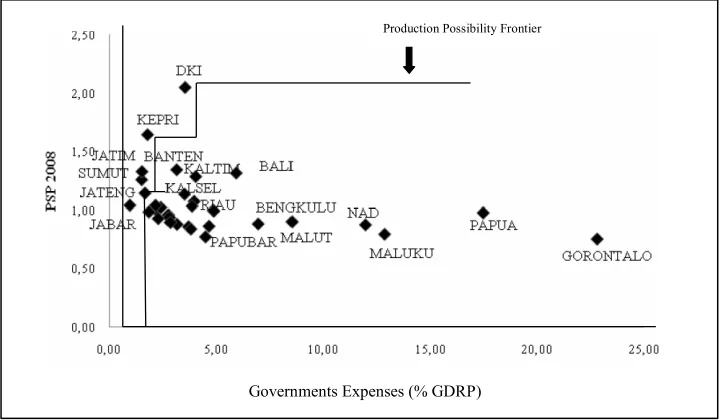
Public Sector Efficiency of Indonesian Provinces based on the FDH Method
The FDH technique is used to analyze efficiency of government spending. In this study PSP indicators are used as output and total government expenditure is used as input. Figure 4 and 5 displays the provinces that are relatively efficient compared to other provinces in 2001 and 2008. Provinces that are relatively efficient are located on the PPF, while those located on the lower right of the PPF curve are relatively inefficient when compared to the provinces located on PPF curve.
In this case Aceh, Lampung, Papua, Central Sulawesi, East Nusa Tenggara, South East Sulawesi, Gorontalo, Maluku (see Figure 4) are located at the lower right of the Bangka Belitung Province. This implies that these provinces are relatively inefficient compared to Bangka Belitung.
In figure 5, Banten is located in the lower right of the Kepulauan Riau province. This implies that Banten is relatively inefficient compared to Kepulauan Riau. Subsequently, East Kalimantan and Bali are relatively inefficient compared to East Java. Central Kalimantan, Riau, and Jambi are relatively inefficient compared to Central Java.
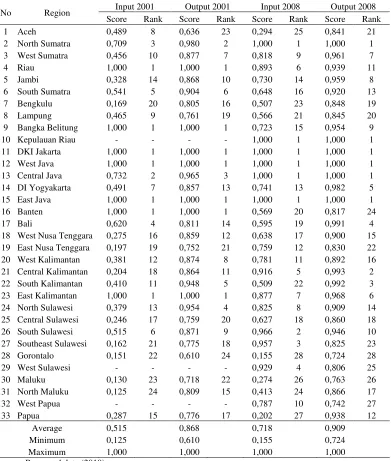
The next step is to calculate efficiency scores from the aspects of input and output. Based on these calculations, a ranking of efficiency for each province is obtained (see Table 8). Table 8 demonstrates that the average input efficiency score for the provinces in 2001 is 0,52. This implies that Indonesia should be able to produce an output level equivalent to 52% from the input which is used at the time or in other words there should be at least an excess of input usage of 48%. Meanwhile, the average output efficiency score for the Indonesian provinces in 2001 is 0,87. This implies that by using the total of specific government expenditures, the performance of provinces in Indonesia
produces an output as large as 87% or in other words the performance of provinces must be increased as much as 23% to be located on the PPF. Meanwhile average input efficiency scores of the Indonesian provinces in 2008 is 0,72 with average output efficiency scores of 0,91. This implies a considerably large increased input efficiency as large as 20% compared to 2001, and output also expe-rienced an increase as large as 4% compared to 2001.
Based on the FDH analysis above, it can be observed that provinces with a high proportion of government expenditure to GDRP has not guaranteed a high efficiency score, Therefore provinces with large government expenditure proportions are not always relatively efficient compared to other provinces with lower proportions of govern-ment expenditure.
Influence of Non Discretionary Input Factors towards Public Sector Efficiency
Based on the results of the data, the results of the Tobit estimation presents the individual significance tests towards the independent variables (non discretionary input factors) which demonstrate that the variable HDI, PAD ratio, GDRP, D2, D3, D5, and D6 influence the variable EF.
Journal of Indonesian Economy and Business January 122
Figure 4. Production Possibility Frontier (PPF) (2001)
Figure 5. Producton Possibility Frontier (PPF) (2008) GovernmentsExpenses(%GDRP)
Sourc e:Processeddata
(2010)
ProductionPossibilityFrontier
Table 8. Public Sector Efficiency 2001 and 2008
No Region Input 2001 Output 2001 Input 2008 Output 2008 Score Rank Score Rank Score Rank Score Rank 1 Aceh 0,489 8 0,636 23 0,294 25 0,841 21 2 North Sumatra 0,709 3 0,980 2 1,000 1 1,000 1 3 West Sumatra 0,456 10 0,877 7 0,818 9 0,961 7 4 Riau 1,000 1 1,000 1 0,893 6 0,939 11 5 Jambi 0,328 14 0,868 10 0,730 14 0,959 8 6 South Sumatra 0,541 5 0,904 6 0,648 16 0,920 13 7 Bengkulu 0,169 20 0,805 16 0,507 23 0,848 19 8 Lampung 0,465 9 0,761 19 0,566 21 0,845 20 9 Bangka Belitung 1,000 1 1,000 1 0,723 15 0,954 9 10 Kepulauan Riau - - - - 1,000 1 1,000 1 11 DKI Jakarta 1,000 1 1,000 1 1,000 1 1,000 1 12 West Java 1,000 1 1,000 1 1,000 1 1,000 1 13 Central Java 0,732 2 0,965 3 1,000 1 1,000 1 14 DI Yogyakarta 0,491 7 0,857 13 0,741 13 0,982 5 15 East Java 1,000 1 1,000 1 1,000 1 1,000 1 16 Banten 1,000 1 1,000 1 0,569 20 0,817 24 17 Bali 0,620 4 0,811 14 0,595 19 0,991 4 18 West Nusa Tenggara 0,275 16 0,859 12 0,638 17 0,900 15 19 East Nusa Tenggara 0,197 19 0,752 21 0,759 12 0,830 22 20 West Kalimantan 0,381 12 0,874 8 0,781 11 0,892 16 21 Central Kalimantan 0,204 18 0,864 11 0,916 5 0,993 2 22 South Kalimantan 0,410 11 0,948 5 0,509 22 0,992 3 23 East Kalimantan 1,000 1 1,000 1 0,877 7 0,968 6 24 North Sulawesi 0,379 13 0,954 4 0,825 8 0,909 14 25 Central Sulawesi 0,246 17 0,759 20 0,627 18 0,860 18 26 South Sulawesi 0,515 6 0,871 9 0,966 2 0,946 10 27 Southeast Sulawesi 0,162 21 0,775 18 0,957 3 0,825 23 28 Gorontalo 0,151 22 0,610 24 0,155 28 0,724 28 29 West Sulawesi - - - - 0,929 4 0,806 25 30 Maluku 0,130 23 0,718 22 0,274 26 0,763 26 31 North Maluku 0,125 24 0,809 15 0,413 24 0,866 17 32 West Papua - - - - 0,787 10 0,742 27 33 Papua 0,287 15 0,776 17 0,202 27 0,938 12
Average 0,515 0,868 0,718 0,909
Minimum 0,125 0,610 0,155 0,724
Maximum 1,000 1,000 1,000 1,000
Source: Processed data (2010) Description :
1. The input efficiency score and output efficiency score is calculated based on the equations (3.8) and (3.9) 2. The data used to calculate the efficiency score is the output PSP total and total expenditure of the regional
government (input) by taking into consideration the PPF in the figure
Journal of Indonesian Economy and Business January 124
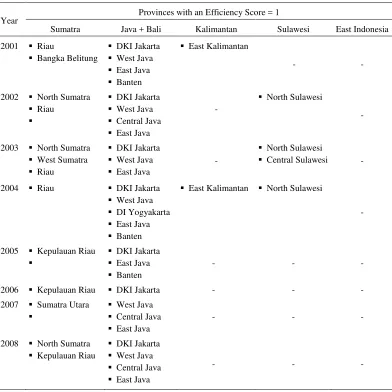
Table 9. Mapping of Provinces based on Efficiency Scores 2001-2008
Year Provinces with an Efficiency Score = 1
Sumatra Java + Bali Kalimantan Sulawesi East Indonesia
2001 Riau
Bangka Belitung
DKI Jakarta
West Java
East Java
Banten
East Kalimantan
- -
2002 North Sumatra
Riau
DKI Jakarta
West Java
Central Java
East Java
-
North Sulawesi
-
2003 North Sumatra
West Sumatra
Riau
DKI Jakarta
West Java
East Java
-
North Sulawesi
Central Sulawesi -
2004 Riau DKI Jakarta
West Java
DI Yogyakarta
East Java
Banten
East Kalimantan North Sulawesi
-
2005 Kepulauan Riau
DKI Jakarta
East Java
Banten
- - -
2006 Kepulauan Riau DKI Jakarta - - -
2007 Sumatra Utara
West Java
Central Java
East Java
- - -
2008 North Sumatra
Kepulauan Riau
DKI Jakarta
West Java
Central Java
East Java
- - -
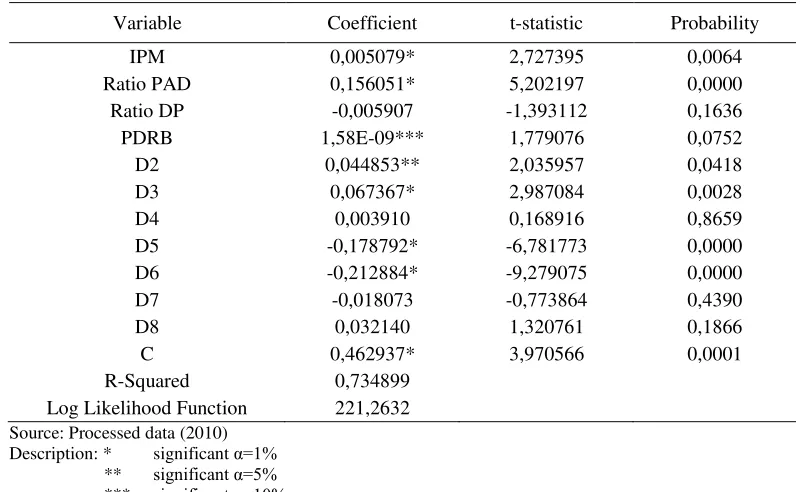
Table 10. Tobit Estimation Results
Variable Coefficient t-statistic Probability
IPM 0,005079* 2,727395 0,0064
Ratio PAD 0,156051* 5,202197 0,0000
Ratio DP -0,005907 -1,393112 0,1636
PDRB 1,58E-09*** 1,779076 0,0752
D2 0,044853** 2,035957 0,0418
D3 0,067367* 2,987084 0,0028
D4 0,003910 0,168916 0,8659
D5 -0,178792* -6,781773 0,0000
D6 -0,212884* -9,279075 0,0000
D7 -0,018073 -0,773864 0,4390
D8 0,032140 1,320761 0,1866
C 0,462937* 3,970566 0,0001
R-Squared 0,734899
Log Likelihood Function 221,2632 Source: Processed data (2010)
Description: * significant α=1% ** significant α=5% *** significant α=10%
The dummy variable 2003 indicates a coefficient of 0,067367, which implies that the average public sector efficiency in 2003 experienced an increased as large as 0,067 compared to 2001. The dummy variable 2005 has a coefficient of -0,178792, implying that the average efficiency in 2005 experienced a reduction as large as 0,179 compared to 2001. Finally, the dummy variable 2006 obtained a coefficient of -0,212884, implying that the average public sector efficiency in 2006 experienced a reduction as large as 0,213 compared to 2001.
The variable HDI indicated a positive influence towards public sector efficiency targets, implying that there is an increase of public sector performance and efficiency in Indonesia. As noticed earlier, indicators and measures of HDI consists of numerous indexes, namely health, education, purchase power. All these indicators are qualitative in nature and it could be said that the higher the IPM of a region, the higher the capacity of the
people in development. Therefore with large community capacity in development, the role and capacity of the community in development becomes larger and the attainment of develop-ment targets will be more easily actualized.
Journal of Indonesian Economy and Business January 126
CONCLUSIONS AND RECOMMENDATIONS
1. The average public sector performance in 2008 in 33 provinces experienced a reduction compared to 2001, with 30% of the provinces having performance levels equivalent to or above average, while the average public sector efficiency in 2008 experienced an increase compared to 2008, with 36% of the provinces having effi-ciency levels equivalent to or above average. This indicates that the implementation of fiscal decentralization in Indonesia has not given considerable impact towards increased public sector performance. The results of the analysis, overall, have not been consistent with the arguments proposed by fiscal federalism experts that suggest that the primary impacts of fiscal decentralization is improved public sector performance and efficiency.
2. By using the FDH method, it is found that it is not always the case that provinces with high government expenditure proportions produce higher public sector performance, in addition the Spearman Rho correlation coefficient is as large as -0,492 with a significance of 0,004. The same applies for the relationships between government expenditure proportion in producing a public sector efficiency score with a correlation as large as -0,885 and a significance level of 0,000.
3. The outcomes of public sector performance and efficiency is not only determined by quantitative measures for example GDRP, but are also determined by qualitative measures for example HDI, therefore human development factors also serve as one of the factors in achieving a better public sector performance and efficiency cannot be ignored.
A number of recommendations are proposed as follows:
1. The public sector performance has a lot of aspects that comprise several variables. Further studies should include additional indicators that are composited within the Public Sector Performance (PSP) in a model that increasingly clarifies an understanding related to public sector performance and efficiency.
2. A development strategy is needed by the provincial regional government to improve public sector performance and efficiency. This can be done by accelerating develop-ment targets that are qualitative not only using the outcomes of macroeconomic indicators.
REFERENCES
Alm, James., 2000, “Can Indonesia Decen-tralize? Plan, Problems, and Prospects”, Working Papers, Andrew Young School of Policy Studies. Georgia State University. Adam, A, Delis, M and Kammas P., 2008.
“Fiscal Decentralization and Public Sector Efficiency: Evidence of OECD Countries”. CESifo Working Paper 2364. Public Finance.
Afonso, A and St Aubyn, M., 2005, “Non Parametric Approaches to Education and Health: Expenditure Efficiency in OECD Countries”,Journal of Applied Economics 8, 227-246.
Afonso, A and St Aubyn, M., 2005, “Cross Country Efficiency of Secondary Education Provision: A Semi Parametric Analysis With Non-Discretionary Inputs”. Working Paper Series no.494. European Central Bank.
Afonso, A, L. Schuknecht, and Vito Tanzi, 2005, “Public Sector Efficiency an International Comparison”. Public Choice, Vol. 123 No.3/4, 321-347.
Akin, J, Hutchinson P, and Strumpf K., 2005,
Development Studies, Vol.41 No.8, 1417-1443.
Aubyn, St.M., 2002, “Evaluating Efficiency in the Portuguese Health and Education Sectors”, presented at the conference organized by Bank of Portugal, IMF Working Paper.
Bahl, Roy, 1999. Implementation Rules for Fiscal Decentralization. Washington: World Bank Institute.
BPS, UNDP, and Bappenas, 2006. Laporan
Pembangunan Manusia Indonesia
[Indonesian Human Development Report]. Jakarta.
Bardhan, P., 1997, “The Role of Governance in Economic Development, A Political Economy Approach”. OECD Develop-ment Center. Paris.
Bardhan, P., 2002, “Decentralization of Governance and Development”, The Journal of Economics Perspectives, Vol.16 No.4, 185-205.
Bird, Richard, 1999, “Intergovernmental Fiscal Relations in Latin America: Policy Design and Policy Outcomes”, Inter-American Development Bank, Washington DC.
Clements, B., 2002, “How Efficient is Edu-cation Spending in Europe?”, European Review of Economics and Finance, 1, 3-26.
Chu, Ke-young, S. Gupta, B. Clements and D. Hewitt, 1995. Unproductive Public Expenditures: A Pragmatic Approach to Policy Analysis, Fiscal Affairs Depart-ment. Washington DC: International Monetary Fund.
Dillinger. W., 1994, “Decentralization and Its Implication for Urban Service Policy”,
Urban Management Programme
Discussion Paper 16, Washington DC. Ebel, R and Yilmaz S., 2002, “On the
Measurement and Impact of Fiscal Decentralization”, Public Finance in
Developing and Transitional Countries: Essays in Honor of Richard Bird.
Enikolopov, R and Zhuravskaya, 2006,
“Decentralization and Political Institu-tions”. Journal of Public Economics 91. 2261-2290.
Fakin, B and de Crombrugghe A., 1997,
“Fiscal Adjustment in Transition Econo-mies: Social Transfers and the Efficiency of Public Spending A Comparison with OECD Countries”. Policy Research Working Paper 1803. World Bank. Gupta, S and Verhoeven M., 2001, “The
Efficiency of Government Expenditure Experiences from Africa”. Journal of Policy Modelling, 23, 433-467.
Hyman, David N., 2008. Public Finance: A Contemporary Application of Theory to Policy. Ohio: Southwestern.
Kuncoro, Mudrajad, 2004. Otonomi dan Pembangunan Daerah [Autonomy and Regional Development]. Jakarta: Erlangga.
Mello Luiz, de and Barenstein Martias, 2000,
“Fiscal Decentralization and Government: Cross Country Analysis in Asia”. Policy Research Working Paper. The World Bank.
Scully, G., 2000, “Government Expenditure and Quality of Life”, Public Choice, Vol 108 No.1/2., 123-145.
Stegarescu, D., 2005, “Public Sector decentralization: Measurement Concepts and Recent International Trends”, Fiscal Studies 26, 301-333.
Tanzi, Vito, 2000, “Some Politically Incorrect Remarks on Decentralization and Public
Finance,” in Dethier, Jean Jacques (ed.), Governance, Decentralization andReform in China, India and Russia. Boston: Kluwer Academic Publishers and ZEF. Tanzi, Vito, 2002, “Pitfalls on the Road to
Fiscal Decentralization,” in Ehtisham
Journal of Indonesian Economy and Business January 128
Fiscal Decentralization. London and New York: Routledge.
Todaro, Michael P., 2003. Economic Development 8edition. Essex: Pearson Education.
Van den Eeckhaut, P.Tulkens H, and Jamar M., 1993, “Cost Efficiency in Belgian Municipalities”. The Measurement of Productive Efficiency: techniques and application. New York: Oxford University Press.
Vasquez, Jorge Martinez and Robert M.Mc Nab, 2001, “Cross Country Evidence on The relationship Between Fiscal
Decentralization, Inflation, and Growth”. Proceedings of the Annual Conference on Taxation, 42-47.
Von Braun, J. And Ulrike Grote, 2002. “Does
Decentralization Serve the Poor?” in
Ehtisham Ahmad and Vito Tanzi (eds.), Managing Fiscal Decentralization. London and New York: Routledge. Zhang, Tao and Zou Heng-fu, 1996, “Fiscal
![Peta Kesehatan Indonesia Tahun 2005 - [BUKU]](data:image/gif;base64,R0lGODlhAQABAIAAAP///wAAACH5BAEAAAAALAAAAAABAAEAAAICRAEAOw==)