Corresponding author: [email protected]
The influence of acetylation status of
tuberculosis patients on the isoniazid serum
concentrations and sputum conversion
after intensive phase therapy
Dwi Indria Anggraini1*, Erna Kristin2, Iwan Dwiprahasto2
1Department of Pharmacology, Faculty of Medicine, Lampung University, Tanjung Karang, 2Department of Pharmacology and Therapy, Faculty of Medicine, Universitas Gadjah Mada, Yogyakarta, Indonesia
DOI: http://dx.doi.org/10.19106/JMedSci005001201802
ABSTRACT
Isoniazid (INH), one of the major antituberculosis drugs, is metabolized by acetylation.
Previously study proved the signiicant differences of serum INH concentration between subject with fast and slow acetylation status. However, the correlation of acetylation status with treatment outcome after ixed-dose combination antituberculosis therapy (FDC-ATT) was not explained. The aim of this study was to evaluate the inluence of
acetylation status on the treatment outcome and the serum INH concentrations in the
adult tuberculosis patients underwent FDC-ATT. A cross sectional study was carried out on 31 tuberculosis patients. Acetylation status was measured by spectrophotometer and serum INH concentration was measured by high performance liquid chromatography (HPLC). Sputum conversion assay was conducted by Ziehl Nelsen method. t-Test, chi square, Mann-Whitney, and Fisherman were used to analyze the data. The proportion of the fast acetylator was 61.3%, whereas the slow acetylator was 38.7%. The proportion of success and failure sputum conversion were 83.9% and 16.1%, respectively. The mean serum INH concentration in the fast acetylator groups (1.52 ± 0.15 µg/mL) was signiicantly lower than that in the slow acetylator groups (3.84 ± 0.35 µg/mL). The failure conversion risk of the fast acetylator group was about two folds higher than the slow acetylator group, although it was not signiicantly different (RR=2.53; 95% CI=0.32-20.00; p>0.05). Moreover, the mean serum INH concentration in success (2.46 ± 0.31 µg/mL) and failure (1.89 ± 0.20 µg/mL) sputum conversion was not signiicantly different (p>0.05). In conclusion, the acetylation status does not inluence the sputum conversion in adult tuberculosis patients after FDC-ATT although the serum INH concentration on slow acetylation status is higher than that fast acetylation status.
ABSTRAK
Isoniazid (INH) merupakan salah satu obat antituberkulosis utama yang metabolismenya melalui asetilasi. Pada penelitian sebelumnya dilaporkan ada perbedaan kadar INH serum pada orang dengan asetilator cepat dan lambat. Namun demikian hubungan antara status asetilasi dengan keberhasilan terapi penderita tuberkulosis (TB) yang mendapat obat
penelitian ini adalah untuk mengkaji pengaruh status asetilasi terhadap keberhasilan terapi
dan kadar INH serum penderita TB paru dewasa. Rancangan penelitian adalah potong
lintang dengan subyek penelitian sebanyak 31 orang penderita TB. Status asetilasi ditetapkan dengan spektrofotometer dan kadar INH serum dengan high performance
liquid chromatography (HPLC). Pemeriksaan sputum dilakukan dengan metode Ziehl Nelsen. Analisis statistik dengan uji t, Chi-square, Mann-Whitney, dan Fisherman. Proporsi status asetilasi cepat sebesar 61,3% sedangkan asetilator lambat 38,7%. Proporsi keberhasilan konversi sputum 83,9% dan gagal konversi 16,1%. Rerata kadar INH serum pada asetilator lambat (3,84+0,34 µg/mL) lebih tinggi secara nyata dibandingkan pada asetilator cepat (1,52+0,15 µg/mL) (p<0,05). Risiko gagal konversi pada kelompok asetilator cepat sekitar 2,53 kali dibandingkan pada asetilator lambat, meskipun tidak
bermakna secara nyata (RR=2,53; 95%CI=0,32-20,00; p>0,05). Rerata kadar INH serum pada kelompok berhasil konversi yaitu 2,46+0,31 µg/mL tidak berbeda nyata dengan kelompok gagal konversi yaitu 1,89+0,20 µg/mL (p>0,05). Dapat disimpulkan,
status asetilasi tidak mempengaruhi konversi sputum pada penderita TB dewasa yang mendapat OAT-KDT meskipun kadar serum INH pada status asetilasi lambat lebih tinggi
dari pada status asetilasi cepat.
Keywords: acetylation status – isoniazid level - success of therapy - conversion sputum
- intensive phase treatment - tuberculosis
INTRODUCTION
Tuberculosis (TB) is an infectious disease caused by Mycobacterium tuberculosis (M. tuberculosis). The spread of M. tuberculosis
occurs from person to person primarily through droplet transmission in air.1,2 Tuberculosis is a major health problem in the world, especially in developing countries. Approximately one third of the world’s population has been infected with M. tuberculosis with the main source of transmission from TB patients basil hold acid (BTA) positif.3
In 2007, World Health Organization (WHO) reported that approximately 9.27 million new cases of TB were reported. This incidence increased from the previous year of 9.24 million new cases in 2006 and 8.3 million new cases in 2000. Mortality due to TB is also reported to be very high. In 2007, 1.3 million deaths from TB or 20 deaths per 100,000 population were reported. Approximately 90% of the total deaths occur in developing countries. According to WHO, 22 countries
are classiied as high-burden countries for TB,
included Indonesia.4
Indonesia ranks third on the list of
high-burden tuberculosis countries in the world after India and China with the number of TB patients about 10% of the total number of TB patients in the world. In 2004 there were 539,000 new cases per year and 101,000 deaths occur people from TB in Indonesia. The prevalence rate of smear positive TB in the National was 110 per 100,000 population.3 The prevalence of TB in the Yogyakarta and Bali reported the lowest at 68 per 100,000 people. Pulmonary TB disease morbidity in Yogyakarta was 3.18 per 100,000 penduduk.5
Tuberculosis become more serious health problem with the increasing of Human
Immunodeiciency Virus (HIV)/Acquired Immunodeiciency Syndrome (AIDS) cases.6 Another issue that exacerbates tuberculosis is the emergence of multiple drug resistance TB
(MDR-TB), which can lead to cases of TB more dificult to treat.7 Resistance to antituberculosis
drugs . Inadequate therapy can be caused by
inappropriate management therapy.8 Since 1995 TB treatment has been carried out using
Directly Observed Treatment Shortcourse (DOTS) which is given in two stages, intensive
and continuation phases. At the end of the intensive phase and continuation phase, a patient sputum examination is conducted and
evaluated. Successful treatment is considered
if the patient sputum smear negatif in a microscopic examination is observed.3
Isoniazid (INH) is one of the main TB drugs which is generally given in the form of oral antituberculosis (OAT) drug in combination with others. Isoniazid has bacteriostatic and bactericidal activities. The metabolism of INH is affected by a drug metabolizing
enzymes in the liver that is N-acetyltransferase
2 (NAT2) through acetylation reaction. Based on the reaction of NAT2 acetylation by this person can be categorized as fast acetylators or lambat.9,10
Individuals with rapid acetylator phenotypes must take INH doses greater than those with slow acetylator phenotypes.11 Meanwhile another study proved that low serum INH concentrations was observed in individuals with rapid acetylator phenotypes.10 The mean blood INH concentration 2 hours after INH administration in individuals with slow acetylator phenotypes was two times higher than those with rapid acetylator phenotypes.12 Other studies also reported an association between INH acetylators status
with outcome of TB treatment with
once-weekly INH and rifapentine.13
NAT2 gene polymorphisms that determine the acetylator phenotypes of INH has been known to vary at different race or ethnicity. In the Indonesian population known to 65.4%
of people classiied as fast acetylators, and
35.6% are slow acetylators.14 This study was conducted to evaluate the inluence of
acetylator phenotypes of tuberculosis patients on the serum INH concentration and sputum conversion after intensive phase therapy.
MATERIALS AND METHODS
This was an observational study using cross sectional design involving 31 subjects who met the inclusion and exclusion criteria. The inclusion criteria were adult patients with pulmonary TB (aged over 18 years) smear positive TB new cases, received TB treatment
category 1 (2HRZE / 4H3R3), and willing
to participate in the study. The exclusion criteria were subjects with diabetes mellitus, suffer from liver dysfunction, had a history of allergy to sulfa drugs, could not communicate well, not willing to follow the course of TB
treatment with DOTS strategy. Protocol of
the study was approved by the Medical and
Health Research Ethics Committee, Faculty
of Medicine, Universitas Gadjah Mada, Yogyakarta.
Protocol of Study
Acetylation status determination
The acetylators phenotypes were determined using sulphadimidine according
to the method developed by Rao et al.15 Patients were given sulphadimidine 500 mg orally early in the morning on empty stomach. They were not allowed to take anything for the next two hours. Urine sample were collected before and 6 hours after sulphadimidine
administration. Free and total sulphadimidine
in the urine were determined by using
the acetylated sulphadimidine was >70% and as slow acetylator if it was <70%.
Measurement of serum INH concentration
Blood sample was taken before (day 0) and at the end of the intensive of treatment (day 56 of treatment). Three mL blood sample was taken from the median cubital vein two hours after OAT administration. The blood sample was then centrifuged at 3000 rpm,
serum was taken and stored at -80 oC until
analysed. Serum INH concentration was determined by using High Performance Liquid
Chromatography (HPLC) in the Integrated
Research and Testing Laboratory, Universitas
Gadjah Mada, Yogyakarta. A simple extraction was conducted by protein precipitation with 150 µL of trichloroacetic acid 15% in 300 µL serum. The mixture was then vortexed for two min and centrifuged at 3000 rpm for 10 min. The supernatant was collected and 20 µL was injected into the HPLC system. The stationary phase was Novapak® C18 column (150 x 3.9 mm, 3 microns). The mobile phase consisted of 0.05 M sodium dihydrogen phosphate and
acetonitrile (97: 3) and set at a low rate of 1 mL/min at room temperature. The detection
was performed at λ of 280 nm.
Sputum examination
Sputum was spread evenly over the
central area of the slide which was air dried
for about 30 min and heat ixed. The sputum slide was then looded with Ziehl Neelsen
(ZN) stain which was then heated to dry, kept for 5 min and washed with aquadest. The slide was then looded with 3 mL of concentrated
hydrochloric acid and 97 mL of ethanol 95%
to decolourise the ZN stain and washed with aquadest. Thereafter, the slide was looded
with 0.3 g of methylene blue and 100 mL of
aquadest for 2 min. The slide was air dried at
room temperature and viewed on a microscope under oil immersion for presence of acid-fast bacilli. The bacilli were stained red and the background material was stained blue.
Statistical analysis
Data were presented as mean ± standard
deviation (SD) or percentage and analyzed using SPSS software version 16. Numerical data were compared by using t-test or
Mann-Whitney U test, whereas categorical data
were compared by using Chi-square test or Fisher exact test. To determine the relative risk (RR) conversion failures in the rapid and
slow acetylators group, 2 x 2 table relative
risk analysis (Epi Info Program) at the 95% conidence interval was performed.
RESULTS
Among 34 subjects who met the inclusion criteria, only 31 patients completed the study. One subject can not be included until the end of the study period due to suffer from liver dysfunction as characterized by high levels of serum transaminases in early therapy and two subjects do not abide taking the drugs. The characteristics of subjects are presented
The proportion of subjects with fast acetylators phenotype status was 61.3%, and 38.7% was people with slow acetylators
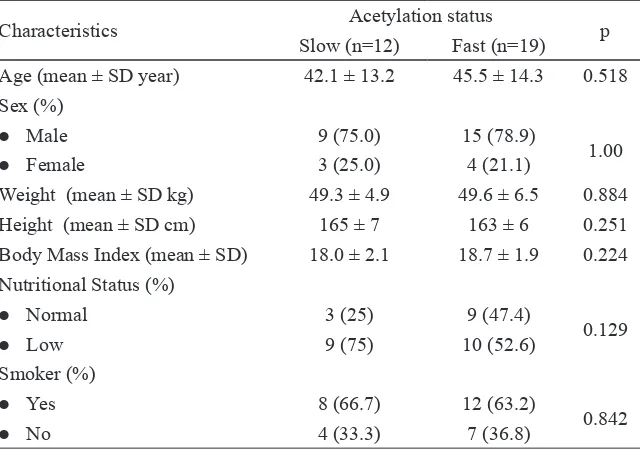
TABLE 2. Patient characteristics based acetylation status (n=31)
Characteristics Acetylation status p
Slow (n=12) Fast (n=19)
Age (mean ± SD year) 42.1 ± 13.2 45.5 ± 14.3 0.518
Sex (%)
l Male 9 (75.0) 15 (78.9)
1.00
l Female 3 (25.0) 4 (21.1)
Weight (mean ± SD kg) 49.3 ± 4.9 49.6 ± 6.5 0.884
Height (mean ± SD cm) 165 ± 7 163 ± 6 0.251
Body Mass Index (mean ± SD) 18.0 ± 2.1 18.7 ± 1.9 0.224
Nutritional Status (%)
l Normal 3 (25) 9 (47.4)
0.129
l Low 9 (75) 10 (52.6)
Smoker (%)
l Yes 8 (66.7) 12 (63.2)
0.842
l No 4 (33.3) 7 (36.8)
Characteristic Value
Age (mean ± SD year) 44.2 ± 13.7
Sex [n (%)]
l Male 24 (77.4)
l Female 7 (22.6)
Weight (mean ± SD kg) 49.5 ± 5.8
Height (mean ± SD cm) 164 ± 6
Body Mass Index (mean ± SD) 18.4 ± 2.0
Nutritional Status (%)
l Normal 13 (41.9)
l Low 18 (58.1)
Smoker [n (%)]
l Yes 20 (64.5)
l No 11 (35.5)
INH dose [n (%)]
225 (3 FDC-ATT) 24 (77.4)
300 (4 (FDC-ATT) 7 (22.6)
TABLE 1. Patients characteristic (n=31)
status. Characteristics of patients in the fast or slow acetylators did not show any statistically
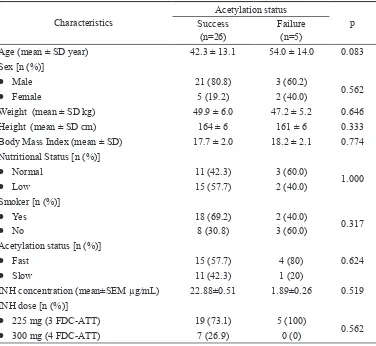
TABLE 3. Patient characteristics based on sputum conversion (n=31)
Characteristics
Acetylation status
p
Success
(n=26) Failure (n=5)
Age (mean ± SD year) 42.3 ± 13.1 54.0 ± 14.0 0.083
Sex [n (%)]
l Male 21 (80.8) 3 (60.2)
0.562
l Female 5 (19.2) 2 (40.0)
Weight (mean ± SD kg) 49.9 ± 6.0 47.2 ± 5.2 0.646
Height (mean ± SD cm) 164 ± 6 161 ± 6 0.333
Body Mass Index (mean ± SD) 17.7 ± 2.0 18.2 ± 2.1 0.774
Nutritional Status [n (%)]
l Normal 11 (42.3) 3 (60.0)
1.000
l Low 15 (57.7) 2 (40.0)
Smoker [n (%)]
l Yes 18 (69.2) 2 (40.0)
0.317
l No 8 (30.8) 3 (60.0)
Acetylation status [n (%)]
l Fast 15 (57.7) 4 (80) 0.624
l Slow 11 (42.3) 1 (20)
INH concentration (mean±SEM µg/mL) 22.88±0.51 1.89±0.26 0.519
INH dose [n (%)]
l 225 mg (3 FDC-ATT) 19 (73.1) 5 (100)
0.562
l 300 mg (4 FDC-ATT) 7 (26.9) 0 (0)
Zero in serum INH concentration was
observed before treatment begin. After complete treatment (day 56), the mean serum INH concentration was 2.72 µg/mL (ranged
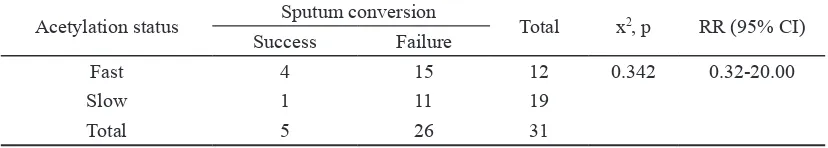
from 0.53 to 13.32 µg/mL). Most individuals who failed sputum conversions (80%) had a fast acetylators phenotype, whereas in the group succeeded only 57.7% sputum
conversion. But this was not statistically
signiicant (Fisher’s exact test, p> 0.05). Based on the analysis of the 2x2 table (Epi Info Program) obtained RR = 2.53 (95% CI:
0.32 to 20.00). Although the risk of conversion failure in fast acetylators group seen 2 times greater than the slow acetylators, but not
statistically signiicant (TABLE 4).
Most patients had successful sputum conversion (83.9%), whereas only 16.1% had failure sputum conversion. Characteristics of
patients based on the success and failure of
TABLE 4. Conversion failure risk based on acetylation status (n=31)
Acetylation status Sputum conversion Total x2, p RR (95% CI)
Success Failure
Fast 4 15 12 0.342 0.32-20.00
Slow 1 11 19
Total 5 26 31
The mean serum INH concentration in the slow acetylators patients (4.63 µg/mL) was much higher than fast acetylators (1.52 µg/ mL). But in the group of slow acetylators, one subject had extreme INH concentration until 13.32 µg/mL. After extreme data excluded,
the mean INH concentration of the slow acetylators (3.84 ± 0.34 µg/mL) was two times higher than that the rapid acetylators (1.52 ± 0.15 µg /mL) (p <0.05 ) as shown on TABLE 5.
TABLE 5. Serum INH concentration in the fast and slow acetylation status (n=30)
Acetylation status n Serum INH concentration (µg/mL)
Mean SEM 95% CI Min-Max p
Fast 19 1.52 0.15 1.20-1.83 0.53-2.54
0.000
Slow 11 3.84 0.34 3.07-4.61 2.29-5.01
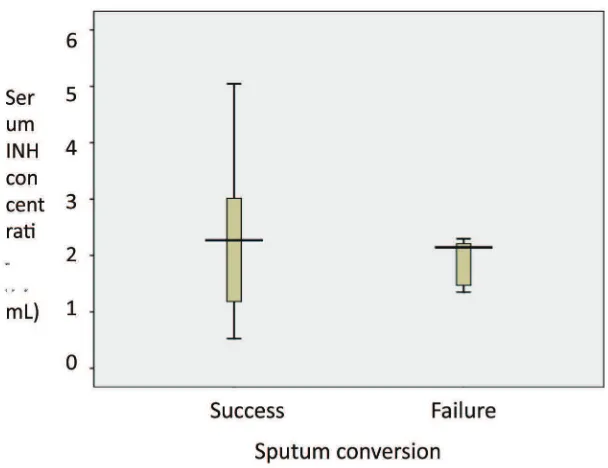
The mean INH concentration in the subjects with failed in sputum conversions (1.89 ± 0.20 µg/mL) was signiicantly lower
than the subjects with success in sputum conversions (2.88 ± 0.51 µg/mL) (p<0.05).
One subject with extreme INH concentration was found in the subjects with success in
sputum conversion. After subjects with extreme INH concentration excluded, the mean INH concentration between the subjects with success in sputum conversion (2.46 ± 0.31 µg/mL) was similar to those with failed
in sputum conversion (1.89 ± 0.20 µg/mL)
FIGURE 1. Serum INH concentration based on sputum conversion (n=30)
Most subjects (77.4%) received 3
FDC-ATT tablets (225 mg INH), and 22.6%
received 4 FDC-ATT tablets (300 mg). The
mean serum INH concentration in the group
receiving 225 mg or 3 tablets FDC-ATT was
no higher than those receiving 300 mg or 4
tablets FDC-ATT (2.55 ± 0.30 µg/mL vs. 1.63
± 0.31 µg/mL; Mann-Whitney test p > 0.05) (TABLE 6).
TABLE 6. Serum INH concentration based on INH dose (n=30)
Dose of INH n Mean SEM 95% CI Min-Max p
225 mg 24 2.55 0.30 1.92-3.18 0.59-5.05
0.147
300 mg 6 1.63 0.31 0.83-2.44 0.53-2.67
DISCUSSION
The proportion of rapid acetylation status (61.3%) was higher than that slow acetylation status (38.7%) in this study. This proportion was similar with the results reported in the previous study conducted in the Community
Health Care and Center for Pulmonary Disease
Treatment (BP4) in Yogyakarta which found 64% of patients were rapid acetylation status
and 36% of patients were slow acetylation status.16 Furthermore, it was estimated that
approximately 2/3 (66.67%) of the Indonesian people classiied as rapid acetylation status and 1/3 (33.33%) as slow acetylation status.14
mL in this study. Serum INH concentration on
TB patients after treatment has been reported in the previous studies. A therapeutic drug monitoring study on TB patients conducted
in Virginia, USA reported that the median
of serum INH concentration two hours after drugs administration was 1.9 µg/mL
(interquartile range 1.1-3.5 µg/mL).17 Another study conducted on TB patients in Turkey found the mean serum INH concentration two
hours after OAT treatment was 3.83 ±2.09 µg/
mL.18 Furthermore, study conducted on TB patients in Alberta, Canada found the mean serum INH concentration was 4.13 ± 3.9 µg/ mL.19
The success of TB treatment is proven by the sputum conversion from smear positive to smear negative at the end of the intensive phase of treatment. In this study TB treatment success rate achieved 83.9%, while the failure rate was 16.1%. The TB treatment success rate has been reported from various regions. The
Province Health Ofice in Yogyakarta Special Region reported that the TB treatment success
rate achieved 87%.20 A study conducted in UK demonstrated the TB treatment success rate was 87.%.21 However, in 2013 in America and
European regions the TB treatment success
rate was 75%, whereas in Malaysia was 67% less than the 85% success target set by the WHO. Globally, the TB treatment success rate for people newly diagnosed with TB was 86% in 2013.22, 23
The TB treatment failure on the rapid acetylator group (80% or 4 people) was higher compared to on the slow acetylation status
group (20% or 1 people). The RR of failure
in the sputum conversion of fast acetylation status group was two times higher than the slow acetylation status group although it was
not signiicantly different. This results is
different from the previous study that showed
a relationship between acetylation status and
outcome of TB treatment with once-weekly
INH and rifapentine.13 The different of dosage regimen and patient compliance may cause the different of these results.
The mean serum INH concentration of slow acetylation status group (3.84 ± 0.34 µg/ mL) was higher than that rapid acetylation status (1.52 ± 0.15 µg/mL). The higher serum INH concentration of slow acetylation status compared to that rapid acetylation status was
also reported in the previous studies. Schaaf et al.12 reported the serum INH concentration of slow acetylation status (8.6 µg/mL) was two-old higher than that rapid acetylation status (3.94 µg/mL). Furthermore, Conte et al.24 also reported the serum INH concentration of slow acetylation status (1.1 ± 0.8 µg/mL) was higher than that rapid acetylation status (0.5 ± 0.6 µg/mL).
The mean serum INH concentration in the patients with failed in sputum conversions (1.89 ± 0.20 µg/mL) was signiicantly lower
than the subjects with success in sputum conversions (2.46 ± 0.31 µg/mL). However, it was not signiicantly different (p>0.05). It
was reported that effective of tuberculostatic minimal concentration of INH range from 0.025 to 0.05 µg/mL, whereas the therapeutic INH concentration range from 0.5 to 2.0 µg/
mL.25-27 In this study, the mean serum INH
concentration in the both patients with iled
and success in sputum conversions met the therapeutic INH concentration that indicated
serum INH concentration did not inluence
CONCLUSIONS
Adult pulmonary TB patient with rapid acetylation status has lower serum INH concentrations than slow acetylation status. However, these serum INH concentrations are still within the therapeutic INH concentration therefore the acetylation status does not affect the sputum conversion after the intensive phase of TB treatment.
ACKNOWLEDGEMENTS
We would like to thank all subjects who participated in this study.
REFERENCES
1. Raviglione MC & O’Brien RJ. Tuberculosis. In: AS Fauci, DL Kasper, DL Longo, E Braunwald, SL Hauser, JL Lameson, J
Loscalzo, editors. Harrison’s Principles of
Internal Medicine. 17th edition. New York:
Mc.Graw Hill Companies Inc, 2008:
1006-20.
2. Lo Bue PA, Ademarco MF, Casatro KG.
The epidemiology, prevention, and control
of tuberculosis in the United States. In: AP Fishman, JA Elias, MA Grippi, RM Senior, and AI Pack, editors. Fishman’s Pulmonary Diseases and Disorders. Fourth edition. San Fransisco: Mc.Graw Hill Companies Inc, 2008: 2446-57.
3. Depkes RI. Pedoman nasional penanggulangan tuberkulosis. Edisi 2, cetakan pertama. Jakarta: Departemen Kesehatan RI, 2007.
4. World Health Organization. World Health Organization report 2009: Global tuberculosis
control epidemiology, strategy, inancing.
Geneva: World Health Organization, 2009.
5. Dinas Kesehatan Provinsi DI Yogyakarta. Proil kesehatan Propinsi DI Yogyakarta tahun 2008. Yogyakarta: Dinas Kesehatan Provinsi D I Yogyakarta, 2008.
6. Swaminathan S, Narendran G. HIV and tuberculosis in India. J Biosci2008; 33:527– 37.
http://dx.doi.org/10.1007/s12038-008-0071-2 7. Aditama, TY. XDR-TB. JTI 2006; 3(2):20-2. 8. Rintiswati N, Dwianingsih EK, Rahman
A, Iswanto, Rizal Y, Sumardi. Resistensi
Mycobacterium tuberculosis terhadap
beberapa obat anti tuberculosis pilihan utama dan pilihan kedua di Laboratorium
Mikrobiologi FK UGM tahun 2000-2004. BIK 2005; 37(4):190-7.
9. Kinzig-Schippers M, Tomalik-Scharte D, Jetter A, Scheidel B, Jakob V, Rodamer M, et al. Should we use N-Acetyltransferase type
2 genotyping to personalize isoniazid doses?
Antimicrob Agents Chemother 2005; 49: 1733-8.
http://dx.doi.org/10.1128/AAC.49.5.1733-1738.2005
10. Fukino K, Sasaki Y, Hirai S, Nakamura T, Hashimoto M, Yamagishi F, et al. Effects of N-acetyltransferase 2 (NAT2), CYP2E1 and Glutathione-S-transferase (GST) genotypes
on the serum concentrations of isoniazid and
metabolites in tuberculosis patients. J Toxicol
Sci2008; 33(2):187-95.
http://dx.doi.org/10.2131/jts.33.187
11. Ellard GA. Variations between individuals
and populations in the acetylation of isoniazid
and its signiicance for the treatment of
pulmonary tuberculosis. Clin Pharmacol Ther
1976;19: 610-25.
h t t p : / / d x . d o i . o r g / 1 0 . 1 0 0 2 /
cpt1976195part2610
12. Schaaf HS, Parkin DP, Seifart HI, Werely CJ, Hesseling PB, van Helden PD, et al. Isoniazid
pharmacokinetics in children treated for
respiratory tuberculosis. Arch Dis Child
2005; 90: 614–8.
http://dx.doi.org/10.1136/adc.2004.052175 13. Weiner M, Burman W, Vernon A, Benator D,
concentrations and outcome of tuberculosis
treatment with once-weekly isoniazid and rifapentine. Am J Respir Crit Care Med 2003; 167: 1341-7.
http://dx.doi.org/10.1164/rccm.200208-951OC
14. Yuliwulandari R, Sachrowardi Q, Nishida N, Takasu M, Batubara L, Susmiarsih TP, et
al. Polymorphisms of promoter and coding
regions of the arylamine N-acetyltransferase
2 (NAT2) gene in the Indonesian population:
proposal for a new nomenclature. J Hum
Genetics2008; 53:201–9.
http://dx.doi.org/10.1007/s10038-007-0237-z 15. Rao KVN, Mitchison DA, Nair NGK, Prema
K, Tripathy SP. Sulphadimidine acetylation test for classiication of patients as slow or rapid acetylators of isoniazid. Br Med J 1970;
3: 495497.
http://dx.doi.org/10.1136/bmj.3.5721.495 16. Santoso B, Sugiyanto, Asdie S, Effendi R.
Absence of relationship between
isoniazid-induced hepatic disturbances and acetylator
phenotype. BKM 1991; 7 (3): 169-78.
17. Heysell SK, Moore JL, Keller SJ, Houpt ER. Therapeutic Drug Monitoring for slow
response to tuberculosis treatment in a state
control program, Virginia, USA. Emerg Infect Dis 2010; 16(10): 1546-53.
http://dx.doi.org/10.3201/eid1610.100374 18. Kayhan S & Akgunes A. Therapeutic
monitoring of isoniazid, rifampicin, ethambutol and pyrazinamide serum levels in the treatment of active pulmonary tuberculosis and determinants of their serum
concentrations. African J Pharm Pharmacol 2011; 5(17): 2035-41.
Tuberc Lung Dis 2015; 19(2):2010-15.
http://dx.doi.org/10.5588/ijtld.14.0405
20. Dinas Kesehatan Provinsi DI Yogyakarta.
Proil kesehatan Provinsi DI Yogyakarta 2008. Yogyakarta: Dinas Kesehatan Provinsi DI Yogyakarta, 2008.
21. Ditah IC, Reacher M, Palmer C, Watson JM, Innes J, Kruijshaar ME, et al. Monitoring
tuberculosis treatment outcome: analysis of national surveillance data from a clinical
perspective. Thorax 2008; 63:440-6. http://dx.doi.org/10.1136/thx.2006.073916
22. World Health Organization. Global
tuberculosis report 2015. Geneva: World Health Organization, 2015.
23. Atif M, Sulaiman SAS, Shaie AA, Ali I, Asif M, Babar ZUD. Treatment outcome of
new smear positive pulmonary tuberculosis
patients in Penang, Malaysia. BMC Infect Dis 2014; 14:399.
http://dx.doi.org/10.1186/1471-2334-14-399 24. Conte JE, Golden, JA, McQuitty M, Kipps
J, Duncan S, McKenna E et al. Effects
of gender, AIDS, and acetylator status on
intrapulmonary concentrations of isoniazid.
Antimicrob Agents Chemother 2002; 46 (8):2358-64.
http://dx.doi.org/10.1128/AAC.46.8.2358-2364.2002
25. Petri WA. Chemotherapy of tuberculosis,
Mycobacterium avium complex disease,
and leprosy. In: L Brunton, J Lazo, and KL
Parker, eds. Goodman and Gilman’s the
Pharmacological Basic of Therapeutics. 11th
edition. New York: Mc.Graw Hill Companies
Inc, 2006; 1203-23.
26. Roy V, Tekur U, Chopra K. Pharmacokinetics of isoniazid in pulmonary tuberculosis-a
comparative study at two dose levels. Ind
Pediatrics 1996;33:287-92.
27. Tappero JW, Bradford WZ, Agerton TB, Hopewell P, Reingold AL, Lockman S, et al. Serum concentration of antimycobacterial
drugs in patients with pulmonary tuberculosis
in Botswana. Clin Inf Dis2005; 41: 461-9.