Volume 02 No. 01 July 2017 ISSN : 2502 – 5465 / e-ISSN: 2443 – 3859
Analisa
Journal of Social Science and ReligionAccredited by LIPI Number: 752/AU2/P2MI-LIPI/08/2016
Advisory Editorial
Koeswinarno
Religious Research and Development, Ministry of Religious Afairs, Semarang, Indonesia
Editor in Chief
Sulaiman
Religious Research and Development, Ministry of Religious Afairs, Semarang, Indonesia
International Editorial Boards
Florian Pohl, Emory University, United State of America Hary Harun Behr, Goethe Institute, Frankfurt University, Germany
Alberto Gomes, La Trobe University, Melbourne Australia Nico J.G. Kaptein, Leiden University, Leiden the Netherlands David Martin Jones, University of Queensland, Brisbane Australia
Patrick Jory, University of Queensland, Brisbane Australia Dwi Purwoko, The Indonesian Institute of Science, Jakarta Indonesia
Heddy Shri Ahimsa, Gajah Mada University, Yogyakarta Indonesia Masdar Hilmy, Sunan Ampel State Islamic University, Surabaya Indonesia
Iwan Junaidi, Semarang State University, Semarang Indonesia Bani Sudardi, Surakarta State University, Surakarta Indonesia Muslich Shabir, Walisongo State Islamic University, Semarang Indonesia
Sutrisno, Sunan Kalijaga State Islamic University, Yogyakarta Indonesia Zamroni, Yogyakarta State University, Yogyakarta Indonesia
Noorhaidi Hasan, Sunan Kalijaga State Islamic University, Yogyakarta Indonesia
Editors Zakiyah
Religious Research and Development, Ministry of Religious Afairs, Semarang, Indonesia
Siti Muawanah
Religious Research and Development, Ministry of Religious Afairs, Semarang, Indonesia
Munirul Ikhwan
Sunan Kalijaga Islamic State University, Yogyakarta, Indonesia
Tauseef Ahmad Parray
Government Degree College Pulwama (Higher Education Department), Jammu & Kashmir, India
Umi Muzayanah
Religious Research and Development, Ministry of Religious Afairs, Semarang, Indonesia
A.M Wibowo
Religious Research and Development, Ministry of Religious Afairs, Semarang, Indonesia
Umi Masiah
Religious Research and Development, Ministry of Religious Afairs, Semarang, Indonesia
Mustolehudin
Religious Research and Development, Ministry of Religious Afairs, Semarang, Indonesia
Language Advisor
Firdaus Wajdi
Jakarta State University, Jakarta, Indonesia Luthi Rahman
Walisongo State Islamic University, Semarang, Indonesia
Assistant to Editor
Nurlaili Noviani
Religious Research and Development, Ministry of Religious Afairs, Semarang, Indonesia
Muhammad Purbaya
Religious Research and Development, Ministry of Religious Afairs, Semarang, Indonesia
Mailing Address
Oice of Religious Research and Development, Ministry of Religious Afairs, Semarang, Indonesia Jl Untungsurapati Kav 70 Bambankerep Ngaliyan
The online version of Analisa Journal of Social Science and Religion can be accessed at http://blasemarang. kemenag.go.id/journal/index.php/analisa/index
The online version of Analisa Journal of Social Science and Religion has been indexes and displayed by the following services:
1. CrossRef
2. Directory of Open Access Journals (DOAJ) 3. Google Scholar
4. The Indonesian Publication Index (IPI) 5. Open Academic Journals Index (OAJI) 6. Indonesian Scientek Journal Database 7. Universia Biblioteca de recursos 8. Western Theological Seminary 9. Simon Fraser University 10. Advance Science Index (ASI) 11. Library Of Congress
12. Universitats Bibliothek Leipzig (UBL) 13. Bibliotega de La Universidad De Oviedo 14. Naver Academic
15. Elibrary mpipks 16. Universiteit Leiden
17. Ilmenau University Library 18. World Wide Science
19. Oice Of Academic Resources Chulalongkorn University 20. CORE
21. Hochschule Schmalkalden 22. British Library
23. Lincoln University 24. Tianjin University 25. University of Canterbury
26. Victoria University of Wellington
27. The University of Queensland library, Australia 28. Griith university library
29. La Trobe University Library 30. Curtin University library Australia 31. University of south Australia library 32. University of new England library
33. Australian Catholic University Library, Australia 34. Bond university Library, Australia
35. Charles Sturt University library australia 36. Flinders University library Australia 37. James cook university library australia 38. Macquarie University - Library Australia 39. Murdoch University library australia
40. SCU Library - SCU - Southern Cross University library 41. Library - Swinburne University of Technology, Australia 42. Library Torrens University, Australia
43. Library - University of Canberra
44. University of New South Wales - Library Australia
45. University Library - University Library at Notre Dame Australia 46. USQ Library - University of Southern Queensland
47. Library | University of the Sunshine Coast, Queensland, Australia 48. University Library - The University of Western Australia
51. Mediathek der Künste 52. VUB Library
53. University of Birmingham library, the United Kingdom 54. University of Bolton Library, the United Kingdom 55. Library - University of Bradford, the United Kingdom 56. Libraries - University of Brighton, the United Kingdom 57. Library University of Bristol, the United Kingdom 58. Cambridge University Library, the United Kingdom
59. Library, Cardif Metropolitan University, the United Kingdom 60. University of Arkansas Libraries, United State of America
61. University Library | California State University, Los Angeles, United State of America 62. University Libraries; University of Colorado Boulder, United State of America
63. Elihu Burritt Library Homepage - Central Connecticut State University, United State of America 64. University of Hawaii at Manoa Library, United State of America
65. University of Idaho Library, United State of America 66. The University of Iowa Libraries, United State of America 67. The University of Kansas Library, United State of America 68. Library | Kentucky State University, United State of America 69. University of Maine at Augusta Library; United State of America 70. SINTA: Science and Technology Index
71. SUNCAT 72. docplayer 73. Worldcat
iv
Analisa Journal of Social Science and Religion Volume 02 No.01 July 2017
Analisa Journal of Social Science and Religion Volume 02 No 01 July 2017
Analisa Journal of Social Science and Religion released a new edition vol.2.no.1.2017. This is the third edition published in English since its beginning in 2016. This volume released in the mid of various activities and the hectic schedule in the oice. However, this edition is published as scheduled. Many people have contributed in this edition so that publication process of the journal is managed smoothly. The month of June in which this journal on the process of publishing is a month when Muslim people around the world celebrated the Ied Fitr, therefore we would also congratulate to all Muslim fellows to have happy and blessing day on that occasion.
This volume consistently issues eight articles consisting some topics related to Analisa scopes as follows; religious education, religious life, and religious text. Those articles are written by authors from diferent countries including Indonesia, Australia, India, and Greece. Three articles concern on the education, one article focuses on the life of Hindu people. Furthermore, three articles discuss about text and heritage, and the last article explores on the evaluation of research management.
The volume is opened with an article written by Muhammad Ulil Absor and Iwu Utomo entitled “Pattern and Determinant of Successful School to Work Transition of Young People in Islamic Developing Countries: Evidence from Egypt, Jordan and Bangladesh.” This article talks about the efects of conservative culture to the success of school to work-transition for young generation in three diferent countries namely Egypt, Jordan and Bangladesh. This study found that female youth treated diferently comparing to the male youth during the school-work transition. This is due to the conservative culture that afect to such treatment. Male youth received positive treatment, on the other hand female youth gained negative transitions.
The second article is about how Japanese moral education can be a model for enhancing Indonesian education especially on improving character education in schools. This paper is written by Mahfud Junaidi and Fatah Syukur based on the ield study and library research. This study mentions that moral education in Japan aims to make young people adapt to the society and make them independent and competent in making decision on their own. This moral education has been applied in schools, family, community as well since these three places have interconnected each other.
The third article is written by Umi Muzayanah. It discussed about “The Role of the Islamic education subject and local tradition in strengthening nationalism of the border society. She explores more three materials of the Islamic education subject that can be used to reinforce nationalism namely tolerance, democracy, unity and harmony. Besides these three aspects, there is a local tradition called saprahan that plays on strengthening the nationalism of people living in the border area.
Zainal Abidin Eko and Kustini wrote an article concerning on the life of Balinese Hindu people settling in Cimahi West Java Indonesia. They lived in the society with Muslim as the majority. In this area, they have successfully adapted to the society and performed lexibility in practicing Hindu doctrine and Hindu rituals. This study is a result of their ield research and documentary research.
The next article is written by Tauseef Ahmad Parray. It examines four main books on the topic of democracy and democratization in the Muslim world especially in South and South East Asian countries namely Pakistan, Bangladesh, Malaysia and Indonesia. This paper discusses deeply
ii
Analisa Journal of Social Science and Religion Volume 02 No. 01 July 2017
on whether Islam is compatible with the democratization or not. He reviews literature written by Zoya Hasan (2007); Shiping Hua (2009); Mirjam Kunkler and Alfred Stepan (2013); and Esposito, Sonn and Voll (2016). To evaluate the data, he also uses various related books and journal articles. Thus this essay is rich in providing deep analysis.
Agus S Djamil and Mulyadi Kartenegara wrote an essay entitled “The philosophy of oceanic verses of the Qur’an and its relevance to Indonesian context”. This essay discusses the semantic and ontological aspects of 42 oceanic verses in the Qur’an. This study uses paralellistic approach in order to reveal such verses. Then the authors explore more on the implementation of such verses on the Indonesian context in which this country has large marine areas.
Lydia Kanelli Kyvelou Kokkaliari and Bani Sudardi wrote a paper called “The relection of transitional society of mytilene at the end of the archaic period (8th – 5th century b.c.) a study on Sappho’s “Ode to Anaktoria”. This paper is about an analysis of poet written by Sappho as a critical product from the Mytilene society of Greek.
The last article is written by Saimroh. She discusses the productivity of researchers at the
Oice of Research and Development and Training Ministry of Religious Afairs Republic Indonesia. The result of this study depicts that subjective well-being and research competence had direct positive efect on the research productivity. Meanwhile, knowledge sharing had direct negative impact on the research productivity but knowledge sharing had indirect positive efect through the research competence on the research productivity. Research competence contributes to the highest efect on the research productivity.
Analisa Journal of Social Science and Religion Volume 02 No. 01 July 2017
Analisa Journal of Social Science and Religion would like to thank you to all people that have supported this publication. Analisa sincerely thank to all international editorial boards for their support and their willingness to review articles for this volume. Analisa also expresses many thanks to language advisor, editors, assistant to editors as well as all parties involved in the process of this publication. Furthermore, Analisa would also like to thank you to all authors who have submitted their articles to Analisa, so that this volume is successfully published. Special thanks go out to Prof. Koeswinarno, the director of the Oice of Religious Research and Development Ministry of Religious Afairs, who has provided encouragement and paid attention to the team management of the journal so that the journal can be published right on schedule.
The Analisa Journal hopes that we would continue our cooperation for the next editions.
Semarang, July 2017 Editor in Chief
Analisa Journal of Social Science and Religion Volume 02 No. 01 July 2017
Introduction from the Editorial Boards :: i Acknowledgments :: iii
Table of Content :: v
PATTERN AND DETERMINANT OF SUCCESSFUL SCHOOL TO WORK TRANSITION OF YOUNG PEOPLE IN ISLAMIC DEVELOPING COUNTRIES: EVIDENCE FROM EGYPT, JORDAN AND BANGLADESH.
Muh.Ulil Absor and Iwu Utomo :: 1-21
MORAL EDUCATION IN JAPANESE SCHOOLS A MODEL FOR IMPROVING CHARACTER EDUCATION IN INDONESIA
Mahfud Junaedi and Fatah Syukur :: 23-40
THE ROLE OF THE ISLAMIC EDUCATION SUBJECT AND LOCAL TRADITION IN STRENGTHENING NATIONALISM OF THE BORDER SOCIETY (STUDY IN TEMAJUK VILLAGE SAMBAS REGENCY OF WEST BORNEO)
Umi Muzayanah :: 41-59
FLEXIBILITY OF HINDUISM IN A SOJOURNING LAND, STUDY ON DIASPORIC BALINESE HINDU IN CIMAHI, WEST JAVA PROVINCE OF INDONESIA
Zaenal Abidin Eko Putro and Kustini :: 61-77
DEMOCRACY AND DEMOCRATIZATION IN THE MUSLIM WORLD: AN EVALUATION OF SOME IMPORTANT WORKS ON DEMOCRATIZATION IN SOUTH/SOUTHEAST ASIA
Tauseef Ahmad Parray :: 79-101
THE PHILOSOPHY OF OCEANIC VERSES OF THE QUR’AN AND ITS RELEVANCE TO INDONESIAN CONTEXT
Agus S. Djamil and Mulyadhi Kartanegara :: 103-121
THE REFLECTION OF TRANSITIONAL SOCIETY OF MYTILENE AT THE END OF THE ARCHAIC PERIOD (8TH – 5TH CENTURY B.C.) A STUDY ON SAPPHO’S “ODE TO ANAKTORIA”
Lydia Kanelli Kyvelou Kokkaliari and Bani Sudardi :: 123-138
RESEARCH PRODUCTIVITY FACTORS IN THE GOVERNMENT INSTITUTIONS (STUDY IN THE OFFICE OF RESEARCH AND DEVELOPMENT AND TRAINING, MINISTRY OF RELIGIOUS AFFAIRS OF INDONESIA)
Saimroh :: 139-159
Author Guidelines :: 160
Volume 02 No. 01 July 2017 Pages 1- 160
ISSN : 2502 – 5465 / e-ISSN: 2443 – 3859
Analisa
Journal of Social Science and Religion139
INTRODUCTION
In the era of knowledge-based society, science and technology are recognized as the highest achievement in human culture. Currently, science and technology develop very rapidly. The demands of science and technology development need the support of research and development activities with high labor productivity. Research is a series of scientiic activities in the context of solving a problem (Azwar, 2009: 1). The research activities will always deal with the researchers. The term of researcher is actually intended for anyone
conducting research. But in particular, there are functional researchers given to civil servants (PNS) with the task, responsibility, authority and full rights to conduct the research and / or the development of science and technology in the organization of research and developmentin government institutions (Regulation of the Head of Indonesian Institute of Science No. 2, 2014).
The benchmark of researcher productivity bases on the Regulation of the Head of Indonesian Institute of Science (LIPI) No. 02, 2014 on Technical Guidelines for Functional Researcher is
Oice of Religious Research and Development Ministry of Religious Afairs Jakarta
Rawa Kuning Road Number 6, Pulogebang, Cakung, East Jakarta
13950 Telp.(021) 4800725
Fax.(021) 4800712 Email : [email protected]
Paper received: 31 March 2017 Paper revised: 16 April - 12 July 2017 Paper approved: 23 July 2017
RESEARCH PRODUCTIVITY FACTORS
IN THE GOVERNMENT INSTITUTIONS
(STUDY IN THE OFFICE OF RESEARCH AND DEVELOPMENT AND
TRAINING, MINISTRY OF RELIGIOUS AFFAIRS OF INDONESIA)
SAIMROH
Abstract
TheProductivity of Indonesian researchers is still considered low at the international
level. The researcher productivity is measured through the amount of scientiic papers published. This study aimed to prove some factors afecting the research productivity. Speciically, this study aimed to empirically examine the efect of
researcher characteristics, subjective well-being, knowledge sharing, and research
competence on research productivity.With stratiied proportional random sampling technique we obtained a sample of 100 researchers in Oice of Research and
Development and Training scattered in central and local units. Data were collected using questionnaires to measure research productivity, subjective well-being, knowledge sharing, and research competence. Data were analyzed descriptively
and inferentiallly. We used analysis of variance (ANOVA) and path analysis which were processed with SPSS 16 and LISREL 8.80 (Student) for the inferential analysis. The results of ANOVA concluded that the productivity did not difer signiicantly by gender. However there were signiicant diferences in the research productivity based on the academic qualiication and the functional job of researchers. The results of path
analysis concluded that subjective well-being and research competence had direct
positive efect on the research productivity, knowledge sharing had direct negative
impact on the research productivity but knowledge sharing had indirect positive
efect through the research competence on the research productivity. Research compentence contributes the highest efect on the research productivity. From this
study we recommend that the institution need to improve the research competence on quantitative research method with regard to statistical tools to collect, process, and analyze the research data.
Keywords: Research Productivity, Knowledge Sharing, Subjective well-being,
Ministry of Religious Afairs Analisa Journal of Social Science and Religion
Analisa Journal of Social Science and Religion Volume 02 No.01 July 2017
pages 139-159
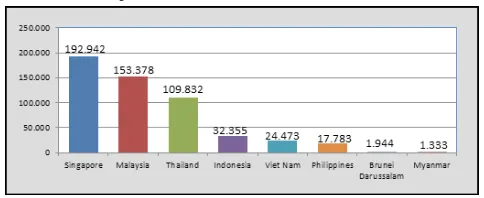
the number of credits; the value of each activities and/or the accumulated value of some activities that must be accomplished by researchers and can be used as one of the conditions for the appointment and the promotion. So, the researcher credits show the number of scientiic papers published in national and international level. The Indonesian researcher productivity is still considered low at the international level. This can be seen from fewer scientiic publications by Indonesian researchers at the international level than those by other countries. Scientiic publications in international journal are the researcher actualization in the development of science at the international level. Figure 1 shows the position of Indonesia and some Southeast Asian countries related to research productivity.
the research productivity has been done in some countries. The study conducted by Lertputtarak (2008) concluded that there were ive factors afecting the productivity of research at Noble University of Thailand, namely environment, institution, academic qualiication, social contingency, and demography. Social contingency was the factor that directly afect the ability of faculty to conduct research such as health, spouse, children, parents, inance, and pregnancy. Demographic factors include age, gender, and marital status. According to the indings of this investigation, demographic factors have only a slight afect on research productivity because the respondents said that the outcomes depend on the enthusiasm and willingness of lecturers rather than those based on age, gender or marital status. These indings are contradictory in many studies. Blackburn et al. (1991) stated that the relationship between gender and researcher productivity. Bailey (1992) and Vasil (1992) showed that men had higher levelsof research productivity than women (cited in Lertputtarak, 2008:2).
The factor of the existence of research center, research funding from outside, and library facilities afected the quantity and the quality of research articles in a research group of production and operation management in Business Schools in USA (Hadjinicola and Soteriou, 2006). Wichian, Wongwanich and Bowarnkitiwong (2009) conducted a study on the lecturers at the Faculty of Pedagogy, Thailand State University. The study was conducted by examining two structural models of research productivity using LISREL Analysis and Neural Network Analysis. The test of both structural models showed similar and consistent results. The researcher characteristics, researchership, research competence and institutional support towards research signiicantly afected research productivity.
Kendagor et al. (2012) conducted a study on the productivity of academic staf at the University of MOI Kenya. Data were analyzed using descriptive and inferential statistics with the analysis of variance, Pearson correlation,
Figure 1.
The amount of scientiic publications in interna -tional journal in some Southest Asian
Source: Scopus accessed from www.scimagor.com and processed on August 26, 2016
Scopus 2015 noted that Indonesia was ranked in 57 out of 239 with the number of paper publications as many as 32,355. The position of Indonesia was far lower than that of other Southeast Asian countries such as Singapore ranked in 32 with 192,942 publications, Malaysia ranked in 36 with 153,378 publications, and Thailand ranked in 43 with 109,832 publications (see Figure 1). The three countries with the most productive publication of scientiic works were the United States ranked in 1 with 8,626,193 publications of scientiic papers, China ranked in 2 with 3,617,355 publications, and England ranked in 3 with 2,397,817 publications (Scimagorjr, 2015).
141
Research Productivity Factors in The Government Institutions(Study in the Oice of Research and Development and Training, Ministry of Religious Afairs of Indonesia)
Saimroh
and regression. The test results proved that the accessibility of research funding, the amount of time allocated to research, the qualiication of researchers and the research environment could signiicantly inluence the research productivity of academic staf at the University of MOI Kenya. The study conducted by Bay and Clerigo (2013) concluded that self-assessment of the ability to write research and institutional support towards research were two important factors afecting the research productivity of lecturers at the Institute of Higher Education at the Asian Health Universities. The study by Kortlik et al. (2002) found that the research productivity at the Faculty of Agricultural Education in Colleges and Universities in USA was closely related to demographic characteristics, institutional support towards research and self-assessment of research competence.
According to the results of experiment conducted by Oswald, Proto, and Sgroi (2009), happiness could afect productivity. The experiment was conducted on the students of Warwick University, England. They were treated happily by watching a comedy ilm for 10 minutes and giving drinks and favourite food such as chocolate, fruit, and beverages. The results showed that the students given the happy treatment showed higher productivity than the students of the control group (no treatment). The study conducted by Elizabeth Kremp and Jacques Maresse (2003) on 2000 manufacturing companies in France with survey method and analyzed using correlation and regression analysis concluded that companies implementing the knowledge sharing culture has higher productivity. Saimroh’s research (2016) has shown that subjective well-being, knowledge sharing and research competency had signiicant impact on researcher’s productivity in Oice of Research and Development and Training, Ministry of Religious Afairs of Indonesia. However, the analysis did not explain the impact of researcher’s characteristic towards their productivity.
Based on those studies, it is known that many
factors afect the research productivity. These factors are the intrinsic and extrinsic ones. This study focused on the intrinsic characteristics of researchers such as gender, academic qualiications, and functional job, and the extrinsic factors such as subjective well-being, the activity of knowledge sharing and research competence. Welfare can be measured from the health, the economic situation, the happiness and the quality of life of people (Seals and Bruzy in Widyastuti, 2012: 2). Examining someone’s subjective welfare for his/her quality of life in terms of psychology is known as subjective well-being. The term “subjective well-being” is also often used as a synonym of happiness in the literature of Psychology. Someone is said to have high subjective well-being if he/she is satisied with the conditions of his/her life and often feels happy. According to the study conducted by Oswald, Proto, and Sgroi (2009), the happy person is assumed to have a high productivity.
Analisa Journal of Social Science and Religion Volume 02 No.01 July 2017
pages 139-159
and monographs. These activities of knowledge sharing can create the potential of creativity and innovation of researchers that are expected to improve research productivity.
To produce high quality of scientiic work, it must be supported by human resources, namely high competent researchers with reliable research capabilities, because the quality of scientiic work is related to the competence of the writer or the researcher. According to the Head of LIPI, Lukman on workshop in Cibinong, West Java (13/12/2012) Indonesia, said that investigators required to continuously improve the quality of scientiic publications, especially innational and even international scientiic journals and magazines. Furthermore,the Head of LIPI Pusbindiklat, Enny Sudarmonowati, said that many scientiic papers of Indonesian researchers were lackof the ability to analyze and conclude the research problem (Nationalgeographic, 2012).
Based on these descriptions, this study aimed to prove empirically whether the factors of subjective well-being, knowledge sharing, and research competence had signiicant efect on the research productivity in government agencies. In addition this study revealed whether there were diferences in research productivity based on the researcher characteristics such as gender, academic qualiications and functional job of researchers. Ministry of Religious Afairs as one of the government institutions that is responsible for increasing religious life, religious harmony and religious education, has a research and development institution whose function is to carry out research and development in the ield of religious education, religious life, and religious literature. The agency is named as Oice of Research and Development and Training which has seven units: four central working units that consist of the Center for Research Center and Development of Islamic guidance and religious services, the Center for Research Center and Development of Religion and Religious Education, the Center for Research and Development of Religious literature and Organizational Management, and Lajnah Pentashihan Qur’an
(the unit for Qur’an correction); and three regional working units consisting of Oice of Religious Research and Development Jakarta, Oice of Religious Research and Development Semarang, and Oice of Religious Research and Development Makasar.
The benchmark of success of Research and Development institutions is the number of scientiic publications. Oice of Research and Development and Training of the Ministry of Religious Afairs is required to improve the research productivity. The researchers of the Ministry of Religious Afairs may publish the research papers through scientiic journals and scientiic forums such as seminars and scientiic proceedings. For scientiic publications, Oice of Research Development and Training has several scientiic journals accredited nationally such as
Harmoni, Edukasi, Dialog, Lektur, Al-Qalam,
and Penamas. Futhermore, Oice of Researh
Center for Religion Semarang had a journal acredited internationally, namely “Analisa Journal of Social Science and Religion”, which is published two editions a year. In addition to scientiic journals, other kinds of publication are through scientiic forums such as seminars, proceedings and scientiic reports of research at national and international level. The Oice of Research and Development and Training has a research budget on 3-4 studies in a year. If you look at the frequency of the research conducted by the researchers, in a year the researchers can produce 3-4 scientiic papers published in scientiic journals or scientiic forums such as seminars or proceedings.
143
Research Productivity Factors in The Government Institutions(Study in the Oice of Research and Development and Training, Ministry of Religious Afairs of Indonesia)
Saimroh
input for making efective policies to improve the research productivity in the institutions.
CONCEPTUAL FRAMEWORK
Deinition and Measurement
of
Research Productivity
The deinitionsof research productivity havebeen raised by several experts, such as Turnage (1990), Print and Haittie (1997), and Creswell (1986) in Lertputtarak (2008: 19). According toTurnage (1990), research productivity measures the total output of research results. Print and Haittie (1997) deine the research productivity as the research totality conducted by academics in universities in a certain period. Creswell (1986) deines that productivity includes research publications in professional journals, conference proceedings, writing a book or part of a book, a set in the data analysis, dissertation, the acquisition of research grants, becoming an editorial board in a journal, the acquisition of patents and licenses, writing monographs, developing the experimental design, the results of artistic or creative works, engaging in public debate and comment.
The deinition and the measurement of productivity is also widely cited in Wichian etal. (2009: 69), as according to Williams (2003), Jitpitak (1989), Pipatrojkamon (1994), Pabhapote (1996), Changsrisang (2002), Saxet al. (2002) ,
Bloedel (2001) and Kotrlik (2002). According to Williams (2003), research productivity is about how many researchers generate research products. Jitpitak (1989), Pipatrojkamon (1994), Pabhapote (1996) and Changsrisang (2002) estimate the value of research productivity by calculating the ratio between research product and research period. Sax et al. (2002) calculate the productivity of research as the average number of research reports published in the last two years. Productivity measurement difers according to the type of publication and the status of researchers. Bloedel (2001) says that the measurement of research productivity has diferent weighted points by the type of publication. Publications in reputable journals gain greater weighted point
than those in other journals. Kotrlik et al. (2002, cited in Wichian etal., 2009: 69) recommend that weighted points to the research published by the status of a single author, co-author, and the third author ranging from 1.0; 0.5; and 0.33. Whereas the reference of LIPI gives diferent weighted points to each type of publication and the status of researchers. Greatest weighted pointis given to publications in international journals. In addition to the weighted points according to the status of a single author, the irst author, and the second author range from 1.0; 0.6; and 0.4 (Regulation of the Head of LIPI No. 2, 2014).
The deinition of productivity in research according to Sax et al (in Wichian etal., 2009: 69) is the average number of research reports published in the last two years. Whereas the weighted points in the measurement of research productivity refer to Regulation of the Chairman of LIPI No. 2, 2014; the weighted point of creditnumber as a benchmark of productivity depends on the type of publication and the status of researchers (LIPI, 2014: 9-13).
Factors
Afecting
the
Research
Productivity
The research productivity is inluenced by many factors as described above. The factors that became the focus of this study are subjective
well-being, knowledge sharing, and research
competence. This study also saw the factors
of researcher characteristics such as gender, academic qualiications, and functional positions of researchers that allegedly distinguished the research productivity.
Subjective Well-being
Subjective well-being is the individual subjective assessment to the quality of life. Diener, Oishi, and Lucas (2002: 63) deine subjective well-being as follows:
Analisa Journal of Social Science and Religion Volume 02 No.01 July 2017
pages 139-159
Ryan and Deci (2001: 141) describe the concept of subjective well-being as self-welfare involving subjective happiness. Someone is considered to have high subjective well-being if he/she is satisied with the conditions of his/her life, and often feels positive emotion other than negative emotion. The term of subjective well-being is often used as a synonym of happiness in the literature of Psychology. However, according to Diener (1984: 543) in his article, happiness is a part of the subjective well-being as well as life satisfaction and positive afect. In this study, the deinition of subjective well-being refers to the deinition of Diener, Oishi and Lucas (2002: 63); subjective well-being is an evaluation to a person’s cognitive and afective evaluations of his/her life.
Components of Subjective well-being
Subjective well-being consists of two interconnected components namely afective and cognitive evaluations (Diener, Oishi and Lucas (2002: 63). Cognitive evaluation is the evaluation of a person on his/her life; whether his/her life is going well.It includes relective cognitive evaluations, such as life satisfaction and work satisfaction, interest and engagement. Some literatures mention speciic evaluated domains in life satisfaction. In this study, we determined the 11 domains of life to be evaluated such as employment, income from employment, health, achievement, education, skills, wealth, the spiritual life, environmental conditions, social relationships with others, and hobby. While, an efective evaluation relects the person’s reaction to the events that happened in his/ her life. It includes positive and negative afect. The positive afect denotes pleasant moods and emotions, such as joy and afect. The negative afect includes moods and emotions that are unpleasant, and represent negative responses of people’s experience in reaction to their lives, health, events, and circumstances such as anger, sadness, anxiety and worry, stress, frustration, guilt and shame,and envy (Diener, Ed. 2005).
Knowledge Sharing
Probst, Raub, and Romhardt (in Nawawi, 2012: 19) deine knowledge as the overall cognition and skill used by humans to solve problems. Knowledge sharing is one of the methods used in knowledge management to provide opportunities for the members of an organization, institution or company to share knowledge, techniques, experience and ideas. Knowledge sharing can only be done if each member has vast opportunity to express opinions, ideas, criticisms, and comments to other members. Knowledge sharing becomes increasingly important to promote the ability of employees to be able to think logically so that they are able to produce an innovation (Setiarso, 2015).
Hof and Weenen (2004: 14) deine knowledge sharing as a process in which individuals exchange their knowledge. Knowledge sharing consists of
donating knowledge and collecting knowledge.
Lin (2007: 315) deines knowledge sharing as a social and cultural interaction involving the exchange of knowledge, experience, and skills of employees in the department or the organization. Red (in Lin, 2007) says that knowledge sharing can create opportunities to maximize the organization’s ability to meet the needs and to generate solutions, and the eiciency to create a competitive advantage. Clark and Brennan (in He, 2009: 2) asserts that the knowledge sharing refers to the exchange of knowledge, beliefs, and assumptions. Isfahani et al. (2013:140-141)
state that knowledge sharing is an exchange of knowledge and information done voluntarily and intentionally in an organization. Knowledge sharing in the organization can be efective if backed by the trust factor, organizational culture, incentives and motivation. The concept of knowledge sharing in this study refers to the deinition from Lin; knowledge sharing is a process of exchange of knowledge, experience and skills of employees in the department or the organization.
Dimensions of Knowledge Sharing
145
Research Productivity Factors in The Government Institutions(Study in the Oice of Research and Development and Training, Ministry of Religious Afairs of Indonesia)
Saimroh
an organization is backed by three dimensions; individual or personal quality, organizational, and technological dimension. The study on the efect of knowledge sharing activities on personal, organizational, and technological factors was conducted by Lee and Choi (2003), Connelly and Kelloway (2003), Taylor and Wright (2004), and Bock et al. (2005). Based on those studies, we established the indicators of each dimension. The personal dimension covers intrinsic motivation: enjoyment in helping others,
self-eicacy, knowledge, and interpersonal trust. The organizational dimension includes the top management support and the reward system. The technological dimension is closely related to the use of technology and information for communication and knowledge sharing.
Research Competence
Spencer (1993) delineates competency as an underlying characteristic of a person related to the efectiveness of the performance at work. Competence lies in the inner man and will forever exist in a person’s personality which can predict the behavior and the performance broadly in all situations and job task (Moeheriono: 2012, 5). Mulyasa (2008:38-39) cited some deinition of competency according to Mc Ashan (1981:45), Finch and Crunkilton (1979), and Gordon (1988). Mc Ashan (1981) describes competence as knowledge, skills, and abilities or capabilities that person achieves, which turns to be part of his or her being to the extent he or she can satisfactorily performs particular cognitive, afective, and psychomotor behaviors. Finch and Crunkilton (1979:222) deine competency as a self mastery of certain task, skills, attitude, and appreciation needed to ensure success. Gordon (1988:109) explains that competency consists of some aspects including knowledge, understanding skills, value, attitude and interest. McClelland (1970) outline scompetency as the basic characteristics of person that determines success or failure of a person in doing a job or in certain situations (Moeheriono, 2012, 6). From such deinition, it can be assumed that competency is knowledge, skills and ability
possessed by a person to work efectively.
Research is a series of scientiic activities in the context of solving a problem (Azwar, 2009: 1). According to Kerlinger (1986), research is a process of discovery that has systematic, controlled and empirical characteristics, and is based on theories and hypotheses (Sukardi, 2003: 4). Mallari and Santiago (2013:52) deine research as a process involving the conceptualization of research, the operations or the study design, the data collection, the processing and analysis of data, and the application of the results of the research. According to the meaning of both competency and research, research competency is researchers knowledge, skills, and ability on research techniques to conduct an efective research.
Dimensions of Research Competence
The dimensions of research competence refers to the deinition from Mallari and Santiago (2003:52) because of more operational. Research is a systematic process started from the conceptualization of research, the operations or the study design, the data collection, the processing and analysis of data, and the application of research results. In this study, the measurement of research competence is conducted through self-assessment of the researchers towards their competences. Self-assessment is an assessment to themselves to know the weaknesses and strengths of researchers. Its results can be used as recommendation for a leader of an organization to improve performance in the future (Depdiknas, 2003: 181). The self-assessment contributes to the belief in self-success through the perception of researcher ability towards the competence required in research tasks (Depdiknas, 2003: 194).
RESEARCH METHOD
Population and Sample
Analisa Journal of Social Science and Religion Volume 02 No.01 July 2017
pages 139-159
and local units located in Jakarta, Semarang and Makassar. The total number of researchers is 156 consisting of 17 researchers of the Center for Research and Development of Islamic guidance and religious services, 22 researchers of the Center for Research and Development of Religion and Religious Education, 17 researchers of the center for Religious literature and Organizational Management, 7 researchers of center for Lajnah Pentashihan Qur’an, 28 researchers of the Oice of Religious Research and Development Jakarta, 35 researchers of the Oice of Religious Research and Development Semarang, and 30 researchers of the Oice of Religious Research and Development Makasar (Secretariat of Research and Development and Training Agency, 2015). Distribution researcher by position rank are 42 irst researcher
(peneliti pertama), 44 junior researchers (peneliti
muda), 47 associate researchers (peneliti madya),
and 23 principal researchers (peneliti utama).
The instrument has been tested on researchers in the Center for Research and Development of Islamic guidance and religious services, and the center for Religious literature and Organizational Management. Therefore, the research population expands to 122 researchers. Sample is taken using stratiied proportional random sampling with stratiication in oice unit. According to Krejcie and Morgan in Soian Efendi (2012:175), a population of (N) 122 should have a minimum of 94 sample . Therefore, the research uses 100 sample consisting of 18 researcher of the Center for Research and Development of Religion and Religious Education, 7 researcher of center for
Lajnah Pentashihan Qur’an, 24 researcher of the Oice of Religious Research and Development Jakarta, 30 researcher of the Oice of Religious Research and Development Semarang, and 21 researche of the Oice of Religious Research and Development Makasar.
Instrument
The technique of data collection was the instruments consisting of four questionnaires: questionnaires for research productivity, subjective well-being, knowledge sharing, and research
competence.The questionnaire for research productivity was asking how many scientiic publications were produced by researchers in 2014 – 2015. The questionnaire for subjective well-being consists of two components, namely the cognitive and afective components. The cognitive component measuring the global satisfaction was adopted from Satisfaction With Life Scale (SWLS) developed by Diener et al. (In Pavot & Diener, 1993). Global life satisfaction is measured using Likert scoring method, with scoring range from 1 (strongly disagree) to 7 (strongly agree). While cognitive satisfaction under 11 life domain based on job situation, income, health, achievement, education, skills, wealth, spiritual life, environmental conditions of residence, social relations with others, and hobby, is also measured using likert scoring from 1 (very dissatisfaied) to 7 (very satisied). The questionnaire of subjective well-being for afective component was adopted form the scale of Positive Afect Negative Afect Schedule (PANAS) developed by Watson et al (1988).This scale consists of a number of words that describe diferent feelings and emotions using Likert scoring method, with scoring range from 1 (very slightly or not al all) to 5 (extremely ).
147
Research Productivity Factors in The Government Institutions(Study in the Oice of Research and Development and Training, Ministry of Religious Afairs of Indonesia)
Saimroh
that 3 items from a total of 64 items were not valid. The tes of reliability resulted Alpha Cronbach coeicient of the questionnaire for subjective well-being on the scale of cognitive as much as 0,795 and 0,906. Whereas the coeicient on the scale of afective was 0,800. Alpha Cronbach coeicient for the scale of knowledge sharing and research competence were respectively 0.930 and 0.970.
Data Analysis Techniques
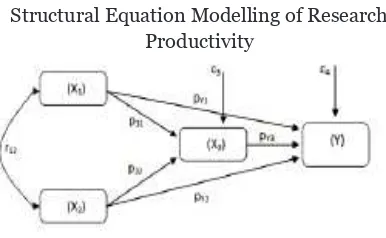
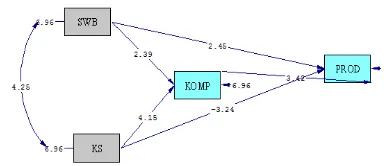
The data were analyzed by descriptive statistics and inferential analysis. For descriptive analysis we used some statistical values including the Sum, average, percentage, and descriptive statistical charts. For inferential analysis we used analysis of variance to determine the signiicance of the diference in the average of research productivity and path analysis to test the structural model of research productivity towards subjective well-being, knowledge sharing, and research competence. The structural model of productivity required direct and indirect correlations (see Figure 2). The variable of subjective well-being (X1), knowledge sharing (X2) became exogenous variable, research competence (X3) became intervening variable, and research productivity (Y) became endogenous variable.
Figure 2 showed that the subjective well-being (X1) afected directly and indirectly through the research competence (X3) on the research productivity (Y). The knowledge sharing could afect directly and indirectly through the research competence (X3) on the research productivity (Y). The research competence (X3) afected directly on the research productivity (Y). The data were processed using SPSS 16 and Lisrel 8.80 (student).
Path analysis requires several assumptions
Figure 2
Structural Equation Modelling of Research Productivity
that must be met: (1) An error estimated data should be normally distributed, (2) the absence of multicolinierity between independent variables, and (3) the linearity of correlation between variables. For the test of data normality we used Lilliefors test. The assumption test of multicolinierity by Colinierity Statistics resulted the value of Varian Inlacion Factor (VIF) and tolerance. The linearity test of the correlation between variables was carried out by inding the regression line of independent variable (X) on the dependent variable (Y).
RESULTS AND DISCUSSION
Respondents
The respondents were 100 respondents consisting of 75% male and 25% female. Based on the age, the majority of respondents (40%) were aged 30-40 years, and respondents aged 41-50 years were 26%, respondents over the age of 50 years were 26% of respondents, and only 2% of respondents were aged less than 30 year. Statistics Indonesia classiied productive age group into two categories, very productive age from 15 to 49 years old and productive age from 50 to 64 years old. Data shows that 74% employee of Oice of Research and Development are in the very productive age group. This should become an opportunity for the institution to boost research productivity growth by publishing more scientiic paper with quality. According to educational qualiications, the majority of respondents (62%) were graduated S2, S1 graduates were 29%, and 9% were graduated S3. Meanwhile, according to the functional position of researchers, there were 22% of the irst researchers (peneliti pertama), 39% of young researchers (peneliti muda), 31%
Analisa Journal of Social Science and Religion Volume 02 No.01 July 2017
pages 139-159
The Description of Research
Variables
Research Productivity
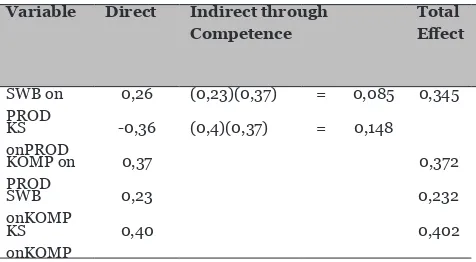
Research productivity was measured based on the number of scientiic papers published during the period 2014 - 2015. Scores of productivity were calculated by the number of scientiic papers produced which was multiplied with the weighted points of credits. The reference of weighted points was the Regulation of the Head of LIPI No. 2, 2014 concerning the technical manual of functional researchers. Each type of paper had diferent weighted points. The highest weighted points were given to scientiic papers published in books by international publishers and scientiic papers published in international scientiic magazine with the weighted point of 40. Then scientiic papers published in book by national publishers had the weighted point of 30, and scientiic papers published in scientiic journals which was nationally accredited had the weighted point of 25. Whereas the the lowest weighted point of credits for scientiic papers in the form of a paper or short communication of research results or the results of scientiic thought published in scientiic journals that were not accredited was 1. Futhermore,the weighted points of credits according to the author’s status by a single author, the irst author and writer helpers were diferent. The weighted points of credits for a single author, the irst author, and the second author ranged from 1; 0.6, and 0.4.
The lowest scores of productivity during the last 2 years were at 1.2 or 0.6 annually. The highest scores of productivity obtained by researchers were 272 or 136 anually. Generally 100 researchers each year could produce several published scientiic papers with 49.39 weighted points. The score distribution of research productivity showed that 21% of respondents had the average score of productivity, 38% of respondents were under the average score of productivity, and 41% of respondents were above the average score of productivity.
Subjective Well-being
Life Satisfaction (global satisfaction)
Life satisfaction scores were obtained from the score of Satisfaction with Life Scale(SWLS). By classifying life satisfaction into seven categories from very dissatisied to very satisied, the results of life satisfaction of respondents indicated that the majority of respondents (40%) felt quite satisied, 29% of them felt satisied, 13% of them felt a little dissatisied, 11% of them felt somewhat satisied, 3% of them felt very satisied, 2% of them felt dissatisied, and only 2% of them felt somewhat dissatisied.
Satisfaction on Certain Aspects
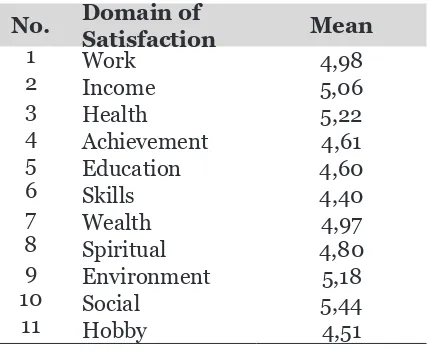
The scores of satisfaction on 11 aspects included the satisfaction on the work situation, income, health, achievement, education, skills, wealth, the spiritual life, environmental conditions of residence, social relationships with others, and hobby.Table 1 showed the satisfaction on 11 aspects of life. The highest satisfaction was on aspect of social relationships (score 5.44), health (score 5.22), the condition of the neighborhood (score 5.18), and income (5.06). Meanwhile, the lowest mean was on the aspect of skill (score 4.40).
Table 1. The Statistics of Satisfaction Scores on Certain Domain
No. Domain of
Satisfaction Mean
1 Work 4,98
2 Income 5,06
3 Health 5,22
4 Achievement 4,61
5 Education 4,60
6 Skills 4,40
7 Wealth 4,97
8 Spiritual 4,80
9 Environment 5,18
10 Social 5,44
11 Hobby 4,51
Source: analyzed data of questionnaire, 2016
Afective components
149
Research Productivity Factors in The Government Institutions(Study in the Oice of Research and Development and Training, Ministry of Religious Afairs of Indonesia)
Saimroh
respondents felt certain positive and negative afects during 1-2 weeks. Afective scale was adopted from Positive Afect Negative Afect
Schedule (PANAS).The interpretation of PANAS
scoreswas obtained by afect balance which was the result of a reduction of the mean of positive and negative afects. The positive values of afect
balance meant that the respondents often felt
more positive afect than negative afect, and on the contrary the negative valuesof afect balance showed that the respondents often felt more negative afect than positive afect. The results of the study revealed that most respondents (95%) often feltmore positive afect (e.g: Interested, Strong, Inspired and Attentive) than negative afect (e.g: Distressed, Scared, Hostile, Irritable, and Nervous), and only 5% of respondents often feltmore negative afective than positive afect.
The Scores of Subjective Well-being
The scores of Subjective well-being were obtained from the z-scoremean SWLS of respondents added withz-score mean of satisfaction on certain domains, and z-score
Afect Balance. The average scores of Subjective well-being was 0.0003. The score distribution of Subjective well-being showed that respondents with an average score were 35% of respondents, 41% under the average score, and 24% of respondents above average score.
Knowledge Sharing
The scores of knowledge sharing were obtained from knowledge sharing questionnaires that consisted of three dimensions of personal, organizational, and technological dimension. Personal dimension consisted of some indicators:
Enjoyment in helping others, Knowledge
self-eicacy, and interpersonal trust. Organizational dimensionconsisted of top management and
system reward. Technological dimension was an
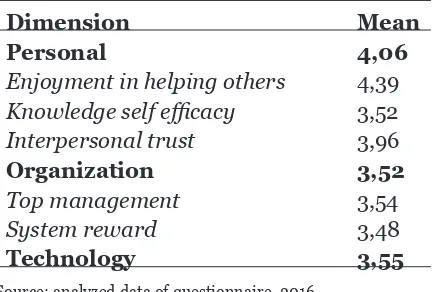
indicator showing the utilization of technology to share information and knowledge. The mean score on each dimension indicator can be seen in Table 2.
Table 2. The Mean Scores on Knowledge Sharing Di-mensions
Dimension Mean
Personal 4,06
Enjoyment in helping others 4,39
Knowledge self eicacy 3,52
Interpersonal trust 3,96
Organization 3,52
Top management 3,54
System reward 3,48
Technology 3,55
Source: analyzed data of questionnaire, 2016
Table 2 showed that the highest mean score was obtained in the dimension of the personal dimension (4.06), the technological dimension (3.55), and then the lowest mean score on the organizational dimensions (3.52). This indicated that a person conducting the activity of knowledge sharing felt enjoy or pleasure in sharing (enjoyment in helping others) and had the
Analisa Journal of Social Science and Religion Volume 02 No.01 July 2017
pages 139-159
Research Competence
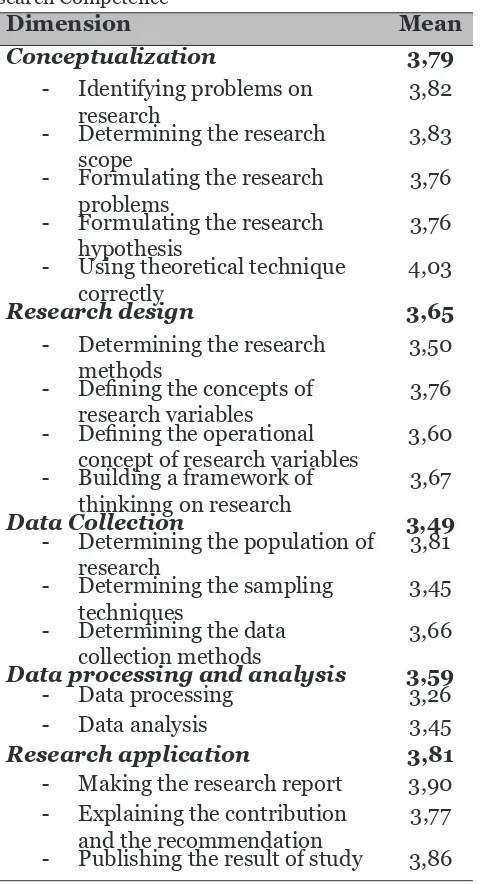
The competence scores were obtained from questionnaires of research competence conducted by self-assessment to identify weaknesses and strengths of researchers related to the conidence in their competence. Research competence was measured with ive dimensions of research techniques, namely the conceptualization of research, research design, data collection, data processing and analysis, and research applications. In each dimensions there were indicators that described the dimensions of research competence.
Tabel 3. The Mean Scores on the Dimensions of Re-search Competence
Dimension Mean
Conceptualization 3,79
- Identifying problems on
research
3,82
- Determining the research scope
3,83
- Formulating the research problems
3,76
- Formulating the research hypothesis
3,76
- Using theoretical technique correctly
4,03
Research design 3,65
- Determining the research methods
3,50
- Deining the concepts of
research variables
3,76
- Deining the operational
concept of research variables
3,60
- Building a framework of
thinkinng on research 3,67
Data Collection 3,49
- Determining the population of research
3,81
- Determining the sampling techniques
3,45
- Determining the data collection methods
3,66
Data processing and analysis 3,59
- Data processing 3,26
- Data analysis 3,45
Research application 3,81
- Making the research report 3,90
- Explaining the contribution and the recommendation
3,77
- Publishing the result of study 3,86
Source: analyzed data of questionnaire, 2016
The research results illustrated that the lowest dimension of competence was the dimension of data collection with the mean of 3.49. Dimension is measured with three indicators. First, the ability to identify research. Second, competence in sampling techniques, and third, competence in techniques of data collecting. The result shows that competence in sampling technique is the lowest in average, while the point that shows respondent competence in indepth-inteview technique for its capability in collecting deeper information, is the highest in average. This shows that competency in of sampling techniques are low. Respondent are far more conidence in their ability to collect data by interview using in-depth interview technique. Research competency with second lowest in average is research data processing and analysis. Respondents are not quite conidence with their own competencies in using data processor such as Microsoft Excel and other statistics software such as SPSS, LISREL, and AMOS. Respondent also reveals their diiculties in presenting research’s result in the form of table, graphs, and diagram. However, there is high competence in qualitative data analysis, from competence in data reduction, data presentation, and conclusion. The research shows that research competency in quantitative techniques are still low. The research competence obtaining the highest mean was on the dimension of research application with the indicatorsof making a systematic study report to the user.Score distribution of research competences showed that the respondents with an average score were 23%, the respondents under the average score were 30%, and the respondents above the average score were 47%.
Productivity Analysis
Regarding the Researcher Characteristics
151
Research Productivity Factors in The Government Institutions(Study in the Oice of Research and Development and Training, Ministry of Religious Afairs of Indonesia)
Saimroh
productivity based on the characteristics of researchers including gender, educational qualiications, and functional position. The data of productivity were analyzed using analysis of variance (ANOVA) to determine the diferences in research productivity based on the characteristics of researchers. The scores of productivity based on the characteristics of respondents can bee seen in Table 4.
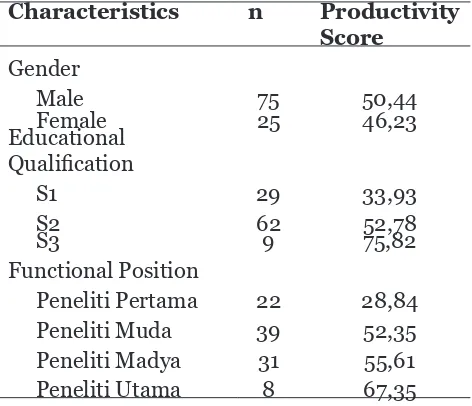
Table 4. The Research Productivity Based on the Characteristics of Researchers
Characteristics n Productivity
Score
Gender
Male 75 50,44
Female 25 46,23
Educational Qualiication
S1 29 33,93
S2 62 52,78
S3 9 75,82
Functional Position
Peneliti Pertama 22 28,84
Peneliti Muda 39 52,35
Peneliti Madya 31 55,61
Peneliti Utama 8 67,35
Source: analyzed data of questionnaire, 2016
Table 4 above showed that there were differences in productivity based on the scores of gender, educational qualification, and functional position. To determine whether there were significant differences of average, the data were then analyzed using analysis of variance with the results in Table 5. The criteria of decision-making was an error level α = 5%.If sig. was <0.05, we concluded that there was a significant difference.On the contrary if sig. was> 0.05,we concluded that there was no significant difference.
Table 5. Analysis of Variance Based on the Character -istics of Researchers
Variables Source of Variance
F Sig.
Productivity * Gender
Between Groups 0,309 0,580 Within Groups
Total
Productivity * Education
Between Groups 7,341 0,001 Within Groups
Total Productivity
* Position
Between Groups 4,640 0,004 Within Groups
Total
Source: Analyzed data of questionnaire, 2016
The result of analysis of variance to gender wassig. 0.580, so that we could conclud that the productivity of male and female researchers did not difer signiicantly. Analysis of variance for productivity based on the educational qualiications with sig. 0.001 meant that the research productivity difered signiicantly. The higher education of researchers, the more productive it would be. The researchers with educational qualiication of S2 was more productive than the researchers with educational qualiication of S1. Likewise, the researchers with educational qualiication of doctor (S3) produced the papers more than those with educational qualiication of master (S2). Analysis of variance of the average of productivity based on functional position showed signiicant result with sig. 0,004, which meant that the functional position of researchers could determine the research productivity. The higher the position, the more productive it would be. The young researchers (Peneliti Muda) produced papers more than the irst researcher (Peneliti
Pertama) did. Furthermore, the associate
researchers (Peneliti Madya) produced papers more than the young researchers (Peneliti Muda)
did. The principal researchers (Peneliti Utama)
had the highest productivity if compared with other functional positions (irst, young, and asociate). The analysis of variance showed that characteristics of researchers which could afect the research productivity were academic qualiication and functional position of researchers.
Testing Assumptions of Path Analysis
Analisa Journal of Social Science and Religion Volume 02 No.01 July 2017
pages 139-159
(1) the normality of standard error of estimates which requires that any parametric analysis such as path analysis requires the normal distribution of data, (2) the linearity of the correlation between variables that explains that the path analysis requires the linear correlation between variables, (3) the absence of multicollinearity among variables that explains that there is no a linear correlation or high correlation between variables. The Structural Equation Model of research productivity can bee seen in Figure 2.
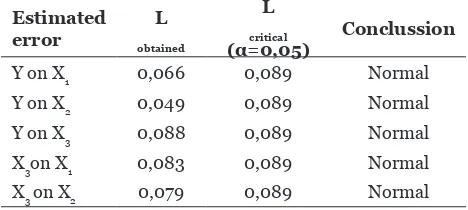
Normality test
For the normality test we used Liliefors test against estimated error which the deviation between observed scores and estimated scores. In this study the test of estimated error was conducted on the estimated error of regression of Y on X1, Y on X2, Y on X3, X1 on X3 and X2 on X3 (see igure 2). For Liliefors test we used the statistic test of L. The testing criteria was comparing the scores of Lobtained with Lcritical on the number of samples n and the error level α =
5%. The data will be distributed normally if the score of Lobtained is smaller than Lcritical, and on the contrary if the the score of Lobtained is greater than Lcritical, the distribution of estimated error is then not normal. The test results showed that all of the estimated error on the correlation between the independent variables and the dependent variable was normally distributed (see table 6).
Tabel 6. The results ofthe Normality Test of Estimat-ed Error
Estimated error
L
obtained
L
critical
(α=0,05) Conclussion
Y on X1 0,066 0,089 Normal Y on X2 0,049 0,089 Normal Y on X3 0,088 0,089 Normal
X3on X1 0,083 0,089 Normal X3 on X2 0,079 0,089 Normal Source: analyzed data of questionnaire, 2016
Multicolinearity Test
The multicolinearity test aimed to determine that between independent variables did not have linear correlation. The multicolinearity test was conducted
with software SPSS 16. The conditions in which multicolinearity could happen were indicated by VIF (Variance Inflation Factor) and the value of tolerance. .If the value of VIF was less than 10 and the value of tolerance was greater than 0.1, we concluded that the independent variable did not have multicolinearity. Table 7. and Table 8. show the test results of multicolinearityf or the two regression models (see figure 2).
Table 7. The Results of Multicolinearity Testof X1, X2, and X3against Y
Model Collinearity Statistics Tolerance VIF (Constant)
Subjective well-being
0,728 1,374
Knowledge 0,654 1,528
Comptence 0,698 1,433
Source: analyzed data of questionnaire, 2016
Table 7 showed the value of VIF for the variable of subjective well-being, knowledge sharing, and research competence which was less than 10, and the value of tolerance was greater than 0.1.This meant that the regression model did not have multicolinearity.
Table 8. The Results of Multicolinearity Testof X1, X2 against X3
Model Collinearity Statistics
Tolerance VIF
(Constant) Subjective well-being
0,771 1,298
Knowledge 0,771 1,298
Source: analyzed data of questionnaire, 2016
Table 8. showed the value of the VIF for the varible of subjective well-being and knowledge sharing which was less than 10, and the value of tolerance was greater than 0.1. This meant that the regression model did not have multicolinearity
Linearity Test
153
Research Productivity Factors in The Government Institutions(Study in the Oice of Research and Development and Training, Ministry of Religious Afairs of Indonesia)
Saimroh
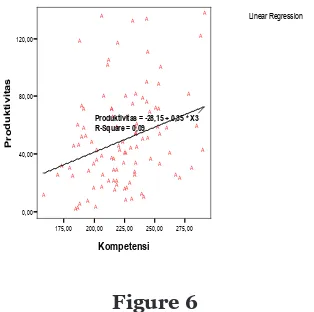
Figures 3, 4, 5, 6, and 7. On igure 3, 5, 6, and 7 showed the linear regression line that led to the upper right. This showed that there was a positive linear corelation, which meant that the increase in one variable would raise other variables. Figure 4. showed the linear regression line that led down. This showed that there was a negative linear corelation, which meant that the increase in one variable would decrease the other variables. The results of testing several assumptions for the path analysis concluded that all assumptions were met, so that the data could be analyzed further.
Figure 3
Scatter Plot for the corelation of X1 and Y
Linear Regression
-10,00 -5,00 0,00 5,00
SWB 0,00 40,00 80,00 120,00 Produktivitas A A A A A A A A A A A A A A A A A A A A A A A A A A A A A A A A A A A A A A A A A A A A A A A A A A A A A A A A A A A A A A A A A A A A A A A A A A A A A
AAA A A AA A A A A A A A A A A A A A A A A
Produktivitas = 49,39 + 3,04 * X1 R-Square = 0,06
Figure 4
Scatter Plot for the corelation of X2 and Y
Linear Regression
90,00 100,00 110,00 120,00 130,00 140,00
Knowledge 0,00 40,00 80,00 120,00 Produktivitas A A A A A A A A A A A A A A A A A A A A A A A A A A A A A A A A A A A A A A A A A A A A A A A A A A A A A A A A A A A A A A A A A A A A A A A A A A A A A A A A A
A A A A A A A A A A A A A A A A A A A
Produktivitas = 66,14 + -0,14 * X2 R-Square = 0,00
Figure 5
Scatter Plot for the corelation of X3 and Y
Linear Regression
175,00 200,00 225,00 250,00 275,00
Kompetensi 0,00 40,00 80,00 120,00 Produktivitas A A A A A A A A A A A A A A A A A A A A A A A A A A A A A A A A A A A A A A A A A A A A A A A A A A A A A A A A A A A A A A A A A A A A A A A A A A A A A A A A A
A A A A A A A A A A A A A A A A A A A
Produktivitas = -28,15 + 0,35 * X3 R-Square = 0,09
Figure 6
Scatter Plot for the corelation of X1 and X3
Linear Regression
-10,00 -5,00 0,00 5,00
SWB 175,00 200,00 225,00 250,00 275,00 Kompetensi A A A A A A A A A A A A A A A A A A A A A A A A A A A A A A A A A A A A A A A A A A A A A A A A A A A A A A A A A A A A A A A A A A A A A A A A A A A A A A A A A A A A A A A A A A A A A A A A A A A A
Kompetensi = 223,46 + 4,49 * X1 R-Square = 0,18
Figure 7.
Scatter Plot for the corelation of X2 and X3
Linear Regression
-10,00 -5,00 0,00 5,00
SWB 175,00 200,00 225,00 250,00 275,00 Kompetensi A A A A A A A A A A A A A A A A A A A A A A A A A A A A A A A A A A A A A A A A A A A A A A A A A A A A A A A A A A A A A A A A A A A A A A A A A A A A A A A A A A A A A A A A A A A A A A A A A A A A
Analisa Journal of Social Science and Religion Volume 02 No.01 July 2017
pages 139-159
Causal Relationship of Research Productivity
The model of causal relationship of research productivity was depicted in the structural equation. The test of the structural model was processed by using LISREL 8.80 (student). Figure 7 and 8 showed the empirical results of structural equation models processed using LISREL 8.80.
Figure 8.
Empirical Path Diagram of Structural Model of Re-search Productivity
The structural model of research productivity had a path of direct and indirect efect. The path of direct efect occured on the correlation between subjective well-being and knowledge sharing on research productivity. The path of indirect efect occured on the efect of subjective well-being and knowledge sharing on research productivity through the research competence. Figure 8 showed the path coeicient values for ρy1, ρy2, ρy3, ρ31 and ρ32ranging from 0.26; 0.36; 0.37; 0.23 and 0.40. The path coeicients indicated the magnitude of the direct efect. The path coeicient with the highest value was the path of direct correlation of the research competence to the research productivity. In igure 12 there was the path coeicient with negative value (-0.36), the path of knowledge sharing to research productivity, which meant that knowledge sharing provided direct negative efect on the research productivity.
Figure 9.
The Signiicance Test of Path Coeicient
The test of path coeicient was done with t-test statistic, which can be seen in Figure 13. By using the error level αof 5% it was obtained the value of tcritical = 1.96. Figure 9 provided the value of t test statistics