A multi-scale analysis of a terrestrial carbon budget
Is New Zealand a source or sink of carbon?
K.R. Tate
a,∗, N.A. Scott
a, A. Parshotam
a, L. Brown
a,b, R.H. Wilde
a,
D.J. Giltrap
c, N.A. Trustrum
a, B. Gomez
d, D.J. Ross
aaLandcare Research, Private Bag 11052, Palmerston North, New Zealand bEnvironment Waikato, PO Box 4010, Hamilton, New Zealand cSmall Office Systems Ltd., PO Box 46-024, Lower Hutt, New Zealand dGeomorphology Laboratory, Indiana State University, Terre Haute, IN 47809, USA
Abstract
Interest in national carbon (C) budgets has increased following the signing of the Kyoto Protocol as countries begin to develop source/sink C inventories. In this study, specific-site measurements, regional databases, satellite observations, and models were used to test the hypothesis that New Zealand’s terrestrial ecosystems are C neutral because C uptake by planted forests and scrub is roughly balanced by C losses from indigenous forests and soils.
Net ecosystem C balance was estimated from the difference between net primary production (NPP) and heterotrophic soil respiration. The productivity portion of the CASA model and NOAA–AVHRR imagery were used to estimate national NPP (128±14 Mt C per year). Main sources of uncertainty were the coarse spatial scale (1×1 km2grid cells), and the general lack of information on photosynthetically active radiation, light-use efficiency, and below-ground C allocation for the major vegetation types: indigenous and exotic forests, scrub, and grasslands (improved, unimproved and tussock). Total soil CO2-C
production predicted from an Arrhenius-type function coupled to climate and land-cover data was 380±30 Mt C per year, suggesting that New Zealand’s terrestrial ecosystems may be either (a) a net source of atmospheric CO2or (b) roughly in C
balance if ca. 252 Mt CO2-C per year (66%) can be attributed to roots. Soil moisture limitations on respiration were small,
reducing the national value to 365±28 Mt C per year. Differences between NPP and heterotrophic soil respiration were
−29 Mt C per year for improved pastures,−8 Mt C per year for indigenous forests, and+4 Mt C per year for planted forests; the large negative value for improved grasslands may be due to under-estimation of NPP and root respiration. Soil C losses to coastal waters, as estimated from a consideration of all the major erosion processes, were ca. 3–11 Mt C per year.
These national-scale estimates of ecosystem C balance were in general agreement with those based on plot-scale data for some major ecosystems including planted forests (4 Mt C per year vs 3.7 Mt C per year, respectively) and indigenous forest (−8 Mt C per year vs ca.−2.8 Mt C per year, respectively). Poor agreement for forest regenerating after land abandonment (−17 Mt C per year vs+3 Mt C per year) was probably due to an underestimate of NPP at the national scale.
Overall, the results suggest that New Zealand is a net C source, despite the fact that some ecosystems are accumulating C. For some land-use types, using the balance between NPP and soil respiration at the national scale to estimate the net
eco-∗Corresponding author.
E-mail address:[email protected] (K.R. Tate).
system C balance may be too coarse, and studies of land-use changes at finer spatial scales are needed to reduce uncertainties in national-scale C balance estimates. © 2000 Elsevier Science B.V. All rights reserved.
Keywords:Net primary production; Soil respiration; Scaling; Remote sensing; Models
1. Introduction
A ‘missing sink’ of carbon (C) of about 1.8 Pg per year (Schimel, 1995) has arisen from attempts to close the global C budget by balancing atmospheric car-bon dioxide (CO2) concentrations against fossil fuel
emissions, land-use change, and ocean C uptake (Tans et al., 1990). Although strong evidence now exists for the terrestrial biosphere being the most likely candi-date (Rayner et al., 1999), much uncertainty still sur-rounds the temporal variation and spatial distribution of this sink. Spatial and temporal patterns of C in-put to, and release by, soils are especially uncertain (Torn et al., 1997). Possible explanations for this sink (Lloyd, 1999) are forest regrowth, CO2 fertilisation,
and N deposition effects on terrestrial ecosystems. Interest in national C budgets has increased recently for several reasons. First, new national greenhouse gas reductions’ targets for Annexe One countries have been set under the Kyoto Protocol. If these targets are ratified, credible national strategies for reporting and reducing CO2 (and other greenhouse gas) emissions
will need to be developed, using internationally recog-nised methodologies subject to periodic auditing. Some countries have signalled their intention to use terrestrial sinks to reduce their CO2emissions (IGBP
Terrestrial Carbon Working Group, 1998). Presently, New Zealand relies heavily on C uptake and storage in exotic plantation forests (mainly Pinus radiata) to offset annual CO2 emissions of 7.5 Mt CO2-C
from energy and industrial sources (MfE, 1997). This strategy will increase the need for more integrated, multi-disciplinary approaches involving C monitor-ing at various scales, experimentation and modellmonitor-ing (Cannadel and Mooney, 1999). Second, projections of the likely effects of these emissions on climate are much less certain at regional and national scales, where assessments of societal impacts of changing climate are more pertinent than at the global scale. Third, strategies for achieving multiple environmental aims are likely to be more effective at the national scale, including reducing greenhouse gas emissions
and biodiversity loss, and protecting forests and pro-ductive soils. Finally, current efforts by signatories to the Kyoto Protocol to make C emissions-reduction targets binding may be a prelude to more compre-hensive full C-accounting (IGBP Terrestrial Carbon Working Group, 1998). This could be best achieved at the national scale, where databases, monitoring networks and historical knowledge are likely to be well coordinated (Tian et al., 1999).
Accordingly, we are using field and laboratory measurements, databases, satellite remote sensing and models to assess New Zealand’s national C balance at various spatial scales. We tested the hypothesis that New Zealand’s terrestrial ecosystems are in C balance, and that the substantial uptake of CO2 by
planted forests and aggrading scrublands is roughly balanced by potential C losses from indigenous forests and soils, by comparing NPP and soil heterotrophic respiration. The approach was first to establish a na-tional baseline of soil and vegetation C, against which to estimate changes (Tate et al., 1997). Second, as annual NPP is balanced by soil CO2 emissions in
ecosystems at steady state, each of these C fluxes was estimated nationally for the major vegetation types: indigenous and exotic forests; scrub; and grasslands (improved, unimproved, and tussock). Collectively, these ecosystems cover about 90% of New Zealand’s land area (Tate et al., 1997). Third, national-scale C balance estimates were compared with plot-based es-timates of the C balance for indigenous forests, exotic forests, and scrub. Fourth, the potential impact of soil erosion on national C balance estimates was exam-ined at different scales. Finally, information gaps, and major sources of uncertainty are discussed.
2. Methods
Calculation of a national C budget (NZCB) was based on the following mass-balance equation:
where CBALLCis the annual difference between total
net primary production (above- and below-ground) and soil heterotrophic respiration for the major land-cover types (see Section 2.1.1). Carbon dioxide emissions based on fossil fuel and energy consump-tion are represented by CO2fossil fuels, and C losses from
soil erosion by Cerosion. The methods used to estimate
each of these terms are described below.
2.1. National-scale estimates of net primary productivity
2.1.1. Model and data sources
Unless otherwise stated, net primary productivity (NPP) includes both above- and below-ground C al-location. A subset of the Carnegie–Ames–Stanford Approach (CASA) model was implemented (Potter et al., 1993) to estimate New Zealand’s annual NPP. The CASA model uses a parametric approach to de-rive NPP based on intercepted photosynthetically ac-tive radiation (IPAR) and a light-use efficiency factor (ǫ) that converts IPAR to NPP. NPP was calculated monthly for 1993 over 1×1 km2 grid cells using: (a) the fraction of photosynthetically active radiation (FPAR) derived from monthly normalised differ-ence vegetation index (NDVI) composites obtained from the advanced very high resolution radiometer (AVHRR) instrument on board the NOAA series of satellites, (b) monthly solar radiation and (c) gener-alised land-cover types based on the vegetative cover map of New Zealand (VCM) (Newsome, 1987), and
ǫfor each of the land-cover types.
NDVI data (based on the red and near-infrared reflectance) (Tucker et al., 1985) from the AVHRR sensor were obtained at 1×1 km2 resolution. How-ever, although the field of view at nadir is 1 km2, the off-nadir field of view ranges from 2.4 km along-track to 6.9 km across-track. Daily AVHRR imagery was, therefore, geo-referenced to the New Zealand Map Grid and re-sampled to a resolution of 1 km2and com-posited into monthly maximum value images (Hol-ben, 1986). A correction for solar zenith angle was also applied (Sellars et al., 1994). Land-cover types were created by generalising 47 vegetation classes (Newsome, 1987) into seven (cropland, grassland, grassland/scrub, scrub, grassland/forest, forest/scrub, and forest). Anǫvalue was assigned to each of these classes to predict NPP. Then, NPP estimates for these
seven classes were transformed into NPP estimates for six uniform land-cover types (indigenous forest, exotic forest, scrub, improved grasslands, unimproved grasslands, and tussock grasslands) by estimating the proportion of the area for each uniform vegetation type within a mixed class, and multiplying this proportion by the predicted NPP value for that (mixed vegetation) class. In this transformation, cropland was included with improved pasture, the grass component of the grassland/scrub went into unimproved grassland, and the grass component of the grassland/forest was in-cluded with improved pasture. Two sets ofǫ-values were used to estimate New Zealand’s NPP; one was based on Potter et al. (1993), and the other used val-ues derived for New Zealand ecosystems. Monthly climate variables, including daily average short-wave radiation to calculate IPAR from FPAR, were de-rived from individual meteorological data spatially interpolated onto a 1×1 km2resolution grid using to-pographic variables (Leathwick and Stephens, 1998).
2.1.2. Plot-scale NPP estimates used for model verification
NPP was also predicted for precise site locations (Table 1), for which independent estimates were available, by calculating a mean NPP from the sur-rounding eight pixels. NPP was determined for sites 1 and 5 by intensive gas exchange measurements (Benecke and Evans, 1987; Arneth et al., 1998); for site 1, NPP agreed well with a simulated estimate for another lowland old-growth beech forest (site 2) (Tate et al., 1993) (Table 1). In situ pulse labelling (14C)
was used to estimate NPP for two improved grassland sites (8, 9) (Saggar et al., 1999). The Rothamsted soil C turnover model (ROTHC) (Jenkinson, 1990) was used to estimate NPP (Jenkinson et al., 1992; Tate et al., 1993) at three forest (2–4) and two grassland (7, 10) sites (Table 1), by assuming steady-state con-ditions (i.e. detrital C input=soil CO2-C production).
NPP for scrub (site 6) was estimated from canopy information and a canopy-scale productivity model (D. Whitehead, pers. comm.).
2.2. National assessment of soil respiration
2.2.1. Data sources and national estimates
using an Arrhenius-type relationship (e.g., Lloyd and Taylor, 1994):
R=AB (2)
whereB=exp{ −308.56/(T−227.13)},Ais a data set-dependent parameter and T the temperature (K). The following steps were followed:
1. Monthly surfaces for the ratio R/R10 were calcu-lated for each 1×1 km2grid cell of a national tem-perature surface (Leathwick, 1998), whereRis the soil respiration rate at actual air temperature and R10 the soil respiration at 10◦C (New Zealand’s mean annual temperature). MonthlyR/R10 values
were averaged to provide a surface of mean annual relative respiration rates for each grid cell under NL moisture conditions.
2. To quantify the impact of moisture limitation (L), R/R10 was calculated by assuming that the
L respiration rate would equal the NL rate when soil moisture was at field capacity (−0.01 MPa), be at zero when soil moisture was at wilting point (−1.5 MPa) and at a fraction of the NL rate based on actual and potential evapotranspi-ration for intermediate soil moisture levels. The mean rate of monthly moisture-limited respira-tion would then equal the NL rate multiplied by the monthly actual-to-potential evapotranspiration ratio. A monthly water balance was calculated using mean monthly potential evapotranspiration (Leathwick, 1998) and soil moisture storage ca-pacity between−0.01 and −1.5 MPa (McDonald et al., 1988), averaged by major soil classes (IPCC, 1996). The actual monthly evapotranspiration was calculated along with the soil moisture deficit (potential−actual evapotranspiration) and used to calculate the actual moisture-limited respiration rate. Monthly average respiration rates (R/R10)
were again averaged to give a mean annual respi-ration surface for L and NL conditions.
3. Mean annual R/R10 surfaces for NL and L con-ditions were overlaid with the VCM (Newsome, 1987) to provide area-weighted mean R/R10 val-ues for each land-cover type. In mixed vegetation classes, the areas of each component (e.g., scrub in the scrub-grassland class) were estimated based on their relative abundance within the mixed cate-gory. The mean (NL and L) annual R/R10 values
for a mixed class were assumed to apply to each
component within the class. Then, mean annual R/R10 values for the six land-cover types were
generalised from the 47 vegetation classes as for the NPP simulations. Total area and area-weighted mean annualR/R10values for each land-cover type
were then calculated.
4. The mean annual R/R10 values were converted
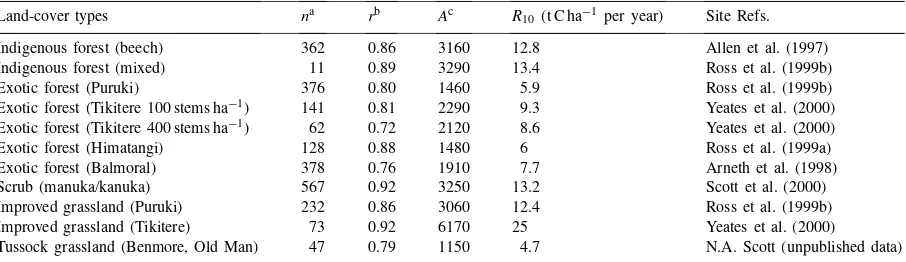
to land-cover specific respiration by estimating land-cover specific R10 values. To estimate R10, A values (the slope of the regression line) were first estimated for 11 ‘sites’ (Table 3) using lin-ear regression with zero constant intercept, where site-specific respiration was the independent vari-able andB(Eq. (2), using actual temperature data) was the dependent variable. Soil CO2 production
and temperature were measured using a closed chamber system connected to a portable infrared gas analyzer (IRGA) (SRC-1 and EGM, PP Sys-tems, Herts., UK) (Jensen et al., 1996). Data that were clearly subject to moisture L’s were ex-cluded. Analysis of variance of soil respiration vs Bfor the 11 sites was used to indicate within and between land-cover effects on estimated A values and calculatedR10values (t CO2-C ha−1per year).
5. Finally, national respiration rates (t CO2-C ha−1
per year) and total respiration (Mt CO2-C per year)
were calculated for each land-cover type by multi-plying the mean annual area-weightedR/R10values
by theR10estimates for each land-cover type.
Potential ‘temporal scaling’ errors in theR/R10
val-ues were identified by comparingR/R10values (based
on Eq. (11); Lloyd and Taylor, 1994) calculated using mean monthly, seasonal, or annual temperatures.
2.2.2. Estimates of heterotrophic respiration (Rh)
To determine Rh, the few root C allocation esti-mates available for New Zealand ecosystems (Table 1) were used to quantify autotrophic respiration from roots (Ra). Root C allocation ranged from 24% of to-tal NPP for aP. radiataforest (Arneth et al., 1998) to 80% for alpine tussock grassland (Tate et al., 2000), and generally agreed with published values for forests and grasslands (Ruimy and Saugier, 1994). For the six land-cover types, the following values were used to estimateRaby assuming, on a C basis, thatRaequates
unim-proved grassland (0.70), tussock grassland (0.80). This assumption was based on data for fine root pro-duction and respiration in temperate forests (Ryan et al., 1996; Keith et al., 1997), where Ra was
esti-mated to be roughly equivalent to below-ground NPP. In improved established grasslands, root biomass shows little temporal variation (Saggar et al., 1997), suggesting root biomass is near steady state; under these conditions, a 1 : 1 distribution of total respi-ration between Ra and Rh also appears reasonable, based on the estimates ofRa/total soil respiration for grassland soils summarised in Hanson et al. (2000).
2.3. National soil erosion
National estimates of C losses from soil erosion were based on regional sediment-yield data (Glasby, 1991), initially assuming that landsliding (0.85 m depth) was the key erosion process. Average soil C concentration was estimated at 1.89% (average soil C concentration to 0.85 m depth for all pedons in the National Soils Database; McDonald et al., 1988). Potential scaling errors associated with estimating national soil C loss by erosion were then investigated by quantifying the contribution of sediment (and C) from different erosion processes (shallow landslides (soil slips), gully, and sheet erosion) in the Waipaoa River basin (2200 km2) and the Lake Tutira catch-ment (32 km2) located in the east coast region of the North Island (Page et al., 1994a,b; Trustrum et al., 1998, 1999). In the Waipaoa River basin, estimates of sediment production for the period 1920–2000 (i.e. 80 years following land clearance) by different erosion processes were derived from detailed analysis of individual catchment sediment budgets (Trustrum et al., 1998, 1999). Soil C removed by each process was estimated using average soil C content for a range of disturbed and undisturbed, but deforested, soil profiles (M. McLeod, pers. comm.). For shallow landsliding and gully erosion (assumed to be confined to the upper 0.85 m of the soil profile), an average soil C content of 1.89% was assumed (see above). For sheet erosion (assumed to erode the upper 0.1 m of soil), a soil C value of 5.25% (M. McLeod, pers. comm.) was used to estimate C losses. The amount of C sequestered on the floodplain in the lower reaches of the basin in the same 80-year period was estimated on the basis of the volume of the alluvial sediments
and their average C content (1.3%) as determined by coring. Likewise, C stored on the continental shelf was estimated using an average C content of 1.0%.
3. Results and discussion
3.1. NPP
3.1.1. NPP for major land-cover types
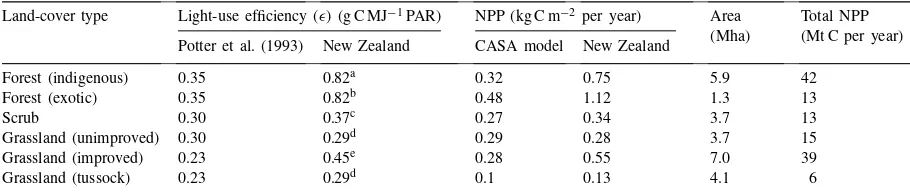
National NPP estimates based on light-use effi-ciency values (ǫ) constrained by temperature and moisture (Potter et al., 1993) were generally lower than those based on the New Zealand-derivedǫ-values, ranging from no difference in unimproved grasslands to over two fold lower estimates in indigenous forests (Table 2). Using theǫ-values from Potter et al. (1993), New Zealand’s NPP was estimated to be 69 Mt C per year. This is well below the total NPP value of 128 Mt C per year obtained from the six land-cover types (Table 2) using ǫ-values that included New Zealand-derived ǫ-values for exotic and indigenous forests, and scrub (Table 2). These land-cover types represent nearly half of New Zealand’s land area, so their combined NPP has a major influence on the national NPP estimate.
Over 50% of NPP for New Zealand is contributed by the remnant indigenous forests and improved grasslands. Although the area of exotic forests con-tinues to expand, and they are a major C sink for New Zealand (MfE, 1997), they contribute only ca. 10% to simulated NPP. Low NPP values for tussock grass-lands are expected for two reasons: they include large areas of land degraded by overgrazing and burning (Ross et al., 1997), and large areas that occur above ca. 1300 m elevation and are frequently interspersed with bare rock and scree.
Table 2
Estimates of NPP of the major land-cover types using different models and values for light-use efficiency (ǫ) Land-cover type Light-use efficiency (ǫ) (g C MJ−1PAR) NPP (kg C m−2per year) Area
(Mha)
Total NPP (Mt C per year) Potter et al. (1993) New Zealand CASA model New Zealand
Forest (indigenous) 0.35 0.82a 0.32 0.75 5.9 42
Forest (exotic) 0.35 0.82b 0.48 1.12 1.3 13
Scrub 0.30 0.37c 0.27 0.34 3.7 13
Grassland (unimproved) 0.30 0.29d 0.29 0.28 3.7 15
Grassland (improved) 0.23 0.45e 0.28 0.55 7.0 39
Grassland (tussock) 0.23 0.29d 0.1 0.13 4.1 6
aWhite et al. (2000). bCoops et al. (1998).
cD. Whitehead (unpublished data). dBartlett et al. (1990).
eSchapendonk et al. (1998).
ecosystems experience few climatic constraints, in contrast to those used by Potter et al. (1993) where single vegetation ‘classes’ spanned a wide latitudinal range. In New Zealand, mean annual soil tempera-tures range between 8 and 15◦C over 75% of the land area, and nearly 90% of New Zealand experiences no prolonged soil moisture deficit on a regular basis.
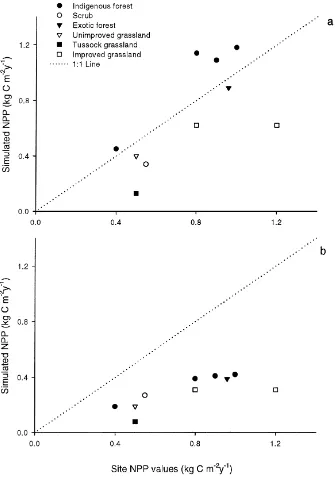
3.1.2. Comparison of simulated NPP with site-specific NPP estimates
Individual site NPP estimates (Table 1) generally agreed well with predicted NPP values from the CASA model (using 1×1 km2 grid cells) (Fig. 1). Using the New Zealand-derived ǫ-values (Fig. 1a), predicted NPP compared favourably with site esti-mates (R2 = 0.47), and the slope of the regression (0.97) was close to 1. Results from ANOVA sug-gested there was no significant within-land use effect or bias between the values predicted by the model and site-specific NPP estimates. Although predicted NPP using ǫ-values from Potter et al. (1993) correlated more closely with site-specific NPP (R2 = 0.55), the slope of the regression (0.31) suggested a sig-nificant bias between predicted and measured results (Fig. 1b). The biggest discrepancy between predicted and measured NPP was at the tussock-grassland site, where the undisturbed grassland was in an area dom-inated by scree and bare ground, resulting in a low simulated NPP of 0.13 kg C m−2 per year. Overall,
these results suggest that the national NPP esti-mate of 128±14 Mt C per year based on our New Zealand-derivedǫ-values is reasonable.
3.1.3. NPP estimates using different models
A national estimate of New Zealand’s terrestrial NPP has not previously been reported. The magnitude of this C flux can, however, be calculated from esti-mates of the total stocks and turnover time of soil C, assuming steady-state conditions. For New Zealand, an NPP of ca. 140 Mt C per year was calculated by combining the soil C stock (0–1 m depth) of 4260±
190 Mt C (Tate et al., 1997) with a turnover time of ca. 30 years (Tate et al., 1995) at 10◦C (the mean annual temperature for New Zealand).
The agreement between our estimate of 128 Mt C for total NPP using the CASA model (Table 2) and the value of ca. 140 Mt C per year described above is encouraging but not confirmatory. Large uncertainties exist in the national NPP estimate due to the large grid cell size (1×1 km2), the areal extent of different land-cover types, and limited information on light-use efficiency values and below-ground C allocation for the major New Zealand vegetation types. More robust APAR values are also needed, because the spatial vari-ability of predicted NPP is determined largely by this parameter (Ruimy et al., 1999). Further studies us-ing more sophisticated process-modellus-ing approaches at different spatial scales are now being made; these should provide a more reliable test of New Zealand’s first national NPP estimate based on this simple para-metric approach.
3.1.4. Temporal scaling of NPP estimates
Fig. 1. Site specific NPP (kg C m−2per year) estimates for indigenous forests, scrub, exotic forest, and grassland (improved, unimproved and
tussock), based on the use of the productivity portion of the CASA model and NOAA–AVHRR imagery, and on plot-scale measurements and models. Light-use efficiency (ǫ) values used for (a) were derived for New Zealand ecosystems, and (b) were from Potter et al. (1993).
NPP for New Zealand by estimating NDVI values at different temporal scales. First, four seasonal raster images were produced for solar radiation and NDVI by combining months as described in Section 2. These
se-lected, and the estimated NPP for that month was multiplied by 3 to ‘simulate’ seasonal NPP. These re-sults were combined to produce an annual NPP of 0.27 kg C m−2. Finally, images representing averaged
(over all months) solar radiation and NDVI were pro-duced, and the model was then re-run to estimate the ‘averaged’ NPP value. This monthly average was mul-tiplied by 12 to give an annual NPP of 0.23 kg C m−2.
Annual NPP values estimated by these different ap-proaches are similar to the value of 0.27 kg C m−2
obtained by aggregating monthly NPP estimates, and suggest that, for 1993, four seasonal images would have been sufficient to obtain a credible annual NPP estimate based on the CASA model (Potter et al., 1993).
3.1.5. NPP comparisons at different spatial scales Global NPP models (Kicklighter et al., 1999) pre-dict NPP at a relatively coarse spatial scale (often 1◦×1◦ (latitude×longitude)) pixels. Whether pre-dictions at this spatial scale are relevant to national C budgets is not clear. Although the CASA model has been used for global-scale simulations (Potter et al., 1993), the model was run for New Zealand with input data available at much finer spatial resolution than is available (or practical) for global-scale simulations.
For New Zealand, global-scale simulations predict NPP for about 26 pixels at a 1◦×1◦resolution (Nielson and Running, 1996). Using average NPP values simu-lated with satellite imagery obtained in 1987 (mapped
Table 3
Sites used to estimateAvalues based on soil respiration measurements; all data collected since 1995
Land-cover types na rb Ac R10(t C ha−1 per year) Site Refs.
Indigenous forest (beech) 362 0.86 3160 12.8 Allen et al. (1997)
Indigenous forest (mixed) 11 0.89 3290 13.4 Ross et al. (1999b)
Exotic forest (Puruki) 376 0.80 1460 5.9 Ross et al. (1999b)
Exotic forest (Tikitere 100 stems ha−1) 141 0.81 2290 9.3 Yeates et al. (2000)
Exotic forest (Tikitere 400 stems ha−1) 62 0.72 2120 8.6 Yeates et al. (2000)
Exotic forest (Himatangi) 128 0.88 1480 6 Ross et al. (1999a)
Exotic forest (Balmoral) 378 0.76 1910 7.7 Arneth et al. (1998)
Scrub (manuka/kanuka) 567 0.92 3250 13.2 Scott et al. (2000)
Improved grassland (Puruki) 232 0.86 3060 12.4 Ross et al. (1999b) Improved grassland (Tikitere) 73 0.92 6170 25 Yeates et al. (2000)
Tussock grassland (Benmore, Old Man) 47 0.79 1150 4.7 N.A. Scott (unpublished data)
aNumber of respiration measurements/site. bFrom linear regression with zero constant intercept. cData-set dependent variable.
as a range of NPP), NPP for New Zealand was esti-mated to be about 251 Mt per year. A value of 0.46 was assumed to convert NPP (dry matter) to C; this value is the mean of accepted values for herbaceous vegeta-tion (0.42) and woody vegetavegeta-tion (0.50) (Schlesinger, 1991). This gives an annual NPP of 115 Mt C per year for New Zealand, which compares favourably with our estimate of 128 Mt C per year.
3.2. Respiration
Soil respiration resulting from the contemporane-ous oxidation of soil organic matter by heterotrophic microorganisms (Rh) and autotrophic root respiration
(Ra) (Raich and Schlesinger, 1992) is a major C flux
in the global C cycle. Accurate, unbiased estimates of soil respiration rates have been achieved across a wide range of ecosystem types and soil tempera-tures using an Arrhenius-type relationship (Lloyd and Taylor, 1994). We therefore used this relationship to estimate annual soil respiration for New Zealand’s major land-cover types.
type. The most dramatic example of this is the differ-ence between the two improved grassland sites. Val-ues of Awere generally higher at warmer sites, and differed significantly across land-cover types (F3,8=
4.94, P =0.03). Comparison of paired sites that dif-fered in land-cover type only (viz. exotic forest and improved grassland at Tikitere and Puruki) suggests that lowerAvalues are associated with exotic forests. This is due to the lower proportion of NPP allocated to roots (Table 1) in exotic forests. The values of 308.56 and 227.13 K for the parametersE0andT0(Lloyd and Taylor, 1994) were used, and provided as good a fit to the data as did data-specific parameters. These Lloyd and Taylor (1994) values were therefore used with av-erage land-cover specificAvalues for all national soil respiration calculations. The fact that the temperature response of soil respiration measurements can largely be explained (Table 3) by Lloyd and Taylor’s (1994) Arrhenius-type relationship is encouraging, and sug-gests this relationship is not scale-dependent for these non-water limited sites.
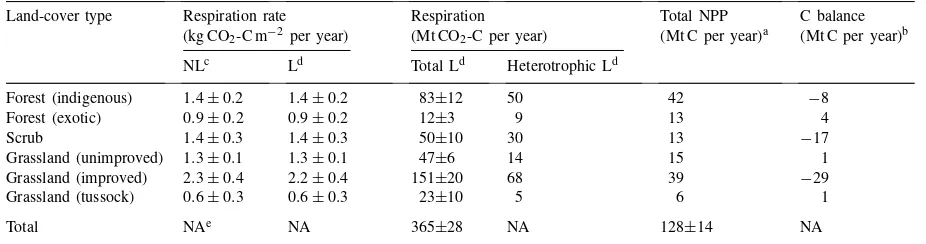
Soil respiration for improved grasslands (2.3 kg CO2-C m−2 per year) is much higher than for the
other land-cover types (Table 4). This is likely to be due to both the relatively high productivity of these grasslands compared to other grasslands (Table 2) and the high proportion of below-ground C allocation (Table 1). However, this estimate should be treated with caution as it is based onA values for two sites that differed markedly; seasonal effects on soil
res-Table 4
Soil respiration (means±SEM), total NPP, and C balance of the major land covers Land-cover type Respiration rate
(kg CO2-C m−2 per year)
Respiration (Mt CO2-C per year)
Total NPP (Mt C per year)a
C balance (Mt C per year)b
NLc Ld Total Ld Heterotrophic Ld
Forest (indigenous) 1.4±0.2 1.4±0.2 83±12 50 42 −8
Forest (exotic) 0.9±0.2 0.9±0.2 12±3 9 13 4
Scrub 1.4±0.3 1.4±0.3 50±10 30 13 −17
Grassland (unimproved) 1.3±0.1 1.3±0.1 47±6 14 15 1
Grassland (improved) 2.3±0.4 2.2±0.4 151±20 68 39 −29
Grassland (tussock) 0.6±0.3 0.6±0.3 23±10 5 6 1
Total NAe NA 365±28 NA 128±14 NA
aNew Zealand estimates (cf. Table 3); SEM for total estimated from ANOVA of simulated vs site NPP values (see Section 3.1.2). bTotal NPP minus heterotrophic respiration.
cNon-moisture limited. dMoisture limited. eNot applicable.
piration may have contributed to this difference. The lower respiration rate for Puruki is, in fact, similar to the rates for the native forest and scrub sites, but is considerably higher than those for the exotic for-est and tussock-grassland sites (Table 3). Low soil respiration values for tussock grasslands (Table 4) probably resulted from their very low NPP (Table 2) and consequent lowAvalues (Table 3). Soil respira-tion tended to be lower in exotic forests as compared with native forests, most likely because of the smaller number of fine roots in the forest floor layer of the exotic forests (N.A. Scott, unpublished data).
Differences in respiration rates between land-cover types, and differences inAvalues, are in part related to the greater temperature sensitivity (higherQ10) of root
the land area; the smallest contribution is from tussock grasslands (see Section 3.1.1).
Potential temporal scaling errors in national res-piration estimates were investigated by comparing the results obtained using mean monthly tempera-tures with those that would have been obtained using mean seasonal and annual temperatures. These com-parisons showed that if mean seasonal temperatures had been used, only small errors would have resulted (national range 0–2%, average 0.7%). If mean an-nual temperatures had been used, more significant errors would have been introduced (national range 1–12%), but national total soil respiration would have been over-predicted by only 4%. These errors arise from the non-linearity of the Arrhenius-type temperature-response function.
3.2.1. Heterotrophic respiration
Using the root allocation values in Table 1,Ra
val-ues for indigenous forests, exotic forests, scrub, and grasslands (unimproved, improved, tussock) were 33, 3, 20, 33, 83, and 18 Mt CO2-C per year, respectively.
Heterotrophic respiration was then calculated as the difference between total respiration (Table 4) andRa. At the national scale, heterotrophic respiration ranged from 5 to 68 Mt CO2-C per year for the different
land-cover types (Table 4); it was highest in improved grasslands due to both high respiration rates per unit area (Table 4) and their large areal extent (Table 2). Although uncertainty values for total respiration for the different land-cover types could be estimated (Table 4), it was not possible to quantify uncertainty in Rh for the whole country because few data on
root allocation were available for all the land-cover types.
3.2.2. Moisture effects on soil respiration
There are small areas of New Zealand (east coasts of the North and South Islands, and central South Island east of the Southern Alps) where prolonged summer soil moisture deficits can affect soil respiration. For example, moisture L of soil respiration was observed in a semi-arid tussock grassland following a prolonged dry period in April 1999 (N.A. Scott, unpublished data). The national comparison of predicted total soil respiration under both L and NL conditions indicated that soil moisture deficit has little influence on soil respiration rates (Table 4). The increasing frequency
of El Nino events over the past decade has, however, caused prolonged drought over much larger areas in the eastern parts of North and South Islands. During drought years, therefore, soil respiration–temperature relationships alone will not provide reliable national soil respiration estimates.
3.3. National C balance
Subtraction of heterotrophic respiration from the corresponding NPP estimate for each land-cover type (Table 4) gives an estimate of the annual C balance, viz. net ecosystem production (NEP). However, it must be emphasised that these C balance estimates need to be treated with caution given the uncertain-ties in the assessment of both respiration and NPP. These NEP results suggest that indigenous and ex-otic forests, and unimproved and tussock grasslands, are likely to be in C balance over a one-year time period, whereas scrub and improved pastures appear to have relatively large C losses (Table 4). Vegetation in scrub ecosystems is, however, likely to be accu-mulating C nationally (Scott et al., 2000) over both short and long time scales, and could be a significant C sink comparable to exotic forests in New Zealand (see Section 3.4). The annual C loss suggested for scrub probably resulted from an under-estimate of NPP. Short-statured scrub dominated by gorse (Ulex europaeus) and broom (Cytisus scoparius) is exten-sive in areas of uneconomic (low productivity) pas-toral land, and is likely to have lowǫ-values. Older stands of manuka (Leptospermum scoparium) and kanuka (Kunzea ericoides) scrub could, however, have
ǫ-values that are similar to indigenous forest because they have similar proportions of woody and canopy tissue to larger trees (Scott et al., 2000). Light-use efficiency values were not available for other scrub types, so a conservative value of 0.37 g C MJ−1PAR
(D. Whitehead, pers. comm.) was used, based on mea-surements at a temperature-limited site. This may have led to an under-estimate of NPP for scrub vegetation nationally.
respiration between the two improved grassland sites. Use of the lowerR10 value of 12.4 for the Puruki site,
instead of the mean value of 18.7 for the two improved grassland sites (Table 3), would reduce the imbalance from −30 to −7 Mt C. The apparently large C loss may have also resulted, in part, from under-estimation of root respiration (Ra), based on 55% C allocation to
roots (Table 1). Recent research, using13C to trace C uptake and allocation in pastures, suggests that root C allocation varies from 39 to 51% across various man-agement regimes and seasons (Stewart and Metherell, 1999). If these lower estimates of root allocation are used, the annual net C loss for improved grasslands appears even greater, at 45 Mt C per year. Alterna-tively, estimates of NPP in improved grasslands may have been too low. Defining and quantifying NPP in grazed systems is problematic (McNaughton et al., 1996), and it is possible that the satellite-derived NPP estimate for New Zealand’s grazed grassland ecosystems is incorrect. This is possible because a conservative value forǫof 0.45 was used, which falls at the low end of the range reported (Schapendonk et al., 1997) for Lolium perenne L. of 0.38–1.13. More refined NPP estimates may be achieved us-ing pasture production models (e.g., Schapendonk et al., 1998) linked to national information on animal abundance.
Our estimate ofRh, based on the assumption that Ra and root C allocation are equal, could have
con-tributed to some of the large C imbalances observed (e.g. in improved grasslands). An alternative approach would be to assume thatRais a constant proportion of
total soil respiration. Several studies have attempted to partition total soil respiration into autotrophic and heterotrophic components (e.g. Bowden et al., 1993; Haynes and Gower, 1995), with results for Ra
vary-ing from about 25 to 60% of the total (Landsberg and Gower, 1997; Hanson et al., 2000). Use of anRa/Rtotal value of 45% for forests and 55% for grasslands (Han-son et al., 2000), would giveRhestimates of 46, 7, 25, 19, 60, and 9 Mt CO2-C per year for indigenous and
exotic forests, scrub, unimproved and improved grass-lands, and tussock grassgrass-lands, respectively. These al-ternative estimates would have a small impact on the national C balance for each land-cover type, with the only change in sign (i.e. switching from a gain to a loss) occurring in unimproved and tussock grasslands (Table 4). Clearly, this is an area where more
infor-mation is required to improve the robustness of our national-scale C balance calculation.
3.3.1. Major sources of uncertainty
Large uncertainties were anticipated from the out-set when estimating the C balance of New Zealand’s terrestrial ecosystems from differences between NPP and Rh. This is an inevitable outcome of compar-ing two large numbers. Moreover, estimatcompar-ing these differences on an annual basis assumes that this is the most relevant time frame over which to measure both NPP and soil respiration. This may be reason-able for improved grasslands, where growth rates and turnover times are relatively rapid, but is questionable for indigenous forests, where NPP and soil respiration might not be synchronised on an annual basis (Tate et al., 1993). However, the general agreement between national-scale NEP simulations and plot-based C bud-get estimates (see Section 3.4.3) for both indigenous and exotic forests suggests that this assumption intro-duced no major uncertainty.
The standard error of the mean (SEM) for NPP for each land-cover type could not be quantified because data for the whole population of grid cells were used. In contrast, an SEM of ca. 14 Mt C per year for the national NPP was achieved from prediction of NPP for specific sites where independent estimates had been made (Fig. 1). The large number of soil respi-ration measurements from several land-cover types provided the opportunity to estimate SEMs for each land-cover type (Table 4), if the assumption was made that the residual uncertainty was homogeneous across the different land-cover types. Although future work will need to include estimates of uncertainty for both NPP and soil respiration for the different land-cover types, comparisons between simulated and measured national C budget estimates (see Section 3.4) are encouraging. They suggest that for most ma-jor land-cover types, the national-scale NEP estimates are in general agreement with those based on specific plots.
3.4. Land-use change and national C budgets — analysis at finer spatial scales
rather large uncertainties associated with each C flux. This analysis is, however, based on flux estimates over just one year. Over time, New Zealand’s national C budget could be strongly influenced by factors such as land-use change that alter the ‘balance’ between NPP and soil respiration, resulting in non-steady-state ecosystems. These factors must be included in national-scale C budget calculations. In this sec-tion, estimates of C gain or loss based on data collected at finer spatial scales are compared with the national-scale C balance simulations. The veg-etation and soil C changes discussed below do not occur indefinitely, however, and their effect on the national-scale C budget will diminish as the ecosys-tems involved approach a new steady state.
3.4.1. Abandonment of agricultural land
Based on land-cover data for 1987, abandonment of uneconomic pasture land (primarily in the North Island hill country) and re-growth of scrub vegeta-tion has been a major land-use change (Newsome, 1987). In 1987, ca. 3.5 million hectares of New Zealand’s land area was covered by scrub vege-tation, with ca. 1 million hectares dominated by manuka and kanuka. This vegetation often estab-lishes following disturbances such as fire, and fre-quently invades pasture land when grazing ceases. These particular species grow rapidly, and stands of ca. 35 years can accumulate ca. 150 t C ha−1 in
the vegetation (Scott et al., 2000). Although the CBAL (Eq. (2)) estimate for this land-cover type is
−17 Mt C per year (Table 4), this large predicted loss may have resulted from an under-estimate of NPP (Section 3.3).
Depending on the age-class distribution nationally, manuka and kanuka could sequester large amounts of C each year. If a maximum biomass of 170 t C ha−1
af-ter 50 years is assumed, average biomass accumulation would be 3.4 t C ha−1per year. If this scrub vegetation occupies 1 million hectares, it could be accumulating about 3.4 Mt C per year. Use of a more conservative estimate based on a maximum age of 80 years (and the same maximum biomass of 170 t C ha−1) would give
an average accumulation of 2.1 Mt C per year. Using a national biomass estimate for manuka/kanuka scrub of 50 t C ha−1from a national vegetation database (Hall
et al., 1998), and again assuming 80 years as a maxi-mum stand age, the national estimate is only 0.6 Mt C
per year. However, none of these estimates accounts for differences in scrub growth rates related to climate, soil type, and previous land-use. More work is needed to refine these estimates and assess their impact on the national C budget.
3.4.2. Planting of exotic forests
At the national scale, increased planting of exotic forests (primarily P. radiata) is the most important land-use change occurring in New Zealand. In 1996, 84 000 ha of new forest planting occurred (MAF, 1998). Carbon accumulation in these plantations varies with site quality, but when averaged over the national forest estate, is about 230 t C ha−1 over 30
years. At harvest, about half of this C remains on the site as slash, roots, forest floor and stumps; much of it is eventually oxidised and returned to the atmosphere as CO2 (Maclaren, 1996). However, if the harvested
area is replanted to another rotation, the C remaining after harvest is considered to be ‘stored’, and averages about 112 t C ha−1 nationally (Maclaren, 1996). The
amount of C sequestered by plantation forests is well documented, and in 1995 about 1.5 million hectares of these forests sequestered 3.7 Mt CO2-C, about half
of New Zealand’s total CO2 emissions for that year
(MfE, 1997). The estimate CBAL (Eq. (2)) (+4 Mt C per year; Table 4) agrees closely with this nationally reported estimate.
Current national reporting of C accumulation in plantation forests includes C accumulation in the for-est floor, without considering changes in organic C in the mineral soil (MfE, 1997). About 84% of the new exotic forests established in 1996 were on land previously used for pasture (MAF, 1998). Compari-sons of soil C at paired sites, where land-use is the only different factor, have indicated that organic C in the surface mineral-soil layers is 17–40% lower under plantation forests than pasture (Alfredsson et al., 1998; Scott et al., 1999). Similar differences in mineral-soil C were found for these two land-use types in a national soil C database linked to polygons described by soil type, climate, and land-use (Scott et al., 1999). However, lower mineral-soil C under exotic forests could be offset by C accumulation in the forest floor, which averaged 20 t C ha−1 (Scott
et al., 1999); this forest floor C is included in the 112 t C ha−1estimated to be the average exotic-forest
3.4.3. Carbon storage in native forests
Native forests in New Zealand occupy about 6.5 million hectares (Newsome, 1987) and contain about 940 Mt C in live and dead biomass (Hall et al., 1998), making them the largest vegetation C reservoir na-tionally. Although there is currently little harvesting of native timber, other disturbances besides natural mortality may be influencing the stability of these forests. Over 70 million possums (Trichosurus vulpec-ula) (Seitzer and Gatseiger, 1992) are a major pest (Rose et al., 1992), consuming ca. 21 000 t of vegeta-tion each day (Seitzer and Gatseiger, 1992). Most of this browsing is targeted towards a few species and, where possums are common, major changes in for-est structure, composition, and biomass have occurred (Rogers, 1995).
Based on plot re-measurement data in the 1970s, some forest types in South Island appear to be losing C from the live vegetation pool at a rate of up to 12 t C ha−1per year (Hall and Hollinger, 1997). Over
the entire South Island, however, forest biomass ap-pears to be constant or increasing slightly (0.30 Mt C per year), based on current estimates of biomass change (Hall and Hollinger, 1997). The data for South Island showed that the largest decreases in forest biomass occurred in forest classes that are more com-mon on North Island. If the biomass changes for each forest class are extrapolated to North Island, estimates suggest these North Island forests could be losing 0.7 Mt C per year. These losses could be higher, how-ever, as suggested by the national CBAL (Eq. (2)) estimate of−8 Mt C per year (Table 4). North Island forests have suffered greater impacts from herbivores than South Island forests (Rogers, 1995). Changes in forest composition and structure will also alter annual rates of C uptake, and could create stands of high productivity following major disturbance. Over-all, significant uncertainty still exists in our estimates of the contribution of native forests to the national C budget, but ongoing work in forest inventory and productivity modelling will refine these estimates.
4. Soil erosion
Soil erosion has been identified as one of the most pervasive forms of anthropogenically induced degra-dation of terrestrial ecosystems (Valentin, 1996), and
could have a major impact on national C budgets (Eq. (1)). New Zealand is tectonically active, has a young landscape, and is located in a climatic regime that is periodically disturbed by high intensity rain storms. The soft-rock hill country that accounts for more than 40% of the land area was largely defor-ested by Maori and European settlers. This defordefor-ested area is susceptible to landsliding and accelerated ero-sion, and has greatly increased the supply of sediment to stream channels and floodplains (Trustrum et al., 1990). Though most of New Zealand catchments are small (typically a few 1000 km2 in area), they discharge large amounts of sediment to the ocean (284 Mt per year from South Island and 103 Mt per year from North Island rivers; Glasby, 1991).
If landsliding (to 0.85 m depth, with an average C concentration over this depth of 1.89%) was the main sediment source, then national C loss from soil erosion would be ca. 3 Mt C per year. However, catchment-scale research has demonstrated the need to consider additional erosion processes when quan-tifying robust catchment-scale sediment-C budgets (Page et al., 1994a,b; Trustrum et al., 1998, 1999). For example, in the Waipaoa River basin historical land-use change has led to enhanced runoff and soil erosion, and the generation of ca. 15×106t per year of sediment over 80 years (Hicks et al., 2000). Al-though gully erosion generated most of the sediment, it accounted for only about 2% of C losses; shallow landslides accounted for about 25% of the C loss. Sheet erosion, while contributing only about 10% of the catchment sediment yield, accounted for about 50% of C loss. The remaining 20% of C loss is gen-erated by earthflows, tunnel gullies, bank erosion and vegetation inputs. If landsliding was assumed to be the main sediment source, total C loss would be only about 50% of the C that has accumulated in the flood-plain and on the continental shelf over 80 years. By attributing C losses to the different erosion processes, we can account for about 80% of whole-catchment C losses. Clearly, national estimates of C losses from erosion need to include erosion processes other than just landsliding.
by landslide erosion. In these catchments, relative C losses by landslides and sheet erosion are likely to be more balanced than in the Waipaoa catchment. For example, in the Lake Tutira catchment, landsliding (1.89% C) generated about 70–80% of the sediment supplied to the lake; sheet erosion (5.25% C) con-tributed the balance. These results suggest that land-slides accounted for about 50% of the C losses in this catchment (Trustrum et al., 1998, 1999).
If landsliding and sheet erosion are assumed to each contribute about 40% of the national sediment yields (387±130 Mt; Glasby, 1991), and the remaining 20% are related to other erosion processes, then annual C losses by erosion of ca. 11 Mt C for New Zealand are possible; only net C losses from land to sea are con-sidered in this calculation. This C loss by erosion is probably an overestimate, however, as it assumes that the land surface had largely not been disturbed, so that the C concentration of the sediment from sheet erosion was 5.25%. Nevertheless, the importance of sheet ero-sion is substantiated by Lambert et al.’s (2000) finding that C inputs to soil under hill country pastures are in-sufficient to sustain current soil C levels. Whether the transfer of C from terrestrial ecosystems to the ocean represents a major C loss depends on the fate of the sediment material once it has reached the marine en-vironment.
5. National C budget
Overall, the estimate of PCBALLC (Eq. (1))
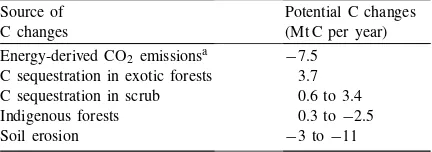
in-dicates a large annual C loss from New Zealand’s terrestrial ecosystems (Table 4). Plot-scale estimates, however, suggest that C accumulates in scrub-lands following land abandonment (Section 3.4.1) (Table 5). The predicted C loss from improved grass-lands (Table 4) may be too large, and could partly arise from difficulties associated with estimating NPP in grazed ecosystems (McNaughton et al., 1996). Assum-ing that these two land-cover types are C neutral, then based on all land-cover types, New Zealand is likely to be roughly in C balance. However, when potential C losses from soil erosion, and from energy-related national CO2 emissions of 7.5 Mt C ha−1 per year
(MfE, 1997), are included in the national C budget (Table 5), New Zealand appears to be a net C source (Table 5).
Table 5
National C budget for New Zealand based on plot-scale estimates of changes in C storage for forests and scrublands. Negative values represent a C loss, positive values a C gain
Source of C changes
Potential C changes (Mt C per year) Energy-derived CO2 emissionsa −7.5
C sequestration in exotic forests 3.7 C sequestration in scrub 0.6 to 3.4 Indigenous forests 0.3 to−2.5
Soil erosion −3 to−11
aMfE (1997).
6. Concluding remarks
National and regional verification of global-scale NPP prediction is essential to improve our understand-ing of global C-cyclunderstand-ing processes. The national-scale NPP estimate of 128 Mt C per year agreed quite well with one global-scale prediction of 115 Mt C per year for New Zealand (Kicklighter et al., 1999). How-ever, application of a global-scale NPP model (Potter et al., 1993) to national C budgets, using globally constrained parameters (Table 2), can lead to major errors in national C budgets.
This study represents the first national-scale assess-ment of New Zealand’s terrestrial C balance based on differences in annual NPP and soil heterotrophic respiration. Despite the large inherent uncertainties, the net ecosystem C balances estimated for the major land-cover types at different scales were in general agreement, suggesting that New Zealand is a net C source (Tables 4 and 5). The most serious discrepancy was for improved grasslands, where a large net C loss was indicated; an additional C loss could result from erosion. National soil C losses to the coast by erosion were estimated for the first time in this study. They appear to represent a major terrestrial C loss for New Zealand, and highlight the need to include erosion processes in national C balance estimates.
While the uncertainties associated with national-scale estimates of NPP and soil respiration are likely to be too large to meet international reporting require-ments, they provide direct estimates of national-scale C exchange (a direct measure of CO2 emissions).
Methodologies for national reporting of CO2
standing stocks can be done with known sampling precision, it is difficult to account for all the errors and to detect small (significant) changes in large numbers. For example, the standing C stock in New Zealand’s indigenous forests is about 940 Mt C (Hall et al., 1998). A 5% change in this stock (47 Mt C) is roughly equivalent to 1 year of NPP for these forests (Table 4). National scale, spatially extensive assess-ments of forest productivity could provide informa-tion on where changes are occurring, the temporal and spatial scale over which changes occur, and their contribution to (possible) changes in C stocks. Over-all, it is the combination of approaches that is most likely to provide the most robust national C budgets. This study enhances the robustness of estimates of New Zealand’s net CO2 emissions for international
greenhouse gas reporting under the Framework Con-vention for Climate Change. It also points to areas where more information is required to improve further our understanding of New Zealand’s C budget.
Acknowledgements
Many people contributed information to this manuscript. Soil respiration data were collected by C. Feltham, J. Townsend, and N. Rodda; P. Newsome assisted with generalisation of land-cover types from mixed vegetation classes; J. Barringer identified the sites for respiration measurements in the Benmore and Old Man ranges; J. Townsend, N. Rodda, G. Rodgers, and P. Whaley assisted with scrub biomass measurements; J. White and D. Whitehead provided valuable comments and information on light-use effi-ciency values for New Zealand’s indigenous forests. This work was supported by the New Zealand Foun-dation for Research, Science and Technology (CO 9817), and by the National Science Foundation (Grant SBR-9807195) (for BG).
References
Alfredsson, H., Condron, L.M., Clarholm, M., Davis, M.R., 1998. Changes in soil acidity and organic matter following the establishment of conifers on former grassland in New Zealand. For. Ecol. Mgmt. 112, 245–252.
Allen, R.B., Clinton, P.W., Davis, M.R., 1997. Cation storage and availability along aNothofagusforest development sequence in New Zealand. Can. J. For. Res. 27, 323–330.
Arneth, A., Kelliher, F.M., McSeveny, T.M., Byers, J.N., 1998. Net ecosystem productivity, net primary productivity and ecosystem carbon sequestration in aPinus radiataplantation subject to soil water deficit. Tree Physiol. 18, 785–793.
Bartlett, D.S., Whiting, G.J., Hartmann, J.M., 1990. Use of vegetation indices to estimate intercepted solar radiation and net carbon dioxide exchange of a grass canopy. Remote Sensing Environ. 30, 115–128.
Benecke, U., Evans, G., 1987. Growth and water use inNothofagus truncata(Hard beech) in temperate hill country, Nelson, New Zealand. In: Yang Hanxi, Wang Zhan, Jeffers, J.N.R., Ward, P.A. (Eds.), The Temperate Forest Ecosystem. Institute of Terrestrial Ecology Symposium No. 20. Institute of Terrestrial Ecology, Cumbria, UK, pp. 131–140.
Boone, R.D., Nadelhoffer, K.J., Danary, J.D., Kaye, J.P., 1998. Roots exert a strong influence on the temperature sensitivity of soil respiration. Nature 396, 570–572.
Bowden, R.D., Nadelhoffer, K.J., Boone, R.D., Melillo, J.M., Garrison, J.B., 1993. Contributions of above ground litter, below ground litter, and root respiration to total soil respiration in a temperate mixed hardwood forest. Can. J. For. Res. 23, 1402– 1407.
Cannadel, J., Mooney, H.A., 1999. Ecosystem metabolism and the global carbon cycle. Trends Ecol. Evol. 14, 249.
Coops, N.C., Waring, R.H., Landsberg, J.J., 1998. Assessing forest productivity in Australia and New Zealand using a physiologically-based model driven with averaged monthly weather data and satellite-derived estimates of canopy photosynthetic capacity. For. Ecol. Mgmt. 104, 113–127. Glasby, G.P., 1991. A review of the concept of sustainable
mana-gement as applied to New Zealand. J. R. Soc. NZ 21, 61–81. Hall, G.M.J., Hollinger, D.Y., 1997. Do the indigenous forests affect the net CO2 emissions policy of New Zealand? NZ For.
(February), 24–31.
Hall, G., Wiser, S., Allen, R., Moore, T., Beets, P., Goulding, C., 1998. Estimate of carbon stored in New Zealand’s indigenous forest and scrub vegetation for 1990. Contract Report JNT9798/147. New Zealand Ministry for the Environment. 84 Boulcott St., Wellington, New Zealand.
Hanson, P.J., Edwards, N.T., Garten, C.T., Andrews, J.A., 2000. Separating root and soil microbial contributions to soil respiration: a review of methods and observations. Biogeo-chemistry 48, 115–146.
Haynes, B.E., Gower, S.T., 1995. Below-ground carbon allocation in unfertilized and fertilized red pine plantations in southern Wisconsin. Tree Physiol. 15, 317–325.
Hicks, D.M., Gomez, B., Trustrum, N.A., 2000. Erosion thresholds and suspended sediment yields: Waipaoa River basin, New Zealand. Water Resour. Res. 36, 1129–1142.
Holben, B.N., 1986. Characteristics of maximum value composite images from temporal AVHRR data. Int. J. Remote Sensing 7, 1417–1434.
IGBP Terrestrial Carbon Working Group, 1998. The terrestrial carbon cycle: implications for the Kyoto Protocol. Science 280, 1393–1394.
Inventories: Reference Manual. Land-use Change and Forestry, pp. 5.6–5.75 (Chapter 5).
Jenkinson, D.S., 1990. The turnover of organic carbon and nitrogen in soil. Phil. Trans. R. Soc. B 329, 361–368.
Jenkinson, D.S., Harkness, D.D., Vance, E.D., Adams, D.E., Harrison, A.F., 1992. Calculating net primary production and annual input of organic matter to soil from the amount and radiocarbon content of soil organic matter. Soil Biol. Biochem. 24, 295–308.
Jensen, L.S., Mueller, T., Tate, K.R., Ross, D.J., Magid, J., Nielsen, N.E., 1996. Soil surface CO2flux as an index of soil respiration
in situ: a comparison of two chamber methods. Soil Biol. Biochem. 28, 1297–1306.
Keith, H., Raison, R.J., Jacobsen, K.L., 1997. Allocation of carbon in a mature eucalypt forest and some effects of soil phosphorus availability. Plant and Soil 196, 81–99.
Kicklighter, D.W., Bondeau, A., Schloss, A.L., Kaduk, J., McGuire, A.D., 1999. Comparing global models of terrestrial net primary productivity (NPP): global pattern and differentiation by major biomes. Global Change Biol. 5 (Suppl. 1), 16–24.
Lambert, M.G., Clark, D.A., Mackay, A.D., Costall, D.A., 2000. Effects of fertiliser application on nutrient status and organic matter content of hill soils. N.Z.J. Agr. Res. 43, 127–138. Landsberg, J.J., Gower, S.T., 1997. Applications of Physiological
Ecology to Forest Management. Academic Press, San Diego, CA.
Leathwick, J.R., 1998. Climate surfaces for New Zealand. In: Wilde, R.H. (Ed.), Information in Formation, Vol. 10. Landcare Research, Private Bag 11052, Palmerston North, New Zealand, pp. 9–10.
Leathwick, J.R., Stephens, R.T.T., 1998. Climate surfaces for New Zealand. Landcare Research Report LC9798/126, 19 pp. Lloyd, J., 1999. Current perspectives on the terrestrial carbon
cycle. Tellus 51B, 336–342.
Lloyd, J., Taylor, J.A., 1994. On the temperature dependence of soil respiration. Funct. Ecol. 8, 315–323.
Maclaren, J.P., 1996. Plantation forestry: its role as a carbon sink. In: Bouma, W.J., Pearman, G.I., Manning, M.R. (Eds.), Greenhouse: Coping with Climate Change. CSIRO Publishing, Collingwood, Victoria, pp. 417–436.
MAF, 1998. A National Exotic Forest Description as at April 1997. Ministry of Agriculture and Forestry, Wellington, New Zealand. ISSN 1170-5191.
McDonald, W.S., Giltrap, D.J., McArthur, A.J., 1988. Revised SPGI Database System Manual (V1.2). New Zealand Soil Bureau Laboratory Report SS16. Department of Scientific and Industrial Research, Wellington.
McNaughton, S.J., Milchunas, D.G., Frank, D.A., 1996. How can net primary production be measured in grazing ecosystems? Ecology 77, 974–977.
MfE, 1997. Climate Change: The New Zealand Response. II. New Zealand’s Second National Communication under the Framework Convention for Climate Change. New Zealand Ministry for the Environment, 84 Boulcott Street, Wellington, New Zealand.
Newsome, P.F.J., 1987. The Vegetative Cover of New Zealand. Water and Soil Miscellaneous Publication No. 112. National Water and Conservation Authority, Wellington.
Nielson, R.P., Running, S.W., 1996. Global dynamic vegetation modelling: coupling biogeochemistry and biogeography models. In: Walker, B.H., Steffan, W.L. (Eds.), Global Change and Terrestrial Ecosystems. IGBP Book Series No. 2. Cambridge University Press, Cambridge, pp. 451–465.
Page, M.J., Trustrum, N.A., DeRose, R.C., 1994a. A high resolution record of storm-induced erosion from lake sediments, New Zealand. J. Paleolimn. 11, 333–348.
Page, M.J., Trustrum, N.A., Dymond, J.R., 1994b. Sediment budget to assess the geomorphic effect of a cyclonic storm, New Zealand. Geomorphology 9, 169–188.
Potter, C.S., Randerson, J.T., Field, C.B., Matson, P.A., Vitousek, H.A., Mooney, H.A., Klooster, S.A., 1993. Terrestrial ecosystem production: a process model based on global satellite and surface data. Global Biogeochem. Cycles 7, 811–841. Raich, J.W., Schlesinger, W.H., 1992. The global carbon dioxide
flux in soil respiration and its relationship to vegetation and climate. Tellus 44B, 81–99.
Rayner, P.J., Enting, I.G., Francey, R.J., Langenfelds, R., 1999. Reconstructing the recent carbon cycle from atmospheric CO2,
d13C, and O2/N2. Tellus 51B, 213–232.
Rogers, G., 1995. World of wounds. In: Close, I. (Ed.), New Zealand Forest and Bird. Royal Society of New Zealand, Wellington, New Zealand, pp. 23–30.
Rose, A.B., Pekelharing, C.J., Platt, K.H., 1992. Magnitude of canopy dieback and implications for conservation of southern Rata-Kamahi (Metrosideros umbellata-Weinmannia racemosa) forest, central Westland, New Zealand. NZ J. Ecol. 16, 23–32. Ross, D.J., Tate, K.R., Feltham, C.W., 1996. Microbial biomass, and C and N mineralization, in litter and mineral soil of adjacent montane ecosystems in a southern beech (Nothofagus) forest and a tussock grassland. Soil Biol. Biochem. 28, 1613–1620. Ross, D.J., Speir, T.W., Tate, K.R., Feltham, C.W., 1997. Burning
in a New Zealand snow tussock grassland: effects on soil microbial biomass and nitrogen and phosphorus availability. NZ J. Ecol. 21, 63–71.
Ross, D.J., Kelliher, F.M., Tate, K.R., 1999a. Microbial processes in relation to carbon, nitrogen and temperature regimes in litter and a sandy mineral soil from a central SiberianPinus sylvestris
L. forest. Soil Biol. Biochem. 31, 757–767.
Ross, D.J., Tate, K.R., Scott, N.A., Feltham, C.W., 1999b. Land-use change: effects on soil carbon, nitrogen and phosphorus pools and fluxes in three adjacent ecosystems. Soil Biol. Biochem. 31, 803–813.
Ruimy, A., Saugier, B., 1994. Methodology for the estimation of terrestrial net primary production from remotely sensed data. J. Geophys. Res. 99 (D3), 5263–5283.
Ruimy, A., Kergoat, L., Bondeau, A., 1999. Comparing global models of terrestrial net primary productivity (NPP): analysis of differences in light absorption and light-use efficiency. Global Change Biol. 5 (Suppl. 1), 56–64.
Ryan, M.G., Hubbard, R.M., Pongracic, S., Raison, R.J., McMurtrie, R.E., 1996. Foliage, fine-root, woody-tissue and stand respiration inPinus radiatain relation to nitrogen status. Tree Physiol. 16, 333–343.
Saggar, S., Mackay, A.D., Hedley, C.B., 1999. Hill slope effects on the vertical fluxes of photosynthetically fixed14C in a grazed pasture. Aust. J. Soil Res. 37, 655–666.
Schapendonk, A.H.C.M., Dijkstra, P., Groenwold, J., Pot, C.S., van de Geijn, S.C., 1997. Carbon balance and water use efficiency of frequently cutLolium perenneL. swards at elevated carbon dioxide. Global Change Biol. 3, 207–216.
Schapendonk, A.H.C.M., Stol, W., van Kraalingen, D.W.G., Bouman, B.A.M., 1998. LINGRA, a sink/source model to simu-late grassland productivity in Europe. Eur. J. Agron. 9, 87–100. Schimel, D.S., 1995. Terrestrial ecosystems and the carbon cycle.
Global Change Biol. 1, 77–91.
Schlesinger, W.H., 1991. Biogeochemistry: An Analysis of Global Change. Academic Press, San Diego, CA.
Scott, N.A., Tate, K.R., Ford-Robertson, J., Giltrap, D.J., Smith, C.T., 1999. Soil carbon storage in plantation forests and pastures: land-use change implications. Tellus 51B, 326–335. Scott, N.A., White, J.D., Townsend, J., Whitehead, D., Leathwick,
J., Hall, G., Marden, M., Rogers, G., Watson, A.J., Whaley, P., 2000. Carbon and nitrogen distribution and accumulation in a New Zealand scrubland ecosystem. Can. J. For. Res., in press. Seitzer, S., Gatseiger, A., 1992. Possum: an ecological nightmare.
NZ Geogr. 13, 42–70.
Sellars, P.J., Tucker, C.J., Collatz, G.J., Los, S.O., Justice, C.O., Dazlich, D.A., Randall, D.A., 1994. A global 1◦×1◦ NDVI data set for climate studies. Part 2. The generation of global fields of terrestrial biophysical parameters from the NDVI. Int. J. Remote Sensing 15, 3519–3545.
Stewart, D.P.C., Metherell, A.K., 1999. Carbon (13C) uptake and
allocation in pasture plants following field pulse-labelling. Plant and Soil 210, 61–73.
Tans, P.P., Fung, I.Y., Takahashi, T., 1990. Observational cons-traints on the global atmospheric CO2 budget. Science 242,
1431–1438.
Tate, K.R., Speir, T.W., Ross, D.J., Parfitt, R.L., Whale, K.H., Cowling, J.C., 1991. Temporal variations in some plant and soil P pools in two pasture soils of widely different P fertility status. Plant and Soil 132, 219–232.
Tate, K.R., Ross, D.J., O’Brien, B.J., Kelliher, F.M., 1993. Carbon storage and turnover, and respiratory activity, in the litter and soil of an old-growth southern beech (Nothofagus) forest. Soil Biol. Biochem. 25, 1601–1612.
Tate, K.R., Parshotam, A., Ross, D.J., 1995. Soil carbon turnover in temperate forests and grasslands — a New Zealand perspective. J. Biogeogr. 22, 695–700.
Tate, K.R., Giltrap, D.J., Claydon, J.J., Newsome, P.F., Atkinson, I.A.E., Taylor, M.D., Lee, R., 1997. Organic stocks in New Zealand’s terrestrial ecosystems. J. R. Soc. NZ 27, 315– 335.
Tate, K.R., Scott, N.A., Ross, D.J., Parshotam, A., Claydon, J.J., 2000. Plant effects on soil carbon storage and turnover in a montane forest and adjacent grassland in New Zealand. Aust. J. Soil Res. 38, 685–698.
Tian, H., Melillo, J.M., Kicklighter, D.W., McGuire, A.D., Helfrich, J., 1999. The sensitivity of terrestrial carbon storage to historical climate variability and atmospheric CO2 in the
United States. Tellus 51B, 414–452.
Torn, M.J., Trumbore, S.E., Chadwick, O.A., Vitousek, P.M., Hendricks, D.M., 1997. Mineral control of soil organic carbon storage and turnover. Nature 389, 170–173.
Trustrum, N.A., Blaschke, P.B., DeRose, R.C., West, A.W., 1990. Regolith changes and pastoral productivity declines following deforestation in steeplands of North Island, New Zealand. Transactions of the 14th International Congress on Soil Science, Kyoto, Japan, August 1990, pp. 125–130.
Trustrum, N.A., Reid, L.M., Page, M.J., Gomez, B., Marden, M., Peacock, D.W., Hicks, D.M., 1998. The Waipaoa project: sediment budgets for catchment management. In: Proceedings of the Joint NZSSS and NZARM Conference, Gisborne, November 1998, pp. 69–70.
Trustrum, N.A., Gomez, B., Page, M.J., Reid, L.M., Hicks, D.M., 1999. Sediment production, storage and output: the relative role of large magnitude events in steepland catchments. Z. Geomorph. (Suppl.) 115, 71–86.
Tucker, C.J., Vanpraet, C., Sharman, M.J., Van Ittersum, G., 1985. Satellite remote sensing of total herbaceous biomass production in the Senegalese Sahel: 1980–1984. Remote Sensing Environ. 17, 223–249.
Valentin, C., 1996. Soil erosion under global change. In: Walker, B., Steffen, W. (Eds.), Global Change and Terrestrial Eco-systems. Cambridge University Press, Cambridge, pp. 317– 338.
White, J.D., Coops, N.C., Scott, N.A., 2000. Predicting broad-scale forest biomass in New Zealand: estimates of indigenous New Zealand forest and scrub biomass from the 3-PG model. Ecol. Model. 131, 175–190.