SUSCEPTIBILITY EVALUATION AND MAPPING OF CHINA’S LANDSLIDE
DISASTER BASED ON MULTI-TEMPORAL GROUND AND REMOTE SENSING
SATELLITE DATA
Chun Liua,b, Weiyue Lia,b, Ping Lua, Kai Sangb, Yang Honga and Rongxing Lia
a
Center for Spatial Information Science and Sustainable Development, Tongji University, China
bDepartment of Surveying and Geo-Informatics, Tongji University, China
Commission VIII, WG VIII/1
KEY WORDS: landslide, empirical model, ANN learning, susceptibility, hazard mapping
ABSTRACT:
Under the circumstances of global climate change, nowadays landslide occurs in China more frequently than ever before. The
landslide hazard and risk assessment remains an international focus on disaster prevention and mitigation. It is also an important
approach for compiling and quantitatively characterizing landslide damages. By integrating empirical models for landslide disasters,
and through multi-temporal ground data and remote sensing data, this paper will perform a landslide susceptibility assessment
throughout China. A landslide susceptibility (LS) map will then be produced, which can be used for disaster evaluation, and provide
basis for analyzing China’s major landslide-affected regions. Firstly, based on previous research of landslide susceptibility
assessment, this paper collects and analyzes the historical landslide event data (location, quantity and distribution) of past sixty years
in China as a reference for late-stage studies. Secondly, this paper will make use of regional GIS data of the whole country provided
by the National Geomatics Centre and China Meteorological Administration, including regional precipitation data, and satellite
remote sensing data such as from TRMM and MODIS. By referring to historical landslide data of past sixty years, it is possible to
develop models for assessing LS, including producing empirical models for prediction, and discovering both static and dynamic key
factors, such as topography and landforms (elevation, curvature and slope), geologic conditions (lithology of the strata), soil type,
vegetation cover, hydrological conditions (flow distribution). In addition, by analyzing historical data and combining empirical
models, it is possible to synthesize a regional statistical model and perform a LS assessment. Finally, based on the 1km×1km grid,
the LS map is then produced by ANN learning and multiplying the weighted factor layers. The validation is performed with reference
to the frequency and distribution of historical data.
This research reveals the spatiotemporal distribution of landslide disasters in China. The study develops a complete algorithm of data
collecting, processing, modelling and synthesizing, which fulfils the assessment of landslide susceptibility, and provides theoretical
basis for prediction and forecast of landslide disasters throughout China.
Weiyue Li(1983-), male, PhD candidate, main research interests-laser scanning data processing and application.
1. INTRODUCTION
Natural disasters are abnormal and inevitable phenomena, from
the nature on which human beings depend to live. It did harm
to the human society, mainly including earthquake, volcano,
landslide, debris flow, typhoon, flood, soil erosion,
desertification, water pollution, and so on. These disasters are
complicated and closely connected with environmental
degradation and human life (Henderson, 2004). The casualties
and property losses caused by landslide are often listed first in
phenomenon that a large number of mountain materials
suddenly downward slides along a sliding surface of the
interior in the gravity by a variety of external factors, for
instance, earthquake, volcano, river erosion, snow melt, rainfall
and human activities (Kirschbaum et al, 2010). Especially, the
destructive force of other secondary disasters induced by large
landslide far exceeds its direct damage. In recent years,
mudslides which were affected by global climate change
occurred frequently. More than 90,000 landslide hidden
dangers are located in 70 cities and counties of several southern
and north-western provinces in China, and tens of millions of
people live under the threat of landslide throughout the year.
Landslide caused thousands of deaths and tens of billions of
property loss (Zhou et al, 2005). Therefore, landslide
monitoring, assessment and prediction are advanced subjects of
international landslide disaster research and environmental
engineering geology field nowadays.
Many causes of landslide occurrence mainly include terrain,
geology, geomorphy, weather conditions, land cover, and so on
(Parry, 2011). Obtaining the relationships between these above
factors and landslide occurrence is very important for the
quantitative evaluation of landslide susceptibility (LS) and
hazards. LS assessment is the quantitative or qualitative
evaluation for the existing or potential type, volume,
distribution of some area’s landslide, and LS mapping would
conduce to us the space distribution of one regional slope
instability probability (Mathew et al, 2008). It is the first and
most step of landslide risk assessment, in order to make
effective measures of landslide mitigation. Reliable
susceptibility assessment depends on the quality and range of
the available data and the selection of method for modelling to
identify landslide, analyze landslide formation conditions and
characteristics, show landslide detailed geometric description.
LS assessment typically excludes the prediction of occurrence
time, is an important feature of susceptibility evaluation
(Ercanoglu, 2008).
Based on historical data and practical experience, empirical
landslide susceptibility assessments adopt the statistical
approach and pattern recognition methods to construct
empirical models. Meanwhile, empirical weights of landslide
factors can be obtained by the initial analysis; and spatial
associations between spatial factors and landslides will be
showed in a GIS (Geographic Information System). Artificial
neural network (ANN) can analyze complex data at different
scales such as continuous, indexical and binary data (Chauhan
et al, 2010). Based on learning from data with known
characteristics to obtain the weights of factors, ANN is used to
recognize the unseen data (Pradhan, 2011). In this paper, we
used the ANN black box by capturing the connection weights
among various inputs, with multi-temporal ground and remote
sensing satellite data for susceptibility evaluation and mapping
of China’s landslide disaster.
2. STUDY AREA AND DATA
China lies in the east of the Asia-Europe Continent, on the
western shore of the Pacific Ocean, and covers about 9.6
million km2 land area (between latitudes 3.85°N and 53.56°N,
between longitudes 73.55°E and 135.08°E). The terrain of
China is high in east but low in west. Mountain, plateau and
hills cover about 67% of the land area; basin and plain cover
about 33%. China is one of the countries which are most
vulnerable to landslide disaster. Some studies indicated that
landslide disaster mainly happened in a steep slope such as the
river and stream coast of bank slope zone, and the gorges with
high level difference; in geological tectonic belt (fractures or
structural zones); in the soft rock-soil (loose covering layer,
loess, mudstone, shale, coal beds); in some areas with heavy
rainfall (He et al, 2008).
The reports of the landslide events for nearly 60 years were
obtained mainly from online news reports, yearbooks, and
hazard database, including: China Geological Environmental
Information Network (CGEIN, http://www.cigem.gov.cn/);
China Risk Network (CRN, http://www.irisknet.cn/); Geostress
and Geological Disaster Querying Database (GGDQD,
http://www.geomech.ac.cn/geo0503/); China Statistical
Yearbook (1950-2011); China major landslide reports (from
newspaper and media). Since the 1980s, numbers of reports
started to increase, concerned with the government’s attention.
To be emphasized, numbers of landslide reports of the south
and southwest are more than that of other regions.
Many causes of landslide occurrence previous mentioned can
be divided into two main categories (Wu and Sidle, 1995):
(1) Internal factors: those that have decision effects on
landslide, including geology, geomorphology, slope gradient,
slope aspect, elevation, soil property, vegetation cover, flow
distribution, fracture, and so on.
(2) External factors: they will trigger landslide suddenly, such
Obviously, the variation of external factors is a short process,
and usually unpredictable; the distribution of internal factors
act on LS. The relevant data were provided by the National
Geomatics Centre, and network:
(https://modaps.nascom.nasa.gov:8499/,http://srtm.csi.cgiar.org
/SELECTION/inputCoord.asp)(Table1).
Table 1. Data sources and specific use.
Description Data types
Satellite/sensor Spatial resolution Year of acquisition
Specific use
Remote sensing data Terra, Aqua/MODIS 250m 2003-2011 Vegetation cover
DEM(Digital Elevation Model)
90m 2000 Slope gradient,
aspect, elevation
Geological maps Scale: 1:500,000 2000 Lithology
Soil type maps Scale: 1:3,000,000 2000 Soil type
Geomorphologic maps Scale: 1:3,000,000 2000 Convexity
River distribution maps Scale: 1:3,000,000 2000 Flow distribution
Seismic zone distribution of China
2008 Fracture
3. LANDSLIDE FACTORS IDENTIFICATION
The quantification of different factors is to select the landslide
region per unit area. It can be seen the parameters to describe
the relationship between factors and landslide (Kumar et al,
2010). Because the historical data collected mainly reflected
the numbers of landslide occurrence, relative probabilities of
different distribution intervals were qualitatively analyzed.
RPmn is the relative probability that factor m lies within the
range n with the following formula (1):
m mn mn
P P
RP (1)
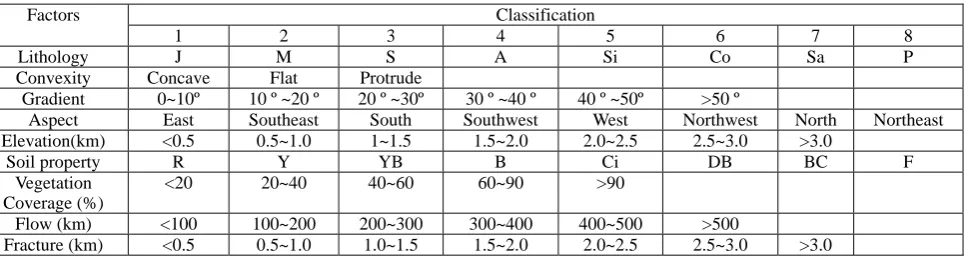
Synthesizing the above analysis, the factors associated with LS
were categorized according to the different levels (Table 2).
According to the summary from CDSTM, the formation
conditions of landslide in China which mainly contained:
Jurassic, Mudstone of Cretaceous, Shale, Argillaceous
Sandstone, Siltstone, Coal Beds, Sandy Slate, Phyllite; the
types of convexity include: concave, flat, protrude; with the
increase of slope gradient, the component force of gravity in
the slope direction, and landslide would have higher risks (Dai
et al, 2002); slope aspect is mainly divided into eight directions;
the relationship exists between elevation and landslide, such as
in high mountains, which were comprised of weathered and
tough rocks, that is less likely for landslide ; the higher the
vegetation coverage is, the smaller the landslide possibility;
meanwhile, landslide is bound up with the distribution of flow
and fracture (Montgomery et al, 2002).
CDSTM: (China Digital Science and Technology Museum,
http://amuseum.cdstm.cn/moundisaster/ page/knowledgec.jsp?pid=3100502)
Table 2. Evaluation factors and classifications
Classification Factors
1 2 3 4 5 6 7 8
Lithology J M S A Si Co Sa P
Convexity Concave Flat Protrude
Gradient 0~10º 10 º ~20 º 20 º ~30º 30 º ~40 º 40 º ~50º >50 º
Aspect East Southeast South Southwest West Northwest North Northeast
Elevation(km) <0.5 0.5~1.0 1~1.5 1.5~2.0 2.0~2.5 2.5~3.0 >3.0
Soil property R Y YB B Ci DB BC F
Vegetation Coverage (%)
<20 20~40 40~60 60~90 >90
Flow (km) <100 100~200 200~300 300~400 400~500 >500
Fracture (km) <0.5 0.5~1.0 1.0~1.5 1.5~2.0 2.0~2.5 2.5~3.0 >3.0
(Notes: J, M, S, A, Si, C, Sa, P represent the eight lithology of causing landslide: Jurassic, Mudstone of Cretaceous, Shale, Argillaceous Sandstone, Siltstone,
soil, Cinnamon soil, Dark-brown soil, Brown coniferous forest soils, Fluvo-aquic soil. )
4. LS ASSESSMENT AND ANALYSIS BASED ON ANN
4.1 ANN concepts
ANNs are generic non-linear functions that have been broadly
used to solve many problems like confirming weight values and
classification, with processing unit, network topology, and
training rules. Multi-Layer Perception (MLP) as a frequently
used ANN, includes input, output, and one or more hidden
layers between in-out layers. Meanwhile, the number of
neurons from the input to output layers is typically fixed by the
model designed. By trial and error, the neurons and the number
of hidden layers can be determined (Gong, 1996). There are
three steps involved in ANN data processing, including: the
training, the weights confirmation, the classification. Training
data from input neurons are processed through hidden nodes to
obtain output values. If the input that a single neuron j with the
only one hidden layer, may be expressed as:
i t
i ij
j w p
net
1
(2)
Where wij represents the weights between the node i of input
layer and the node j of hidden layer; pi is the input data; t
represents the number of input layers. The relative probabilities
of factors into LS values may also be regarded as the problem
of judging weights. Input layers include the above 9 factors:
Lithology, Convexity, Gradient, Aspect, Elevation, Soil
property, Vegetation cover, Flow, Fracture; the ANN output
may be considered as the measurements of the occurrence of
landslide (Figure 1).
Figure 1. ANN structure chart of LS analysis
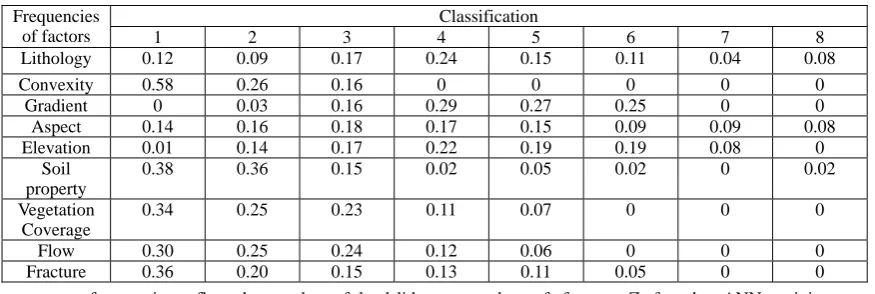
4.2 Factors acquisition of the samples
With the previous 1,200 records, and the equation (1),
occurrence frequencies of different input factors (quantitative
values) had been obtained (Table 3).
Table 3 Occurrence frequencies of different input factors
Classification Frequencies
of factors 1 2 3 4 5 6 7 8
Lithology 0.12 0.09 0.17 0.24 0.15 0.11 0.04 0.08
Convexity 0.58 0.26 0.16 0 0 0 0 0
Gradient 0 0.03 0.16 0.29 0.27 0.25 0 0
Aspect 0.14 0.16 0.18 0.17 0.15 0.09 0.09 0.08
Elevation 0.01 0.14 0.17 0.22 0.19 0.19 0.08 0
Soil property
0.38 0.36 0.15 0.02 0.05 0.02 0 0.02
Vegetation Coverage
0.34 0.25 0.23 0.11 0.07 0 0 0
Flow 0.30 0.25 0.24 0.12 0.06 0 0 0
Fracture 0.36 0.20 0.15 0.13 0.11 0.05 0 0
The occurrence frequencies reflect the number of landslide
reports, and output data were set as the summary of different
factor frequencies (3).
n
X
X
X
Z
1
2
(3)Where Xn is quantitative value from every factor; n is the
number of factors. Z for the ANN trainings would be
normalized between 0 and 1.
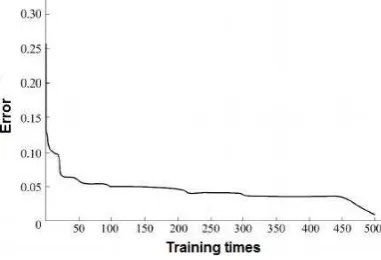
4.3 LS mapping and analysis
values were selected from 1,200 landslide records, and the
summary of different frequencies every sample were
considered as the output data. The number of neurons of hidden
layer is more than twice the input data. The structure of Neural
network is “9-18-1”. The BP learning algorithm, with network
training error of 10-6, and 500 times of training (Figure 2), was
implemented to train various ANN architectures.
Figure 2. Error and training times of ANN
Some landslide test data were from worldwide authoritative
website (United States Geological Survey (USGS),
http://landslides.usgs.gov/recent; EM-DAT International
Disaster Database, http://www.em-dat.net/; International
Consortium on Landslides Website (ICL), http://iclhq.org/).
Gathering 100 landslide test data, the accuracy of the network
is about 82.31%. The output data were considered to express
the LS index values of pixels. The higher the value of LS, the
more susceptible is that pixel to the occurrence frequencies of
landslide. Based on the 1km×1km grid, the LS map of China is
then produced by ANN learning and multiplying the weighted
factor layers (Figure 3).
Figure 3. LS map of China based on multi-factors
From the figure can clearly see that the southwest of China has
higher susceptibility index than other areas, which also could
be consistent with landslide reports from news. Meanwhile, the
rainfall data from TRMM satellite can be used to predict the
landslide area by overlaying the LS map.
5. CONCLUSIONS
The most prominent features of landslide include information
diversity, fuzziness, uncertainty and randomness, which bring
great difficult for information processing. The processing
ability of traditional ways and methods is limited, and may
cause a lot of useful information losses, result in the degree of
reliability reducing. With the strong nonlinear mapping
capability, can simulate the possibility of the landslide and the
relationship of complex factors (Chacón et al, 2006).
A landslide susceptibility model has been developed for the
whole country applying a scoring system with a set of relevant
factors based on BP ANN, merging nonlinear elements by
qualitative and quantitative indices. The result has been tested
by the data of worldwide authoritative website, and the
accuracy of the network is about 82.31% to meet landslide
study requirements. The high susceptibility parts mainly in the
southwest of China, characterized by the presence of
landslide-prone sedimentary rocks, high seismicity, frequent
severe earthquake and rainfall events and significant human
activities in this area.
The landslide susceptibility evaluation and mapping of China
generated in this study constitutes a preliminary step for further
more detailed susceptibility and hazard research, as well as a
useful method for risk assessment, and provides theoretical
basis for prediction and forecast of landslide disasters
throughout China.
Acknowledgements
The work described in this paper was supported by National
Basic Research Program of China˄2012CB957702˅and
Innovation Program of Shanghai Municipal Education
Commission(Project ID:10ZZ25) , and also supported by the
Centre of Spatial Information Science and Sustainable
Development, Tongji University.
References
Henderson L J. Emergency and disaster: pervasive risk and
pubic bureaucracy in developing nations [J]. Pubic
Organization Review: A Global Journal, 2004, 4: 103-119.
Kirschbaum D B, Adler R, Hong Y, et al. A global landslide
catalog for hazard applications: method, results, and limitations
Zhou, P., Zhou, B., Guo, J., et al. 2005. A demonstrative
GPS-aided automatic landslide monitoring system in Sichuan
Province. Journal of Global Positioning Systems. 4(1-2),
pp.184-191.
Parry S. Chapter Fifteen- The application of geomorphological
mapping in the assessment of landslide hazard in Hong Kong.
Developments in Earth Surface Processes, 2011, 15: 413-441.
Mathew J, Jha V K, Rawat G S. Landslide susceptibility
zonation mapping and its validation in part of Garhwal Lesser
Himalaya, India, using binary logistic regression analysis and
receiver operating characteristic curve method. Landslides.
2008, 6(1): 17-26.
Ercanoglu M. An overview on the landslide susceptibility
assessment techniques. 1st WSEAS International Conference on
ENVIRONMENTAL and GEOLOGICAL SCINENCE and
ENGINEERING. 2008, Valletta, Malta.
Chauhan S, Sharma M, Arora M K, et al. Landslide
susceptibility zonation through ratings derived from artificial
neural network. International Journal of Applied Earth
Observation and Geoinformation. 2010, 12(5): 340-350.
Pradhan, B. 2011. Use of GIS-based fuzzy logic relations and
its cross application to produce landslide susceptibility maps in
three test areas in Malaysia. Environmental Earth Sciences, 63,
pp.329-349.
He, K. Q., Li, X. R., Yan, X. Q. 2008. The landslides in the
three gorges reservoir region, China and the effects of water
storage and rain on their stability. Environmental Geology.
55(1), pp.55-63.
Wu. W, Sidle, R. C. 1995. A distributed slope stability model
for steep forested watersheds. Water Resources Research, 31(8),
pp.2097-2110.
Kumar K, Devrani R, Mathur S. Landslide hazard potential
analysis using GIS, Patalganga Valley, Garhwal, western
Himalayan region of India. European Journal of Scientific
Research. 2010, 45(3): 346-366.
Dai, F. C., Lee, F. C., Ngai,Y. Y. 2002. Landslide risk
assessment and management: an overview. Engineering
Geology.64(1), pp.65-87.
Montgomery D R, Dietrich W E, Heffner J T. Piezometric
response in shallow bedrock at CB1: implications for runoff
generation and landsliding. Water Resources Research. 2002,
38(12): 1274-1292.
Gong, P. 1996. Integrated analysis of spatial data for multiple
sources: using evidential reasoning and artificial neural
network techniques for geological mapping. Photogrammetric
Engineering & Remote Sensing. 62, pp.513-523.
Chacón, J., Irigaray, C., Fernández, T. 2006. Engineering
geology maps: landslides and geographical information
systems. Bulletin of Engineering Geology and the Environment.