CHANGE DETECTION IN A TOPOGRAPHIC BUILDING DATABASE USING
SUBMETRIC SATELLITE IMAGES
Arnaud Le Brisaand Nesrine Chehataa,b a
Universit´e Paris-Est, IGN, Laboratoire MATIS 73 Avenue de Paris, 94165 SAINT-MANDE Cedex, FRANCE
arnaud.le-bris@ign.fr http://recherche.ign.fr/labos/matis/ bG&E Laboratory, ENSEGID, Bordeaux University 1 All´ee F. Daguin, 33607 PESSAC Cedex, FRANCE
nesrine.chehata@egid.u-bordeaux3.fr
KEY WORDS:Image classification - Land cover extraction - Data fusion - Change detection - Satellite - DSM
ABSTRACT:
Submetric satellite imagery (Pleiades, GeoEye) offers advantages for map update purposes, e.g. an interesting ground resolution, a good reactivity and the ability to capture wide areas. Experiments on the use of such stereoscopic images for 2D change detection among building objects of GIS topographic database are presented in this paper. Two approaches have been tested. The first one extracts land cover from satellite ortho-images and additional information (correlation DSM-DTM, database) and compares building objects of this classification to those of the database. The second one creates a pseudo-DSM from height information of database building objects combined with a DTM and compares it to a correlation DSM computed from satellite images. Obtained results are quite encouraging even if the correctness rate remains too low for an operational use.
1 INTRODUCTION
Nowadays, most mapping agencies have finished the initial plot-ting of their topographic (2D or 2.5D) databases. Therefore, up-dating methods have become an important issue. Manual change detection is indeed costly and very long for agencies. Besides, it is a difficult and quite boring task for operators. In some mapping agencies, processes have been settled to catch information about changes from local authorities, giving good results for some themes such as roads, but being sometimes not sufficient for other ones such as buildings, especially in very changing areas. Therefore, there is a growing need for (semi-)automatic tools launching alarms (where change hypotheses are detected) and sending them to be checked by an operator. Such tools should be very exhaustive and as correct as possible (i.e. minimizing the false detection rate). In this paper, change detection is focused onbuilding themeand only2D changesare sought (even if 3D information is used). Change detection has been studied for years using various sen-sors and testing different approaches. LIDAR data associated with very high resolution (10-20cm) aerial images is often used as input data ( (Rottensteiner, 2007, Matikainen et al., 2010)). (Poulain et al., 2009) use radar data associated with optic im-agery. In the present paper, submetric satellite imagery (Pleiades, GeoEye) is used. Such sensors offer indeed advantages for database updating purposes, since they have an interesting ground resolu-tion, a good reactivity and the ability to capture wide areas. Nev-ertheless, such data is less easy to use than very high resolution lidar data or aerial images : some smaller details can indeed be missed.
Among various approaches presented in literature, some consist-ing in comparconsist-ing new images to old ones can be cited (Radke et al., 2005), but seem difficult to use in this special context. Many other approaches compare DSMs calculated at both dates. Other ones extract primitives from new data and compare them to the database to update ( (Poulain et al., 2009, Champion et al., 2010)). (Bouziani et al., 2010) also use context information. The goal here is to obtain alarms on changed building parts, to be checked by operators. Therefore, as the point is to detect new or
demolished pixels, there is no need to discriminate between new, demolished and modified buildings (since a modified, bad plot-ted or misregistered building has “new” or “demolished” parts...). Two distinct approaches are used.
The first one extracts land cover from satellite (ortho-)images and additional information (database, DSM-DTM when available...) owing to a supervised per region classification process trained by database buildings and road objects. Unlike (Rottensteiner, 2007, Olsen and Knudsen, 2005), a radiometric model is trained from data and not onlyndviis used as radiometric information. Some buildings have indeed specific colours (e.g. white or bright red) not found in other classes, even if building theme remains difficult to model because of the variety of roofing materials. Un-like (Matikainen et al., 2010) (who uses lidar data), segmenta-tion is computed from image and not from DSM, because DSMs calculated from satellite stereoscopic images often remain quite noisy with not well delineated object borders, whereas image of-fers more accurate contours.
The second approach is based on interdate DSMs comparison. The DSM generated from the new satellites images is compared to a “pseudo-DSM” calculated from a DTM and height informa-tion of database building objects. Finally alarms obtained from these two methods are merged.
2 DATA SETS AND MATERIALS
Experiments were carried out on two test zones located near Toulouse (France) and an other zone in La R´eunion, with different data.
2.1 Toulouse “CHU” and “highway” areas
“CHU” area is a mixed urban - rural area, covering almost 1.5 km2. A hill is present. Different kinds of buildings are present on
this area, with big buildings (a school and a hospital) and individ-ual houses (almost 230 buildings). Vegetation is quite important too, consisting of woods and fields.
“Highway” area is an urban area, covering almost 1 km2. The ground is quite flat. It is mostly a residential suburb consisting of houses (almost 1200 buildings). Several more large buildings are present too. Road network is important, with a motorway, a cloverleaf intersection and bridges. There is less vegetation than in “CHU” test area. This is a “urban” vegetation consisting of trees (on the border of the streets or in gardens) and of lawns (in gardens, stadiums and squares).
Simulated Pleiades imagery (CNES, 2011) Tri-stereoscopic four bands (red - green - blue - near infrared) Pleiades simulated images are available for these regions. A 50cm ground resolution DSM has been calculated from the Pleiades images thanks to the automatic correlation tool described in (Pierrot-Deseilligny and Paparoditis, 2006). 50cm resolution true ortho-images have then been derived from the simulated Pleiades images and are used in the process.
“Reference” vector database is a detailed building and road topographic database plotted for Pleiades studies, with one object per building, and it also offers an accurate height information for building objects.
ADTMfrom IGN’s national DTM database is used. It is a 25m ground resolution one.
2.2 “La R´eunion” test area
This is also a mixed urban - rural area, covering almost 1.5 km2.
Relief is stronger there. Different kinds of buildings are present, with “industrial” buildings and individual houses. Nevertheless, these houses are often low (only one level) and covered by more kinds of roofing materials (different colours) making classifica-tion task more difficult than for Toulouse areas. Vegetaclassifica-tion is quite important too, consisting of woods, fields and gardens. GeoEye-1 imagery (GeoEye, 2011) A stereoscopic pair of GeoEye-1 four bands (red-green-blue-near infrared) images is used. Both images were captured at one week apart. As for pre-vious test zones, a correlation DSM and a 50cm resolution true ortho-image have been calculated.
IGN’s “BDTopo” topographic vector database is the database to update here. It contains road and building themes, but building objects of this national reference database are more generalized than the ones of the “Reference” database used on Toulouse test areas. Moreover, a BDTopo building object may contain sev-eral individual buildings, especially in dense urban areas. This database also offers a height information for building objects. 791 building objects are present in this test area.
The usedDTMhas been generated from the correlation DSM using “elastic grid” tools described in (Champion et al., 2010).
3 DIFFICULTIES AND PROPOSED SOLUTIONS
Several difficulties are encountered. Some of them are classic ones related to land cover classification (as for instance areas belonging to distinct classes but looking like each other, shad-ows...). Other limits are more specific to the approach and to its change detection purpose (as the presence of partly hidden ob-jects, such as road section masked by trees or shadows). 3.1 Distinct classes with similar radiometry
Some distinct classes may have very similar radiometric distri-butions, making them very hard to be distinguished using only radiometric information.
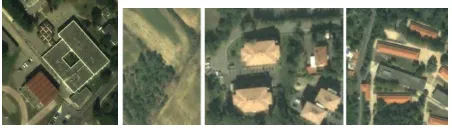
Roads and grey roofed buildings (fig. 1) have almost the same radiometric distribution for the four bands (red green -blue - near infrared) of the image. As a consequence, no derived channels from original image bands can really improve the dis-crimination between both classes. Unfortunately, the two themes “buildings” and “roads” are the most important themes to update in the database and have therefore not to be misclassified. Buildings covered by red tiles are sometimes misclassified with bare soilbelonging to fields or paths (fig. 1). These errors are a problem too, since “building” theme (which has to be updated) is concerned.
Figure 1: Radiometric information is not sufficient to distinguish classes with similar radiometry, such as grey roofed buildings from roads, or red tiles from bare soil.
Low and high vegetation areas are sometimes difficult to dis-tinguish from each other. Nevertheless, this is not a problem here since these classes don’t belong to the database to update. These possible misclassifications always concern high and low objects (buildings / roads ; buildings / bare soil ; high vegetation / low vegetation). As a consequence, using information about the distinction between ground and above-ground areas is a possible solution. In case of a stereoscopic image acquisition, such knowl-edge can be derived from difference between DTM and correla-tion DSM and can be introduced into the classificacorrela-tion process. To some extent, shadows could also be used to obtain such infor-mation.
3.2 Mixed classes and intra-class radiometric variations
Building objects can appear very different from each other on the image, since they are not covered by the same roofing ma-terial. Thus, they can not be described by a common radiomet-ric model. Therefore, “building” class has to be considered as a mixed class and divided into “red roofed”, “grey roofed” and “white roofed” building subclasses. At the end of the classifica-tion, these 3 classes will be merged into a single class “building”. Moreover, radiometry can greatly vary inside one class because of several factors such as the link between the orientation of an object and the sun illumination angle for “building” class, the density of cars or road marks in the streets for the theme “road”. As in 3.1, introducing additional knowledge (such as belong-ing to ground/above ground or information derived from the old database) in the classification process can help.
3.3 Higher elements and shadows
Objects can be partly masked on the image by elements belonging to other classes. For instance, roads are often masked by shadows or higher objects such as trees (see fig. 2).
Shadows are obviously important in urban areas. They mostly concern streets but roofs can also be partly masked by shadows caused by higher buildings or roof superstructures. Therefore, an additional class “shadow” is also defined in order to take shadows into account.
These two phenomenons have two consequences here :
First, classification results can be “exact” (according to the ortho-image) whereas ground truth land cover is false, leading to false change detection.
Second, database objects used as training data can be masked and thus provide false training set. Nevertheless, since the database is not up-to-date, false training data will necessarily be provided in our case... A solution to cope with this consists in a two-pass process, calculating a first model and a first classification from all training data, and then a second model and a second classi-fication from training data cleaned using the results of this first classification.
Figure 2: Road partly masked by trees and shadows.
3.4 Correlation DSM and shadows
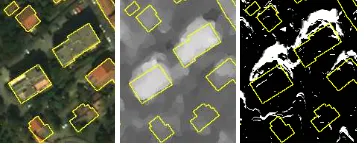
As shown in figure 3, heights of the DSM are often over esti-mated in shadow areas, leading to building false detection. As a consequence, detected shadow areas will be excluded from the change detection process, once the land cover classification will have been obtained.
Figure 3: Heights of the DSM often over estimated in shadows. (From left to right, ortho-image, DSM, shadow mask computed from DSM)
4 APPROACH “LAND COVER CLASSIFICATION”
This approach consists in extracting land cover (and thus build-ings) from satellite ortho-images and additional information us-ing a supervised classification method. Trainus-ing regions for build-ing and road classes can here be obtained directly from the database to update. The legend of the land cover classification consists of 8 classes : “red roofed buildings”, “grey roofed buildings”, “white roofed buildings”, “roads”, “high vegetation”, “low vegetation”, “bare soil” and “shadows”. Changes are then detected by com-paring detected buildings to database objects.
The input channels for the classification task are made up by a vegetation index“ndvi”(calculated from red and near infrared bands of the image), the“red”band and the“blue”band. 4.1 Classification algorithms
The ortho-image is first segmented into homogeneous regions. These regions are then classified through aMAPclassification al-gorithm taking into account additional knowledge as prior prob-abilities. The classification tool described in (Trias-Sanz, 2006) has been used for these experiments.
Model estimation from training data First, for each class, the best parameters of several statistical distributions (such as para-metric laws or histograms filtered by kernel density estimation...) are computed to fit to the radiometric n-dimensional histogram of the class (with n number of used channels). Then the best model is selected thanks to Bayes Information Criterion to find a com-promise between the fitting to data and the modelling complexity. Segmentation The image must be segmented into homogeneous land cover regions. This is achieved thanks to the multi-scale seg-mentation method described in (Guigues et al., 2006). A pyramid of segmentations of the image is first computed. Each level of this pyramid corresponds to an alternative between detail and gener-alization. This pyramid is then cut at a level empirically chosen to obtain a suitable image partition. The choice of this level is a compromise between desired details and the size of regions. On one hand, in an over segmentation, some regions will be too small to have meaning and are at risk to be misclassified whereas on the other hand, in a too coarse segmentation, large regions will con-tain different land cover items (such as grey roofed buildings and roads here).
Classification The segmented regions are then classified ac-cording to the probability model of the radiometry of the dif-ferent classes previously estimated. In the present case, aMAP
per region classification algorithm is used. Such a method al-lows to take easily into account external information (see 4.2) as prior probability. With this classification method, the labelco(R)
given to a regionRis its most probable class according to the ra-diometric model previously estimated and to prior probabilities. Hence,co(R)is the classcthat maximizes the following function
Q
i extern inf ormation source(Pi(c(R) =c)) ai
×
Q
pixel p∈RPradiometricmodel(I(p)|c(p) =c)
Card R1
with I(p) standing for the radiometry vector of pixel p, c(z)
meaning region or pixel “z’s class” andP(c(z) = c)standing for the probability for pixel or regionzto belong to classc. The aiterms stand for weight parameters balancing the different prior probability sources.
4.2 Additional information
As previously said, some external knowledge will be introduced into the classification process as prior probabilities to help to pre-vent misclassifications when radiometric information is not suffi-cient.
Knowledge from the database to update It can be assumed that land cover has mostly not changed since the last time the database was updated. Such information can be taken into ac-count as a prior probability that a pixel still belongs to the same class as in the database. Nevertheless, this information should be weighted slightly to avoid missing changes...
Ground / above ground information from nDSM Knowledge about the distinction between ground and above ground objects can be obtained from the difference nDSM between a DSM (in case of a stereoscopic acquisition of images) and a DTM. Such information helps to discriminate roads from grey roofed build-ings, and bare ground from some red roofed buildings.
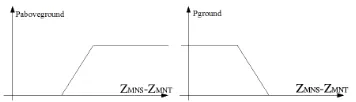
It is taken into account directly in the classification process as a prior probability to find the different classes according to the nDSM. Piecewise linear functions are used to model this rela-tion (as shown by figure 4). The parameters have been selected empirically (knowing the common heights of buildings and the “precision” of the nDSM).
Figure 4: Probability models to belong to above-ground (“build-ing”,“high vegetation”) (on the left) and to ground (“road”, “low vegetation”,“bare soil”) (on the right) according to nDSM.
Knowledge about shadows Prior information about the pres-ence of shadows can also be calculated if a DSM is available and if the capture time of images is known. Such information is use-ful to prevent some misclassifications between shadows and other dark objects. (A shadow mask can not be computed accurately and used directly since the correlation DSM calculated from the satellite images is quite noisy, as shown in part 3.4 and figure 3.) Ground / above ground information from shadows Very ap-proximate ground / above ground information for neighbouring regions of shadows can be derived from sun orientation (calcu-lated from image capture time) and a shadow mask obtained from a previous classification.
4.3 Change detection
In this study, as it is only aimed at launching an alarm when a change concerning building theme is detected, “change detec-tion” step is very simple : “new” and “demolished building parts” masks are computed by comparing the building mask ob-tained from land cover classification to the mask of the rasterized objects of the database.
An opening morphological operator is then applied to these masks in order to filter too fine objects. Other remaining small objects are eliminated if their area is lower than a given threshold. An alarm is then launched (and checked by an operator) for each object (connected component) of these two masks. Grouping and generalizing these alarms are also possible (see part 6.2). 4.4 Practical use of this process
As previously said, the classification method is a supervised one and therefore requires training data. Training regions for building and road classes are here obtained directly from the database to update, but require pre-processing. (For other classes, a training set is captured by an operator.)
Classify buildings into sub-classes Experiments have shown that using three subclasses “red”, “grey” and “white roofed build-ings” instead of a single building class is necessary. However, no information concerning roofing material (and therefore roof colour) is associated to BDTopo building objects whereas such knowledge is necessary to use database objects as training data. Nevertheless this information can be obtained from image data. Every pixelpof the ortho-image belonging to a building object of the database is thus classified as “red”, “grey” or “white” using the following scheme :
xxif p.bluep.red > thresholdredV Sgrey whitethenpis “red”
xxelse ifp.red > thresholdgreyV Swhitethenpis “white”
xxelsepis “grey”endif.
Clean training data As already said in 3.4, roads and building objects often appear partly masked by higher objects (trees) or shadows on the image. Besides, database is quite generalized and therefore a database object can include few parts of neighbouring objects. Therefore, these training regions are quite “dirty”. In order to cope with this, the classification is performed in a two pass scheme :
1. Ortho-image is classified according to a model estimated from the rough database without any special care.
2. Training data is cleaned using vegetation and shadow areas masks obtained from this first classification. A new model is then estimated and a new classification is performed.
5 APPROACH “INTERDATE DSM COMPARISON”
This approach consists in comparing a DSM computed from stereo-scopic satellite images (at datet2) to a DSM describing the land-scape at time (t1) when the database was last updated. That is to say, their differencedDSMis studied, since new building parts correspond to zones whereZDSMt2 > ZDSMt1, whereas
de-molished ones correspond toZDSMt2< ZDSMt1. (Besides this
measuredDSMcould also be a confidence measure associated to each detected change.) Nevertheless, other information (such as a vegetation mask obtained at datet2from previous classifica-tion of new images) must be taken into account to prevent false alarms. The tested algorithm is described below :
for eachpixelpdo
xxdDSM(p) =ZDSMt2(p)−ZDSMt1(p)
xxifdDSM(p)< thdemolishedandp∈ {building object of the
xxdatabase}then
xxxxp∈ {demolished building parts}
xxelse ifdDSM(p)> thnewandpnot classed among shadows
xxand vegetationthen
xxxxifp∈ {building object of the database}then
xxxxxxNo “2D” change
xxxxelse
xxxxxxp∈ {new building parts} xxxxendif
xxendif endfor
Perform morphological opening of “demolished building parts” and “new building parts” masks and eliminate too small remain-ing elements (connected components) (area < threshold) of these masks.
In the present study, as no old DSM was available, a “pseudo-DSM” has been generated from a DTM and from height attributes of database building objects, in order to describe landscape at the time the database was last updated.
6 USE ALARMS
6.1 Merge alarms
Results obtained by both approaches are merged in a very sim-ple way. First, intersection and union masks of alarms launched by both approaches are computed. Secondly, too small elements of the intersection mask are deleted. Lastly, objects of the union mask are deleted if they don’t contain an object of the intersec-tion mask.
This simple method is a way to reduce the number of alarms to check. It improves the correctness rate, butrequires a high com-pletenessfor alarms launched by the both approaches. It could be extended to a more general scheme giving confidence weights to different alarms sources (and even associating confidence scores to each alarm). This method is a way to obtain a mask of alarms but also a confidence score related to the recurrence of alarms and to belief given to the different sources of alarms.
Besides, as some existing methods work at building level (such as (Rottensteiner, 2007) or (Champion et al., 2010)), alarms could be associated to a building (new, demolished or modified) and a International Archives of the Photogrammetry, Remote Sensing and Spatial Information Sciences, Volume XXXVIII-3/W22, 2011
confidence score computed for each building (using the scheme presented above), making it possible to sort alarms from the most to the least plausible.
6.2 Group/generalize alarms
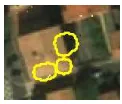
Group/generalize alarms is an other way to get less alarms to check. Alarms located in a same neighbourhood are grouped into a single object. These patterns are then submitted to an operator to be checked. This alarm generalization (artificially) improves correctness rate without damaging completeness rate, especially in cases such as the one illustrated by figure 5, where a smaller amount of more global alarms can then be submitted to operators.
Figure 5: Group neighbouring alarms is a way to obtain less alarms to check (especially in cases like this one...)
7 TESTS AND RESULTS
Results are presented and commented for both datasets. Com-pleteness and correctness rates are presented in tables 1 and 2. Concerning computing time, processing the whole chain takes almost 1 h/km2.
7.1 Toulouse
As available database was assumed to be up-to-date, simulated changes consisting in adding or deleting buildings in the database were performed in order to be able to easily evaluate change de-tection results. But it appeared that there were true changes and bad plotted or misregistered buildings. As a consequence, the correctness rate has been computed as the ratio of “manually” validated alarms compared to the number of launched alarms, whereas the completeness rate has been calculated as the ratio of detected simulated changes among the simulated changes. Furthermore, as database objects are quite generalized, it is some-times not easy to decide whether an alarm corresponds to a true change (or a bad modelled object) and must be validated. Approach “land cover classification” For first tests, a mono-scopic acquisition case was assumed. Therefore, no DSM (and therefore no information concerning ground or overground) was available. White roofed buildings have been well detected, while grey roofed buildings and roads have very often been misclassi-fied. Confusion has also occurred between red roofed buildings and bare soil without this knowledge.
A stereoscopic acquisition was assumed for other tests. It has then been showed that the results are greatly improved by the use of nDSM derived knowledge concerning ground/overground. Some results are presented in tables 1 and 2. (They have been ob-tained taking into account radiometric model, nDSM knowledge (weighted with 0.75 and 0.25 respectively).
Approach “DSM comparison”Obtained results are good. Merge resultsMerge alarms hugely improves the correctness rate for these areas, without damaging the completeness rate, thanks to the high completeness of both approaches here. Conclusion Interesting results have been obtained, but it must be kept in mind that Toulouse test areas remain quite simple ones since there are few classes (mostly red roofs, no water areas or dark slate roofs for instance) and relief is not very strong... Be-sides, used databases were high quality ones.
7.2 La R´eunion
BDTopo database has recently been updated by IGN operators in this area. Therefore, the old database and the modifications plotted by operators were available. Nevertheless, as for Toulouse test zones, some few errors were also detected on a small area, showing that change detection remains a difficult task and that may be not perfect even when processed by operators, as shown in figure 6.
Obtained results (presented in tables 1 and 2) on this area are not as good as the ones obtained for Toulouse test zones, but this can be explained by several reasons. First, the correlation DSM is quite noisy : indeed it has been generated from images not cap-tured at the same date (but at one week apart with a low BH ratio 0.39). Furthermore, it has been computed from already pansharp-ened colour images, and not directly from original (high resolu-tion) panchromatic images. Besides, roofing materials are often metallic ones leading to specular reflectance and saturated pixels. Secondly, many buildings are very low (only one level) and are therefore difficult to detect as above ground objects in the nDSM : they are lost among noise of the nDSM, whereas this ground/above-ground knowledge was a key factor for a good building detection on Toulouse test zones. Furthermore, relief is also stronger. Last, roofing materials are different and more various than in Toulouse. Furthermore, some buildings appear almost as dark as shadows or roads on satellite images (but not on available older aerial ortho-images on which they are easier to distinguish. It must here be said that these GeoEye-1 images have also a quite different radiometry from Pleiades simulated ones). These build-ings are thus often missed leading to many false positives for de-molished objects and to true negatives for new objects.
All these phenomenons have effects on both approaches “land cover classification” and “DSM comparison”, requiring to mod-ify some parameters (thresholds for colour classification of build-ings, and parameters of ground/above ground according to nDSM). The completeness rate is not so low, even though many dark roofed buildings are missed. The correctness is not so bad, but it must be kept in mind that the number of launched alarms is im-portant (up to 687). Concerning demolished buildings, the cor-rectness rate is very weak (almost 2%) while too many (mostly false) alarms (353) have been launched for an operational use. Conclusion La R´eunion is a difficult test compared to Toulouse (both concerning available data and landscape), and obtained re-sults are not so good. Nevertheless, it must be kept in mind that this landscape is quite different (low buildings) from the main part of the French territory.
8 CONCLUSION
Automatic change detection from satellite images remains a diffi-cult task. Nevertheless, although they are still not suitable for an operational use, obtained results remain encouraging, consider-ing input data. A very good completeness rate is indeed reached for Toulouse test areas (almost 100%), while still “interesting” one (almost 75%) is obtained for La R´eunion (since it revealed that some true changes have been missed by operators on a very small area).
One important limit for an operational use is the bad correctness rate (<30%): too many false alarms are launched. Nevertheless, this can be improved by generalizing alarms, submitting to val-idation patterns of alarms instead of isolated alarms (such as on figure 5). Thus, the correctness rate increases while completeness rate remains similar. (Using a 10 meter radius neighbourhood to group patterns of alarms, the correctness rate increased from 48% International Archives of the Photogrammetry, Remote Sensing and Spatial Information Sciences, Volume XXXVIII-3/W22, 2011
Table 1: Completeness rates for approaches “classif” (land cover classification), “dDSM” (interdate DSM comparison), and “merged” (merged alarms of both methods). Number of simu-lated (new/demolished) objects is given in the second column.
area nb simul classif dDSM merged New buildings
Highway 30 97% 93% 93%
CHU 10 100% 100% 100%
R´eunion 251 80% 74% 71%
Demolished buildings
Highway 5 100% 100% 100%
CHU 7 100% 100% 100%
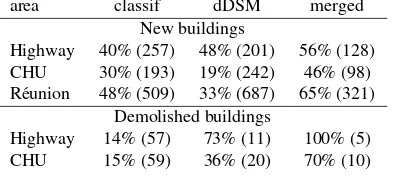
Table 2: Correctness rates for approaches “classif”, “dDSM” and “merged” alarms.
area classif dDSM merged
New buildings
Highway 40% (257) 48% (201) 56% (128) CHU 30% (193) 19% (242) 46% (98) R´eunion 48% (509) 33% (687) 65% (321)
Demolished buildings
Highway 14% (57) 73% (11) 100% (5) CHU 15% (59) 36% (20) 70% (10)
to 52% in La R´eunion test area.)
An other possible solution consists in merging results obtained by this approach with results obtained from other methods such as (Champion et al., 2010) for instance : confidence indices can then be calculated for each alarm and only the most relevant ones would be submitted to validation. Other sources such as crowd-sourcing could be used too.
Completeness seems to be a very important point too since it is important to be exhaustive, to be sure not to miss changes. Nevertheless, this criterion could become less important in case of a more important image acquisition frequency. Intermediate satellite images could now be acquired between two consecutive (4 years apart) aerial images acquisition campaigns. Therefore, there would be less time to treat them and some (semi-)automatic change detection tools would become necessary to cope with such amount of data. As a consequence, completeness would become less important than nowadays, since even if change detection was not perfect but sufficiently good for these intermediate images, some few changes would be missed by (semi-)automatic tools whereas they would be detected afterwards when a complete in-vestigation would be performed on aerial images by an operator two years later. Investigation by operators remains indeed neces-sary, since this is the only way for the moment to detect changes for some other themes than buildings and roads. However, pre-sented automatic tools could help change detection or database verification, even though they still need “manual” investigation. Interesting results have been obtained but more experiments re-main necessary, for instance to know the robustness to parameters and to different kinds of landscape, e.g. with additional themes such as water or slate (dark blue) roofed buildings. An other im-portant point has been shown : even the first approach remains de-pendent on “sufficiently good” 3D information (that is to say on the correlation DSM) to be able to discriminate between ground and above ground classes with quite similar radiometry and thus requires stereoscopic acquisition.
ACKNOWLEDGEMENTS
This work was partly financed by CNES. The authors would also like to thank M. Durupt and X. Maranzana for their help espe-cially during data preparation.
Figure 6: Change detection example in La R´eunion. Old database is drawn in magenta. On the left, modifications (in green) plotted by IGN operators. On the right, launched alarms (in green) for detected “new building parts” by the “land cover classification” approach.
REFERENCES
Bouziani, M., Go¨ıta, K. and He, D.-C., 2010. Automatic change detection of buildings in urban environment from very high spatial resolution images using existing geodatabase and prior knowledge. ISPRS Journal of Photogrammetry and Remote Sensing 65, pp. 143–153.
Champion, N., Boldo, D., Pierrot-Deseilligny, M. and Stamon, G., 2010. 2D building change detection from high resolution satellite imagery : A two-step hierarchical method based on 3D invariant primitives. Pattern Recognition Letters 31, pp. 1138– 1147.
CNES, 2011. Pleiades. http://smsc.cnes.fr/PLEIADES/index.htm.
GeoEye, 2011. About GeoEye-1.
http://launch.geoeye.com/LaunchSite/about/.
Guigues, L., Cocquerez, J.-P. and Le Men, H., 2006. Scale sets image analysis. International Journal of Computer Vision 68(3), pp. 289–317.
Matikainen, L., Hyypp¨a, J., Ahokas, E., Markelin, L. and Kaarti-nen, H., 2010. Automatic detection of buildings and changes in buildings for updating of maps. Remote Sensing 2(5), pp. 1217– 1248.
Olsen, V. and Knudsen, J., 2005. Automated change detection for validation and update of geodata. In: Proceedings of 6th Ge-omatic Week, Barcelone, Spain.
Pierrot-Deseilligny, M. and Paparoditis, N., 2006. A multireso-lution and optimization-based image matching approach: An ap-plication to surface reconstruction from SPOT5-HRS stereo im-agery. In: International Archives of the Photogrammetry, Re-mote Sensing and Spatial Information Sciences (IAPRS), Vol. 36 (1/W41), Ankara, Turkey.
Poulain, V., Inglada, J., Spigai, M., Tourneret, J.-Y. and Marthon, P., 2009. Fusion of high resolution optical and SAR images with vector data bases for change detection. In: IEEE International Geoscience and Remote Sensing Symposium, Cape Town, South Africa.
Radke, R., Andra, S., Al-Kofahi, O. and Roysam, B., 2005. Im-age change detection algorithms: A systematic survey. IEEE Transactions on image processing 14(3), pp. 294–307.
Rottensteiner, F., 2007. Building change detection from digi-tal surface models and multi-spectral images. In: International Archives of the Photogrammetry, Remote Sensing and Spatial Information Sciences (IAPRS), Vol. 36 (3/W49B), Munich, Ger-many.
Trias-Sanz, R., 2006. Semi-automatic high-resolution rural land cover classification. PhD thesis, Universit´e Paris 5, Paris, France. International Archives of the Photogrammetry, Remote Sensing and Spatial Information Sciences, Volume XXXVIII-3/W22, 2011