IMPROVEMENT OF THERMAL ESTIMATION AT LAND COVER BOUNDARY BY
USING QUANTILE
Tsukasa Hosomura
Division of Information System Design, School of Science and Engineering,
Tokyo Denki University, Hatoyama, Hiki, Saitama, 350-0394, Japan
Commission VIII/8
KEY WORDS: Statistics, High Resolution, Classification, Infrared, Accuracy Analysis, Urban, Data Analysis
ABSTRACT:
Land cover classification was conducted for Landsat ETM image of Urmqi. Maximum likelihood classification algorism was used for
this purpose. Classification classes were urban, water body, forest, soil, bare ground1, bare ground2, vegetation1, vegetation2 and
vegetation3. Mask image of each land cover was created from the obtained classification image. Thermal band image of each land
cover was extracted by using the mask image. In general, mean value and standard deviation are calculated for the thermal band
image. However, these values were affected by the difference of ground resolution. In this study, we introduced quantiles to avoid this
problem. Quantiles are points taken at regular intervals from the cumulative distribution function. Quantiles showed the effectiveness
of decreasing the error caused from the difference of ground resolution.
1. INTRODUCTION
The air temperature at the city center is higher than that of
the surrounding non-urban areas so that it looks like an
island. This phenomenon is so called “Urban Heat Island”.
In early days, it has attracted attentions as an environmental
problem unique to urban area. The investigation area of
Urmqi, which is the regional capital of Xinjiang Uyghr
Autonomous Region in the dry northwestern part of China,
has gained rapid development in recent decades. Together
with economic development, the landscape has changed
significantly. Land use/cover change has significant impacts
on regional environment. Land surface temperature is an
important indicator for assessment of regional environment
especially in big cities such as Urumqi where urban heat
island can usually be relatively obvious.
In this study we aim at specifying the urban expansion
characteristics of Urmqi City using Landsat ETM images to
detect and evaluate the land use and land cover change and
analyze the relationship between land use and heat
environment of Urmqi city.
Land cover classification was conducted for Landsat ETM
image of Urmqi. Thermal band image of each land cover
was extracted by using the mask image. In general, mean
value and standard deviation are used for statistic analysis.
However, difference of ground resolution between thermal
infrared image and other band image influence these
statistic variables. In this study, we introduced quantiles to
avoid this problem.
2. CONCEPT OF QUANTILE
Quantiles are points taken at regular intervals from the
cumulative distribution function. Quantiles showed the
effectiveness of decreasing the error caused from the
difference of ground resolution. The median is the central
value of the distribution, such that half the points are less
than or equal to it and half are larger than or equal to it. The
quantiles divide the distribution into four equal parts, called
fourths. The second quantile is the median.The interquartile
range corresponds to the distance between the first quantile
and the third quantile.
3. THERMAL BAND DATA ANALYSIS
In order to analyze relationship between land cover and heat International Archives of the Photogrammetry, Remote Sensing and Spatial Information Sciences, Volume XXXIX-B8, 2012
XXII ISPRS Congress, 25 August – 01 September 2012, Melbourne, Australia
island we have used maximum likelihood classification
method. We calculated the statistic values of digital count
number for the thermal image corresponding to each class.
3.1 Image Classification
We used maximum likelihood classification method in
classifying the Landsat satellite image of the subject area
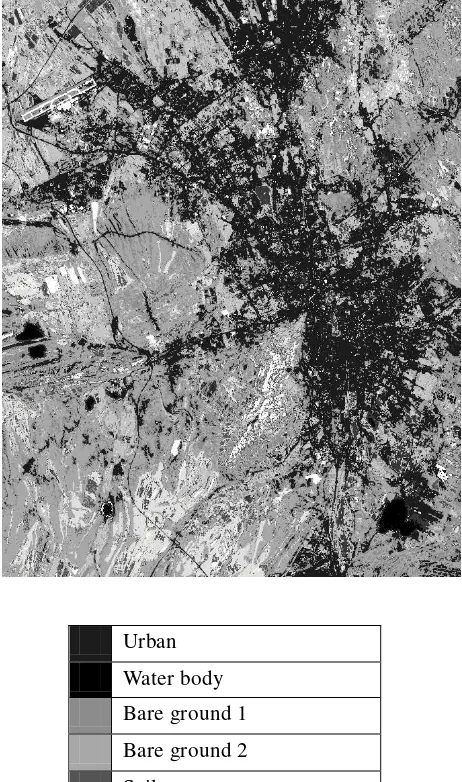
Urmqi shown in Figure 1 and divided it into 9classes as of
urban area, water body, forest, soil, bare ground1, bare
ground2, vegetation1, vegetation2 and vegetation3 shown in
Figure 2. Mask images were created from the classified
image in order to calculate some statistical values. Mean
value and standard deviation (S.D.) were calculated for the
masked image. The obtained result is shown in Table 1.
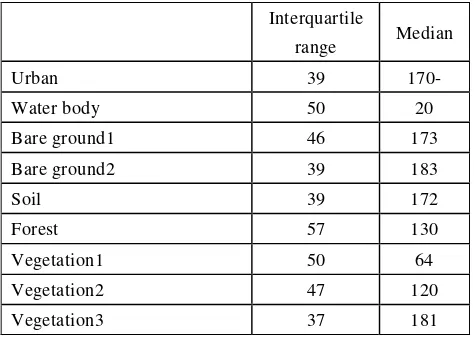
Median and interquartile range were also calculated. The
obtained result is shown in Table 2.
Figure 1 Landsat ETM image for Urmqi.
Figure 2 Classified image for target area.
Urban
Water body
Bare ground 1
Bare ground 2
Soil
Forest
Vegetation 1
Vegetation 2
Vegetation 3
International Archives of the Photogrammetry, Remote Sensing and Spatial Information Sciences, Volume XXXIX-B8, 2012 XXII ISPRS Congress, 25 August – 01 September 2012, Melbourne, Australia
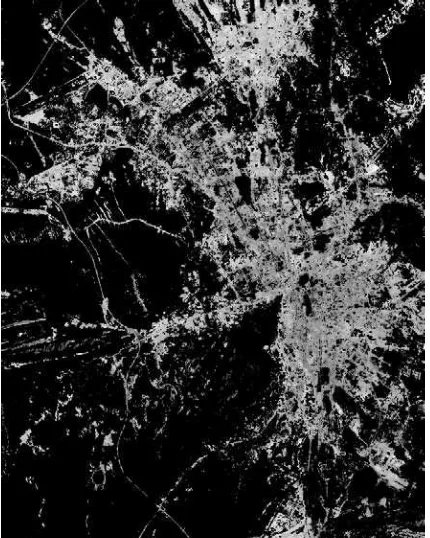
Figure 3 Thermal band image of Urmqi.
Based on the values of digital count number for the thermal
image shown in Figure 3 corresponding to each class, We
have seen that the temperature of urban area was higher
than that of vegetation area.
Figure 4 Mask image of urban area.
Figure 5 Histogram of urban area.
Table 1 Mean value and S.D. of thermal band data.
We can understand from the mean value on Table1 that the
urban area temperature is higher than Vegetation area
temperature. The high temperature of the urban area is
mainly caused by the characteristic of urban surface. As
cities and roads, buildings, and industrial areas, temperature
in the city is relatively higher compared with their rural
surroundings creating a heat island. In similar way, the
temperature in other areas is also very high because of the
strong bare soiled radiance. We can easily find out that the
standard deviation values for forest area are very high
because the forests have sunny sides as well as shadow
sides. These sides temperatures fluctuate is considerably
difference so the standard deviation values for forests area
are very high.
The standard deviation value of water body is higher than
S.D. Mean
value
Urban 31.2 167.8
Water body 34.9 36.8
Bare ground 1 35.0 170.3
Bare ground 2 33.2 182.0
Soil 33.0 169.1
Forest 42.5 126.9
Vegetation 1 36.7 72.2
Vegetation 2 34.8 119.1
Vegetation 3 30.9 179.3
International Archives of the Photogrammetry, Remote Sensing and Spatial Information Sciences, Volume XXXIX-B8, 2012 XXII ISPRS Congress, 25 August – 01 September 2012, Melbourne, Australia
estimated value. Pixel values of water body are very low
and almost same. The standard deviation of water body
should be low value. But obtain result shows large standard
deviation value for water body. Such situation may be
caused the boundary of water area which included other
land cover. Ground resolution of thermal band image is 60m
x 60m. On the other hand ground resolution of other band
images are 30m x 30m. Boundary of water body includes
some other land cover pixels. The standard deviation was
affected from these pixel values. In order to avoid such
influence, we introduced quantiles. We used median and
interquartile range instead of mean value and standard
deviation.
Table 2 Median and interquartile range of thermal band
data.
By comparing two tables, we could get the result which
showed superiority of median and interquartile range for
accurate thermal environment. Interquartile range is around
twice of S.D.. Both median and interquartile range are
less than mean value and twice of S.D. in water body.
4. CONCLUSIONS
Urmuqi was selected for the target city in this study. Land
cover information was obtained from Landsat ETM image
by using classification algorithm. Quantile was introduced
for analyzing the thermal environment in the target area.
Obtained result showed the potential of more accurate
analysis by using quantile statistics.
References
[1] Imamu K., Hosomura, T, 2007. A Study On the
Interaction Between Urumqi Urban Land Use and Urban
Heat Island Using Remote Sensing Data. ACRS 2007 The
28th Asian Conference on Remote Sensing (12-16
November 2007)
International Archives of the Photogrammetry, Remote Sensing and Spatial Information Sciences, Volume XXXIX-B8, 2012 XXII ISPRS Congress, 25 August – 01 September 2012, Melbourne, Australia