USING THIRD PARTY DATA TO UPDATE A REFERENCE DATASET IN A QUALITY
EVALUATION SERVICE
E. M. A. Xavier a, b *, F. J. Ariza-López b, M. A. Ureña-Cámara b
a Brazilian Army Geographic Service, QGEx, 70630-901 Brasília, Brazil – (emerson)@dsg.eb.mil.br b
Dept. of Cartographic Engineering, Universidad de Jaén, 23071 Jaén, Spain – (fjariza, maurena)@ujaen.es
Commission IV, WG IV/1
KEY WORDS: data update, quality assessment, geospatial database, conflation, web service
ABSTRACT:
Nowadays it is easy to find many data sources for various regions around the globe. In this 'data overload' scenario there are few, if any, information available about the quality of these data sources. In order to easily provide these data quality information we presented the architecture of a web service for the automation of quality control of spatial datasets running over a Web Processing Service (WPS). For quality procedures that require an external reference dataset, like positional accuracy or completeness, the architecture permits using a reference dataset. However, this reference dataset is not ageless, since it suffers the natural time degradation inherent to geospatial features. In order to mitigate this problem we propose the Time Degradation & Updating Module which intends to apply assessed data as a tool to maintain the reference database updated. The main idea is to utilize datasets sent to the quality evaluation service as a source of 'candidate data elements' for the updating of the reference database. After the evaluation, if some elements of a candidate dataset reach a determined quality level, they can be used as input data to improve the current reference database. In this work we present the first design of the Time Degradation & Updating Module. We believe that the outcomes can be applied in the search of a full-automatic on-line quality evaluation platform.
1. INTRODUCTION
Today there are many geospatial data sources available. Space agencies and imaging companies launch new Earth observation satellites. Anyone can buy a drone with a camera in a supermarket. National mapping agencies release new products constantly. Thus, there are many data, however there are few quality information about these data. In this scenario we have presented a web service facing automatic quality assessment through web services (Xavier et al., 2015a). Though automatic, some quality evaluation procedures require an external dataset, the universe of discourse. Notwithstanding, this reference dataset experience the natural time degradation process which irredeemably decreases its quality along the time.
This paper discusses how to maintain the reference database up-to-dated. We need a solution that makes possible the utopic dataset proposed by Cooper and Peled (2001), a dataset that 'gets updated automatically, continuously and transparently to the user'. On other moment the authors called 'nirvana' these automatic, continuous, and transparent updates (Peled and Cooper, 2004).
We propose to utilize the datasets sent to the quality evaluation service as a source of candidate elements that should be applied to update the reference database. In our architecture this solution is named Time Degradation & Updating Module.
This approach is built over three concepts: rules, quarantine database, and conflation. The rules are based on quality assessment and are defined to specify who can update what, when and how. The quarantine database is used to store the candidate data elements before they can be fusioned with current reference database and also to store, if exists, elements of the current database that should be rejected. Lastly, the
conflation system executes the fusion between the new, updated data, and the remaining elements of the reference dataset.
This paper is structured as follows. Section 2 provides a brief explanation about temporal issues in geographic information systems (GIS), particularly models facing temporal change. Section 3 describes the first design of the Time Degradation & Updating Module. Section 4 presents some use cases in order to illustrate the theoretic solution. Lastly, section 5 brings some conclusions and future work.
2. BACKGROUND
Morris et al. (2000) argues that 'time' has been a thorn in GIS developers' flesh for a long time. Since the pioneer work of Basoglu and Morrison (1978) the integration of space and time remains an active research topic (Long and Nelson, 2013). Worboys (1994) claims that geospatial data have an 'inseparable' temporal component, i.e., systems that do not take into account the temporal component of spatial features are incomplete, limited systems.
Some authors defined methods to handle with temporal changing in geospatial features. In this direction, Langran and Chrisman (1988) presented two methods of representing geographic change: base map with overlays and space-time composite. In the first method the changes in spatial data should be registered as an overlay. So, the final map would be created by superimposing all changing overlays over the original base map. The second method, spatial-time composite, is a variation of the first one (overlays) and it is based on the study of Chrisman (1984). In this approach, each change implies in break of original object into two: the changed and the unchanged part with their own history.
Regarding land information systems, Price (1989) observed that a land parcel is an object with its own lifetime, so it is necessary to record the changes over time. The author proposed a method that keeps track of changes from creation to destruction.
Other authors investigated how to model temporal changes. Ramirez (1997) presented four possible situations for a feature along the time: (1) the feature is new; (2) the feature has not changed; (3) the feature has changed; and (4) the feature no longer exists. Lemarié and Badard (2001) presented six updating type that may occur in an updating process: creation, destruction, semantic modification, geometric modification, semantic and geometric modification, and aggregation. In a more recent work, Qi et al. (2010) developed a method for detecting changes between an updated larger-scale map and a to-be-updated map. In this method the authors describe six types of discrepancies that may occur when comparing those maps: (1) new addition (1:0); (2) disappearance (0:1); (3) alteration 1:n; (4) alteration n:1; (5) alteration m:n; and (6) alteration 1:1 (geometry and/or attribute).
In the field of spatial databases, Lee (2002) proposed a relational spatiotemporal data model which is able to handle spatial and temporal relationships into the select statement of Structured Query Language 3 (SQL3). This model includes new temporal operators like BEFORE and AFTER, and it also includes spatiotemporal operators like EQUALS and MEET.
In order to solve the issue of propagating an update, Wang et al. (2013) presented a new method based on matching and an object identifier named Unified Geographic Entity Code (UGEC). The use of unique identifiers for geospatial objects is also adopted by the Israeli mapping agency (Survey of Israel) (Felus et al. 2010), where it is called unique spatial identifier (SID). The SID is used in the management of updates and revisions of their databases.
There are some high level models to deal with spatiotemporal issues. Hornsby and Egenhofer (2000) introduced the change
In a previous work (Ariza-López et al., 2015) we presented the architecture of a web service for the automation of positional quality control of geospatial datasets. In other study we have demonstrated the feasibility of this solution for the case of positional accuracy (Xavier et al., 2015b). Our architecture foresees that the Data Access tier is able to mitigate the natural time degradation that occurs when the reference local data is getting old. In the proposed architecture, the Time degradation & updating module plays this role.
In this section we detail this module by presenting its concepts: a temporal evolution model for quality of geospatial objects, a changing model to quantify modifications, and the rules applied to maintain the reference database up-to-date.
Time degradation & updating module, or Update DB for short, also deals with conflation techniques by calling the Conflation module that effectively executes the merging of data. This last module is not detailed in this work.
3.1 Temporal evolution model
Ariza (2013) proposed a temporal evolution model for geospatial features based on the fact that the quality of geoinformation is valid for some period, since it is an ever-changing world. The main idea is that the quality Q in a time t1 is the quality in time t0 minus the quality degradation in this period (↓Q) plus some gain in quality by updating (↑Q), as show in equation (1).
Q(t1)=Q(t0)−↓Q(Δt)+↑Q(Δt) (1)
where the values Q, ↓Q, and ↑Q are expressed as a percentage.
The quality loss (↓Q) occurs naturally in the dataset, but in different manners for each type of object, like suggest the product specification of Ordnance Survey (2004). So this quality loss ↓Q can be quantified using the equation (2).
↓
Q
(
t
)=Δ
t
∑
e
ρ
e (2)where ρc is the quality loss rate for objects of data type e.
On the other hand, a quality improvement only occurs when an updating procedure is executed. These processes can occur in the whole dataset, or in some specific region, or these can reach all types of elements, or a subset of them. Moreover, this the elements of a data type, and de(t) represents the subset of objects in class e that can improve their quality (as percentage) in time t.
Hence the temporal evolution model can be summarized in the equation (4). This model is generic and it can be applied to any quality element, like completeness or positional accuracy.
Q(t1)=Q(t0)−Δt
∑
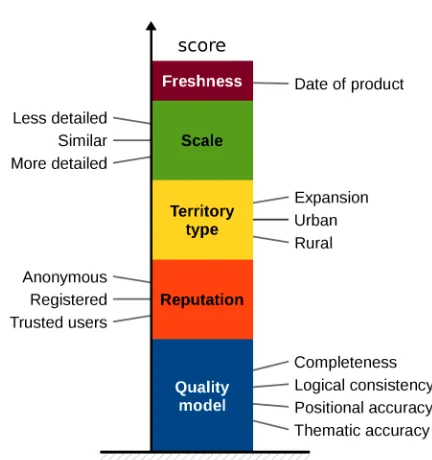
The Update DB module is built over three key-concepts: rules, quarantine DB, and conflation. In order to quantify if an object should change we have defined a changing model on top of six variables: type of change, quality model, users' reputation, territory type, date of product and scale of product.
• 1:0 changes: represents create or destroy objects in the reference DB;
• 1:1 changes: internal changes that occur with a single object. These are changing in the properties of an object, like a geometric and/or attribute change;
• m:n changes: these kind of change evolves combine or split objects, which can be common when using different scales.
We have developed a basic quality model to assess some quality elements that are relevant in updating tasks. This model is basic because it can be extended to accommodate other quality elements and measures. The model uses the concepts and measures from ISO 19157:2013 (ISO, 2013) and it is presented in Table 1. A dataset is considered valid if it is approved in two tests: format consistency and conceptual consistency. Otherwise it is considered invalid and cannot be used in the Update DB.
Category / Element Measure (identifier in ISO 19157)
Completeness
Commission rate of excess items (3) Omission rate of missing items (7) Logical consistency
Conceptual consistency conceptual schema non-compliance (8)
Domain consistency value domain non-conformance rate (18)
Format consistency physical structure conflicts (119) Topological consistency rate of self-intersect objects (16) rate of self-overlap objects (17) Positional accuracy
Absolute accuracy rate of positional uncertainties above a given threshold (31) Thematic accuracy
Non-quantitative attribute correctness
rate of incorrect attribute values (67)
Table 1. Basic quality model
The calculus of quality evaluation for changing objects depends on the considered type of change. For instance, if the object is considered a commission or an omission, the corresponding elements should not be used in the calculus of the quality evaluation for updating purposes. If the object is considered a positional error (a possible geometry change), the positional accuracy should not be considered; the same for thematic accuracy.
The users' reputation plays an important role in the system. The system decides in who it trust. The user's reputation is managed according some user groups:
• Anonymous users: the system permits anonymous users, so anyone can send a dataset to be evaluated. However, an anonymous dataset does not have any recognized reputation;
• Registered users: the registered users may receive more 'reputation' when their datasets get a valid evaluation;
• Trusted users: those users that have the higher level of trustworthiness.
The type of territory where occurs the changing/updating should also be considered. There are some regions more susceptible to change than another, as shown by some studies (Ordnance Survey, 2004). So, we can classify the regions according its susceptibility to change:
• Expansion areas: those areas under expansion, mainly the border of urban areas (high possibility of change);
• Urban: urban consolidated area (medium possibility of change);
• Rural: other areas (low possibility of change).
Some metadata elements about the assessed dataset can be used in the updating process. These are the date and scale of sent dataset. This information is optional.
After taking into account the presented six variables, we can draw our changing model. The changing of an object can be quantified by means of a 7-tuple structure: (refID, Cr, Ds, Gm, At, Cb, Sp). The first tuple (refID) represents the object's identifier in the reference database. The other tuples represent different values which indicate what should occur with the feature:
• Cr: indicates that the object should be created;
• Ds: indicates that the object should be destroyed;
• Gm: indicates that the object's geometry should be updated;
• At: indicates that the object's attributes should be updated;
• Cb: indicates that the object should be combined with other objects;
• Sp: indicates that the object should be split into other objects.
Each of these last six tuples has a 'score' that quantifies if it should change. The score is calculated for each object taking
into account the six variables: type of change, quality model, users' reputation, territory type, date of product and scale of product, as can be seen in Figure 1. This score is used in the updating rules described in next subsection.
3.3 Rules
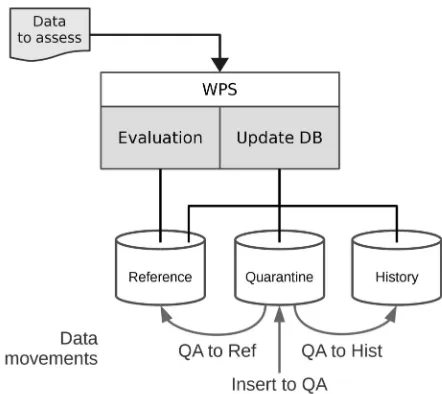
The rules define the possible 'movements' of data among three databases of the architecture: Reference (Ref), Quarantine (QA), and History (Hist). Reference database is used as the universe of discourse in quality evaluation and it should be updated by sent data. Quarantine database stores the objects before they can be inserted, removed, or updated in the reference. History database maintains the backup of changed objects.
There are three kinds of movement for the considered data (Figure 2): insert to Quarantine (Insert to QA), Quarantine to Reference (QA to Ref), and Quarantine to History (QA to Hist). Each movement is regulated by its own rules.
When a dataset to assess arrives at the WPS interface, it is evaluated in the Evaluation module. After the evaluation the dataset becomes available to the Update DB module, where the first rules are applied. The rules for Insert to QA are the following:
(1) Invalid datasets are discarded (non-conformance with format consistency or conceptual consistency);
(2) If the date of product is previous to reference DB (inside its bounding box), this product is discarded;
(3) Objects with an invalid evaluation are discarded (invalid domain consistency or topological consistency);
(4) The score of remained objects is calculated according the changing possibilities listed in Table 2;
(5) When a create occurs, the system should look at the QA in order to find its homologous.
Change ID Value assigned to each tuple
No change1 refID -score for Cr – Sp Commission newID scorec for Cr, 0 for others Omission refID scoreo for Ds, 0 for others Positional accuracy2 refID score
p for Gm, 0 for others Thematic accuracy2 refID score
t for At, 0 for others Multi-case m>n refID scoreo for Cb, 0 for others Multi-case m<n refID scorec for Sp, 0 for others Notes: (1) score uses all quality elements. The other changing possibilities, no. (2) Positional and thematic accuracy can occur in the same object
Table 2. Insert to QA changing tuples.
Using some regular period (e.g. daily), the system should check if some candidate changing should occur. The rules for the QA to Ref are the following:
(6) Considering all 7-tuples grouped by its refID, the system calculates the final score for each changing possibility. If some score is greater than a given tolerance, the Conflation module is called in order to execute the change in the reference using the data in QA. If a destroy occurs, the object deleted from Ref is inserted in QA;
(7) Any change applied to the reference DB generates a new 'date' for this data in the affected region;
(8) Any change applied should reward the source registered user with more reputation.
Finally, the last set of rules is applied for the QA to Hist movement:
(9) After some period (e.g. one year), any 1:0 change (create/destroy) shall be moved from QA to Hist;
(10)After some period (e.g. 200 days), any 1:1 change (alter geometry/attribute) shall be moved from QA to Hist;
(11) After some period (e.g. 200 days), any m:n change (combine/split) shall be moved from QA to Hist.
The examples above (rules 9-11) for valid periods were extracted from the temporal validity of some feature types according to emergency services in New Zealand (LINZ, 2004).
4. USE CASES
In order to develop our proposal for the Update DB module, in this section we present two feasible use cases that may occur in the quality evaluation service. The first one deals with datasets with similar level of detail in relation to the reference database, while the second case deals with datasets with distinct levels of detail.
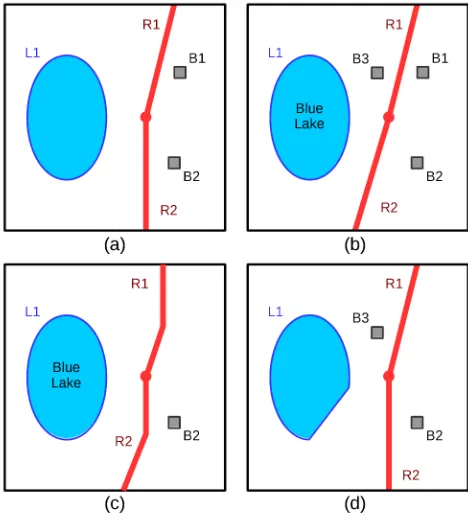
4.1 Use case 1: same scale
In this scenario, our quality evaluation service receives three datasets to be evaluated which have a level of detail similar to the reference database. The first one (E1) was sent by a registered user and it reaches the changing score of 0.81. The second (E2) was sent by an anonymous user and it has a 0.65 score. The last evaluation (E3) was sent by a trusted user and its calculated changing score is 1.32. The reference database is Figure 2. System architecture and data movements between
represented in Figure 3a, and the assessed datasets are represented in Figure 3b for E1, 3c for E2 and 3d for E3.
The dataset in evaluation E1 differs from the reference database in three aspects: new building B3, alter geometry in road R2, and alter the name (attribute) of lake L1. The differences in the dataset E2 are: alter the geometries of roads R1 and R2, destroy the building B1, and alter the name of lake L1. Lastly, the third dataset (E3) introduces other three changes: new building B3, destroy B1, and alter the geometry of lake L1.
Evaluation ID Cr Ds Gm At
E1 – registered B1 -0.81 -0.81 -0.81 -0.81 B2 -0.81 -0.81 -0.81 -0.81
B3 0.87 0 0 0
R1 -0.81 -0.81 -0.81 -0.81
R2 0 0 0.84 0
L1 0 0 0 0.83
E2 – anonymous B1 0 0.68 0 0
B2 -0.65 -0.65 -0.65 -0.65 B3 -0.65 -0.65 -0.65 -0.65
R1 0 0 0.69 0
R2 0 0 0.69 0
L1 0 0 0 0.71
E3 – trusted user B1 0 1.35 0 0
B2 -1.32 -1.32 -1.32 -1.32
B3 1.36 0 0 0
R1 -1.32 -1.32 -1.32 -1.32 R2 -1.32 -1.32 -1.32 -1.32
L1 0 0 1.37 0
Table 3. Changing tuples after assessment.
After receive these three datasets to be evaluated, Insert to QA rules (1-5) generated the list of changing tuples listed in Table 3 (without combine and split for simplification). The small fluctuations in scores are due to the selection of different quality results according to the type of change. Each tuple was calculated using the values described in Table 2.
The next step is to verify if the Quarantine data should migrate to Reference, so the QA to Ref rules (6-8) are applied. The system computes what should occur with changing features grouping by each identifier. Considering a changing threshold equal to one, the results are shown in Table 4.
ID Cr Ds Gm At Status
B1 -0,81 1,22 -0,81 -0,81 1,22 > 1, destroy B2 -2,78 -2,78 -2,78 -2,78 No change B3 1,58 -0,65 -0,65 -0,65 1,58 > 1, create R1 -2,13 -2,13 -1,44 -2,13 No change R2 -1,32 -1,32 0,21 -1,32 0,21 < 1, no change L1 0 0 1,37 1,54 1,37 > 1 and 1,54 > 1,
Change geometry and attribute
Table 4. Final score for each changing possibility.
Table 4 indicates what should occur with the features regarding the QA to Ref movement. The building B1 has to be destroyed because the final changing score have reached the changing threshold (=1). Despite the registered user has not informed any change in this object, the anonymous and trusted user have, so the system decision is to destroy the object based on the final score. Similar procedure is executed for the other objects. It can be observed that despite the road R2 has been modified (geometry) by two users (registered and anonymous), the unchanged status informed by the trusted user has reduced its changing score to a value below the threshold. Thereafter the object R2 remains unaltered.
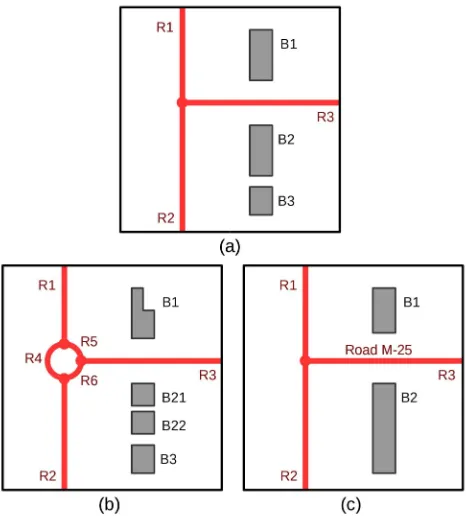
4.2 Use case 2: different scales
The reference database in this scenario for the considered regions is compound by buildings and roads (Figure 4a). The quality control service receives two datasets to be evaluated. The first one has a more detailed scale (Figure 4b), while the second presents less details (Figure 4c).
The more detailed dataset suggests that the three roads should receive a rotatory in their connection. This implies in three new objects (R4-R6), plus some geometric changes in existing roads (R1-R3). Other identified changing is in the geometry of building B1, by adding more vertices. The last alteration is the split of building B2 into two new objects B21 and B22.
On the other hand, the less detailed dataset did not be able to identify the new rotatory (R4-R6) due to its acquisition limitations. The dataset also suggests to combine the buildings B2 and B3 into only one (B2), what should be reject due the information provided by the more detailed dataset. Despite of the less detailed dataset has not given any accepted geometric changing, it has supplied a name for the unnamed road R3, an alter attribute change.
5. CONCLUSIONS
In our ever-changing world the natural time degradation that suffer the geospatial data can easily leads us to a geographic misunderstanding. We should maintain our geospatial databases as up-to-date as possible. In this paper we have presented the first design of a solution to use third-party data as a source for updating a reference database used in quality evaluation procedures.
The proposed solution is built over three concepts: rules, quarantine database, and conflation in order to keep the reference database up-to-date. This approach presents a temporal evolution model, a changing model, and a set of rules that manage the whole updating system. The temporal evolution model defines what should be updated and when. The changing model tries to quantify a changing score that is used by the rules. The rules define how the system uses the quarantine database to movement the data from a database to another. Conflation techniques are used to merge the data from quarantine to the reference.
This approach presents interesting features. It uses a quality model based on ISO standards. After some time, the system will be able to determine the changing rates of affected classes. It could be applied to the temporal evolution model in order to determine when and where an update should be executed. In the course of time, we will be able to update the territory types by identifying new expansion areas.
Since it is a first design, the solution requires refinements like: how should be calculated the score using the proposed six variables? Other limitation is that the approach does not take into account the relations among objects of distinct classes.
Future work includes: (1) define how to calculate the changing score; (2) detail and develop the Conflation module; (3) upgrade the quality model by testing new elements; and (4) describe the rules using a spatiotemporal algebra.
ACKNOWLEDGEMENTS
This work has been funded by the Ministry of Science and Technology (Spain) and the European Regional Development Fund under grant no. BIA2011-23217. The authors also wish to acknowledge the support of the Brazilian Army's Department of Science and Technology, and the support of the Regional Government of Andalucía (Spain) for the Research Group “Ingeniería Cartográfica” (TEP-164).
REFERENCES
Ariza López, F.J., 2013. Fundamentos de evaluación de la calidad de la información geográfica. Jaén: Universidad de Jaén.
Ariza-López, F.J., Xavier, E.M.A., and Ureña-Cámara, M.A., 2015. Proposal of a web service for positional quality control of spatial data sets. In: International Workshop on Spatial Data and Map Quality, Valletta, Malta.
Basoglu, U. and Morrison, J.L., 1978. The efficient hierarchical data structure for the U.S. historical boundary file. In: G. Dutton, ed. Harvard Papers on Geographic Information Systems. Reading, MA: Addison-Wesley.
Chrisman, N.R., 1984. The role of quality information in the long-term functioning of a geographic information system. Cartographica: The International Journal for Geographic Information and Geovisualization, 21 (2-3), pp. 79–88.
Cooper, A. and Peled, A., 2001. Incremental updating and versioning. In: Proceedings of 20th International Cartographic Conference. Beijing, China, pp. 2804–2809.
Felus, Y., Srebro, H., and Tal, Y., 2010. GIS versioning management - the approach of the Survey of Israel. In: A. Peled, ed. ISPRS Archives - Volume XXXVIII-4-8-2/W. Haifa, Israel, pp. 1–6.
Ferreira, K.R., Camara, G., and Monteiro, A.M.V., 2014. An algebra for spatiotemporal data: from observations to events. Transactions in GIS, 18 (2), pp. 253–269.
Hornsby, K. and Egenhofer, M.J., 2000. Identity-based change: a foundation for spatio-temporal knowledge representation. International Journal of Geographical Information Science, 14 (3), pp. 207–224.
ISO, 2013. ISO 19157:2013. Geographic information - Data quality. International Organization for Standardization (ISO).
Langran, G. and Chrisman, N.R., 1988. A Framework for temporal geographic information. Cartographica: The International Journal for Geographic Information and Geovisualization, 25 (3), pp. 1–14.
Lee, J.-Y., 2002. Integrating spatial and temporal relationship operators into SQL3 for historical data management. ETRI Journal, 24 (3), pp. 226–238.
Lemarié, C. and Badard, T., 2001. Cartographic database updating. In: Proceedings of the 20th International Cartographic Conference. Beijing, China, pp. 1376–1385.
Long, J.A. and Nelson, T.A., 2013. A review of quantitative methods for movement data. International Journal of Geographical Information Science, 27 (2), pp. 292–318. Figure 4. Use case 2 datasets: (a) reference, (b) more detailed,
LINZ, 2004. ESA core data specification version 1.9.7. Land Information New Zealand (LINZ).
Morris, K., Hill, D., and Moore, A., 2000. Mapping the environment through three-dimensional space and time. Computers, Environment and Urban Systems, 24 (5), pp. 435– 450.
Ordnance Survey, 2004. OS MasterMap user guide: product specification.
Peled, A. and Cooper, A., 2004. The concepts of incremental updating and versioning. In: Proceedings of XXth ISPRS Congress. Istanbul, Turkey, pp. 26–28.
Price, S., 1989. Modelling the temporal element in land information systems. International Journal of Geographical Information Systems, 3 (3), pp. 233–243.
Qi, H.B., Li, Z.L., and Chen, J., 2010. Automated change detection for updating settlements at smaller-scale maps from updated larger-scale maps. Journal of Spatial Science, 55 (1), pp. 133–146.
Ramirez, J.R., 1997. Revision of geographic datasets : Development and implementation of a new solution. In: Proceedings of GIS/LIS 1997 annual conference and exposition. Cincinnati, USA.
Wang, Y., Du, Q., Ren, F., and Zhao, Z., 2013. A propagating update method of multi-represented vector map data based on spatial objective similarity and unified geographic entity code. In: Proceedings of 26th International Cartographic Conference. Dresden, Germany.
Worboys, M.F., 1994. A unified model for spatial and temporal information. The Computer Journal, 37 (1), pp. 26–34.
Xavier, E.M.A., Ariza-López, F.J., and Ureña-Cámara, M.A., 2015a. Web service for positional quality assessment: the WPS tier. In: ISPRS Annals of the Photogrammetry, Remote Sensing and Spatial Information Sciences, II-3/W5. La Grande Motte, France, pp. 257–262.