www.elsevier.comrlocateratmos
Microphysical observations of warm cumulus
clouds in Ceara, Brazil
´
Alexandre Araujo Costa
´
a,), Carlos Jacinto de Oliveira
b,
Jose Carlos Parente de Oliveira
´
c,
Antonio Jose da Costa Sampaio
ˆ
´
c,1a
Department of Atmospheric Science, Colorado State UniÕersity, Fort Collins, CO, USA
b
Departamento de Fısica, Uni´ Õersidade Estadual do Ceara, Fortaleza, CE, Brazil´
c
Departamento de Fısica, Uni´ Õersidade Federal do Ceara, Fortaleza, CE, Brazil´
Received 30 March 1999; received in revised form 10 December 1999; accepted 8 March 2000
Abstract
Microphysical properties of shallow, warm cumulus clouds, such as droplet concentration, shape of the spectra, etc., may vary due to several factors, from the large-scale environment to microphysical processes on very small scales. Microphysical characteristics of clouds present a significant variability due to different CCN sources. For instance, it is well known that there are crucial differences between maritime and continental clouds regarding their microstructure. In this paper, we analyze microphysical data obtained inside shallow cumuli with an instrumented aircraft in Ceara State, Northeast Brazil, during a field campaign carried out during the first half of 1994.´ A brief description of the field campaign is presented and a cloud classification is established. Significant differences regarding droplet concentration and spectrum shape were observed among four different cloud regimes: maritime, coastal, continental and ‘‘urban’’ clouds. Different
Ž .
functions were examined exponential, gamma, lognormal and Weibull in order to determine how appropriate are bulk parameterizations of droplet spectra in the representation of the microphysical properties of shallow cumulus clouds. The exponential distribution was shown to be unsuitable for most of the observed spectra. The gamma and lognormal distributions were better with the
Ž
Weibull distribution providing the best fit. However, a significant variability of the width or
.
shape parameter was verified for the three distributions, regarding different cloud regimes
Žmaritime, coastal, continental and urban , from cloud to cloud, and in association with different.
regions of a cloud. Such variability imposes important limitations to bulk-microphysical modeling
)Corresponding author.
Ž .
E-mail address: [email protected] A.A. Costa . 1
Current affiliation: Universidade do Vale do Acarau, Sobral, Brazil.´
0169-8095r00r$ - see front matterq2000 Elsevier Science B.V. All rights reserved.
Ž .
using distributions with prescribed widthrshape parameters. A brief discussion is presented on how physical processes in a cloud can alter the shape of the droplet spectra, focusing on idealized distributions.q2000 Elsevier Science B.V. All rights reserved.
Keywords: Warm cumuli; Microphysical data; Droplet size distributions; Northeast Brazil
1. Introduction
It has been recognized that shallow convection is important in global atmospheric processes. Although they are much smaller in size than deep convective clouds, and their updrafts are much less intense, collective effects of shallow cumulus clouds cannot be neglected, because they are much more frequent then deep cumuli. Shallow cumuli play an important role in transporting heat and moisture from the boundary-layer to low and mid-tropospheric levels and can block part of the downward solar radiation, influencing the radiative budget over the tropics. Also, since shallow cumuli are able to
Ž .
produce warm rain especially when they form from maritime air masses , they also make a significant contribution to the climatological precipitation in certain regions of the globe. Obviously, microphysical characteristics of shallow cumuli are important, since both the radiative properties and the precipitation efficiency of clouds depend on how the water is distributed among cloud particles.
The purpose of this study is to investigate the microphysical properties of precipitat-ing and non-precipitatprecipitat-ing shallow cumulus clouds in a tropical region located between
Ž .
2.88S and 7.98S and 41.58W and 37.38W state of Ceara, Northeast Brazil . The analysis
´
is based on the data obtained with an instrumented aircraft, in a field campaign carried out between February and June 1994.The size distribution of hydrometeors is an important factor to determine the characteristics of clouds and cloud systems, including their precipitation efficiency and
their optical properties. Hence, microphysical–dynamical or microphysical–
radiational–dynamical feedbacks are often influenced by how the spectra of cloud particles look like. The most obvious approach to predict how the distribution-function of hydrometeors evolve in time in a cloud model is to use a bin-microphysics approach
Že.g., Ogura and Takahashi, 1973; Soong, 1974; Young, 1974; Hall, 1980; Kogan, 1991; Tzivion et al., 1989; Brenguier and Grabowski, 1993; Feingold et al., 1994; Stevens et
.
al., 1996; Costa et al., 2000 . Yet, because bin-microphysics is computationally expen-sive, cloud modelers frequently have to use bulk parameterizations, in which the hydrometeor spectra are assumed to follow an analytical distribution. In this paper, four fittings for droplet spectra in shallow cumuli are analyzed.
The outline of the paper is as follows: Section 2 presents a brief climatological and meteorological background. Section 3 characterizes the instrumentation and briefly describes the field campaign. In Section 4, the effect of the different locations on the
Ž
cumulus microstructure is described over the ocean, at the coast, inland and over Fortaleza, the capital of the state, where about two million people reside, and where
.
several mixed industries are located . As expected, clouds developing in different
Ž .
remark-able differences in their microstructures. The results show an overall agreement with those reported by Squires and Twomey, 1966; Warner and Twomey, 1967; Twomey and Wojciechowski, 1969; Mason, 1971; Hudson, 1993. In Section 5, fitting attempts are performed using four distribution functions: exponential, gamma, lognormal and Weibull. It is shown that exponential functions, in which the only adjustable parameter is the slope, do not provide an appropriate representation of most of the observed spectra. Gamma, lognormal, and Weibull distributions have both two free parameters to calibrate and, hence, are able to furnish much better fittings. Analysis of the spectra show that the fitted spectra can exhibit a large variety of shapes, which limits the applicability of parameterizations with user-specified shaperwidth parameters, particularly the gamma-distribution-based ones. A significant variability was observed, regarding the shape
Žwidth parameter in both gamma-fitted and lognormal-fitted distributions, associated.
Ž .
with different cloud regimes maritime, coastal, continental, and urban . Also, different portions of single clouds can exhibit rather distinct droplet spectra, with abrupt
transi-Ž
tions in between, which is consistent with previous observational studies e.g., Austin et
.
al., 1985 . The observed variability of the fitting parameters is discussed in Sections 6 and 7. In individual cumuli, spectrum variability can be caused both by dynamical processes, such as mixing and entrainment, and microphysical processes, such as nucleation, condensational growth, and collision–coalescence. The physical mechanisms that cause the spectra to change in clouds and the consequences of the droplet spectrum shape variability to cloud modeling are analyzed in Section 8. It turns out that the bulk parameterization approach using distribution-functions with two degrees of freedom has an important limitation. Because in actual numerical models at least one of the
Ž
adjustable parameters commonly has to be specified by the user for instance, the shape
.
parameter of the gamma distribution , the large variety of spectrum shapes is not represented. A summary and overall discussion are presented in Section 9.
2. Meteorological background
Ž .
Northeast Brazil NEB , including Ceara State, comprises a mostly semi-arid region.
´
The climatological annual rainfall distribution in Ceara has some minima of less than´
600 mm, but also shows a significant spatial variability in precipitation, associated with local effects, especially at the coast and close to some small mountain ranges. The north portion of NEB has a well-defined rainy season between February and May, related toŽ .
3. Instrumentation and field campaign
Ž
The instrumented aircraft used to collect the data ALPA — Aviao-Laboratorio para
˜
´
. Ž .
Pesquisas Atmosfericas is described in detail by de Almeida et al. 1992 . Its major
´
deficiency is the lack of instrumentation to measure the vertical velocity, which of course limits our capability to analyze dynamics-microphysics interactions.In this paper, we will give distinction to the Forward-Scattering Spectrometer Probe
ŽFSSP data, which consists of 10-Hz cloud droplet spectrum measurements. The FSSP. Ž
has been extensively explored in the literature Knollenberg, 1981; Baumgardner, 1983;
.
Dye and Baumgardner, 1984 . As calibrated in ALPA, the probe categorizes the droplets in 15 diameter classes, between 2 and 47mm. Corrections for dead-time and coincidence
ŽBaumgardner and Dye, 1985; Brenguier and Amodei, 1989; Brenguier, 1989 were.
used.
Ž
Microphysical data were collected in a set of 10 flights hereafter referred to as the
.
Ceara experiment , carried out on board ALPA, which covered the northern NEB rainy
´
season between February and May, plus June. All flights were performed focusing onŽ .
Fig.1. Map of Ceara state CE , showing departure and turning points for the flights during the Ceara´ ´
Ž . Ž . Ž . Ž . Ž .
experiment: cities of Fortaleza 1 , Paracuru 2 , Nova Russas 3 , Taua 4 , Juazeiro do Norte 5 , Mossoro´ ´
Ž .6 , Morada Nova 7 , Aracati 8 and Ocara 9 . Neighboring states of Piauı PI , Rio Grande do Norte RN ,Ž . Ž . Ž . ´Ž . Ž .
Ž . Ž .
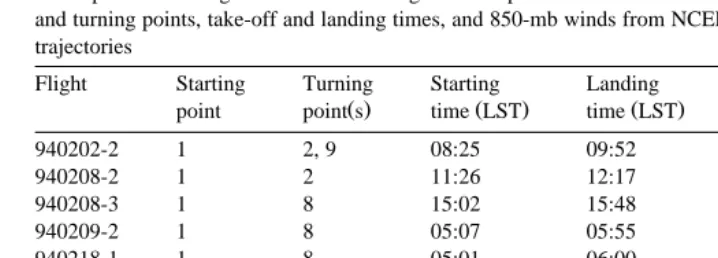
Table 1
Description of the flights carried out during Ceara Experiment. The columns show the flight number, departure´
and turning points, take-off and landing times, and 850-mb winds from NCEP analysis. All flights were closed trajectories
Flight Starting Turning Starting Landing 850-mb wind speed
Ž . Ž . Ž .
point point s time LST time LST and direction
940202-2 1 2, 9 08:25 09:52 ;6 mrs, southeasterly
940208-2 1 2 11:26 12:17 ;9 mrs, easterly
940208-3 1 8 15:02 15:48
940209-2 1 8 05:07 05:55 ;8 mrs, easterly
940218-1 1 8 05:01 06:00 ;12 mrs, northeasterly
940225-1 1 8 05:01 05:48 ;5 mrs, easterly
940414-1 1 8 14:02 15:03 ;12 mrs, northeasterly
940519-5 5 4 14:30 16:02 ;5 mrs, easterly
940530-1 1 2, 3 09:09 11:34 ;7 mrs, easterly
940622-1 1 6, 7 13:50 16:19 ;6 mrs, easterly
Ž
the field of shallow cumulus clouds, including some precipitating cumuli hereafter we will refer to each set of at least 5 s continuous FSSP total concentration greater than 20
y3 .
cm as one ‘‘cloud’’ . The flight notation is YYMMDD-N, where YY indicates the
year, MM the month, DD the date and N the data file. Fig. 1 indicates reference points in Ceara. Table 1 shows the starting and turning points, take-off and landing times, and
´
the large-scale flow conditions at 850 mb for each flight.4. Cloud classification
A first attempt to characterize the clouds in Ceara was made by de Oliveira et al.
´
Ž1996 , in which the clouds were divided in two categories according to their location:.
coastal and continental. Most of the coastal clouds presented a droplet number concen-tration of less than 300 cmy3 corresponding to typical values for ‘‘moderate maritime’’ clouds. On the other hand, most of the continental clouds exceeded this value, and could be considered ‘‘moderate continental’’ clouds. Nevertheless, in that paper, coastal
clouds with maximum number concentrations exceeding 700 cmy3 were reported,
particularly downwind from Fortaleza.
In the previous work, the following aspects given below were not considered.
Ž .1 There might be a significant additional production of aerosols, in general, and particularly of CCN, related to human activities around the city of Fortaleza. Clouds forming in such a region may be significantly altered by the polluted environment, having a tendency to deviate from the behavior of coastal clouds. In fact, in a
Ž .
Ž .
and other microphysical parameters mean diameter, spectrum shape should also be affected by the presence of extra aerosol particles. Therefore, the characteristic values
Ž .
for microphysical quantities in coastal clouds, found by de Oliveira et al. 1996 , are probably corrupted due to the inclusion of some polluted clouds. The typical droplet number concentration, for instance, was probably overestimated.
Ž .2 Environmental conditions affect the transport of CCN. The trade-winds keep a westward component in the whole low troposphere, but the meridional wind component can vary due to several factors, including changes in the position of the ITCZ and local effects, such as the sea-breeze. Consequently, different wind directions, and also different wind speeds, induce different patterns of CCN transport. For instance, clouds sampled over the coast, downwind from Fortaleza, often exhibited microphysical properties of polluted clouds, as large droplet concentrations.
Ž .3 Some clouds were penetrated more than 10 km from the coast, over the Atlantic Ocean. Those clouds were previously classified as coastal clouds, but they may depart
Ž .
from the intermediate characteristics between typical maritime and typical continental that are expected in ‘‘coastal’’ clouds.
In this paper, an improved classification is proposed. In order to take into account the urban effects, and also to evaluate their importance, clouds that formed over the metropolitan region of Fortaleza, or in some region in which there were indications of
Ž .
the influence of polluted aerosols downwind from Fortaleza , were separated from the ensemble of coastal clouds. Such clouds are then described as ‘‘urban’’ clouds and one might anticipate that their microphysical characteristics range between moderate mar-itime and typically polluted clouds. The term ‘‘polluted’’ was not used, because some variability might be expected, related to changes in the environment and to the variability of human activities. Also, part of the changes in the microphysical character-istics of those clouds may be due to a ‘‘heat island’’ effect, making the designation
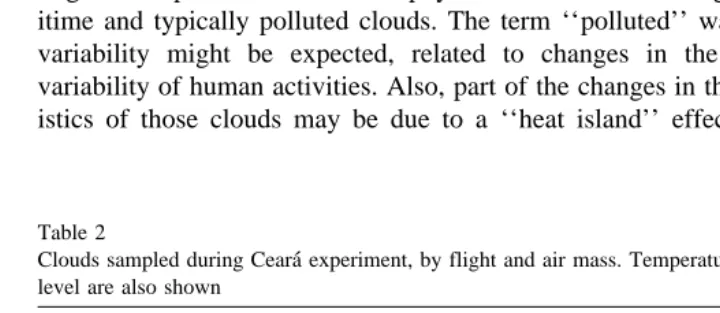
Table 2
Clouds sampled during Ceara experiment, by flight and air mass. Temperature and pressure at the cloud base´
level are also shown
Flight Maritime Coastal Continental Urban Average cloud
clouds clouds clouds clouds base temperature
sampled sampled sampled sampled and pressure
‘‘urban’’ more accurate. The clouds sampled over the Atlantic Ocean were also separated from the set of coastal clouds, and grouped in a category named ‘‘maritime’’. In short, four cloud categories are considered in this paper: maritime, coastal, continental and urban. One of the purposes of this paper is to determine the microphysi-cal characteristics of each group of clouds, and to verify how adequate is such a classification to the reality of Ceara. As most of the measurements were performed
´
along the coast with Fortaleza as the departure point, the joint ensemble of maritime, coastal, and urban clouds represent 61.6% of the 191 clouds which were studied in that field campaign. Table 2 shows the number of clouds sampled, divided by category, and the average temperature and pressure at the cloud base level in each flight.The following parameters, as measured from the FSSP, were determined for each individual cloud: maximum droplet number concentration, maximum droplet mean
Ž .
diameter, and maximum liquid water content LWC . Fig. 2 depicts the distribution of maximum number concentration occurrences for the four cloud categories. It can be
Ž .
observed that most of the maritime clouds 81.2% presented maximum concentrations
Ž . Ž . Ž .
Fig. 2. Droplet maximum concentration occurrences for the sets of maritime a , coastal b , continental c
Ž .
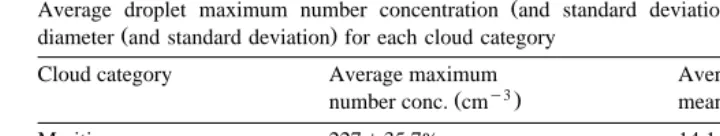
Table 3
Ž .
Average droplet maximum number concentration and standard deviation and droplet maximum mean
Ž .
diameter and standard deviation for each cloud category
Cloud category Average maximum Average maximum
y3
Ž . Ž .
number conc. cm mean diameter mm
Maritime 227"35.7% 14.1"18.6%
Coastal 265"36.2% 13.3"22.5%
Continental 375"34.9% 9.9"33.7%
Urban 433"35.7% 11.2"28.5%
y3 Ž .
ranging between 100 and 300 cm Fig. 2a . Coastal clouds present a behavior similar to that of maritime clouds, regarding the number concentration. 87.3% of the coastal
y3 Ž .
clouds have maximum concentrations between 100 and 400 cm Fig. 2b . As
expected, continental clouds tend to exhibit higher droplet concentrations; indeed, 72.6% of the continental clouds presented maximum number concentrations between 200 and
y3 Ž . Ž y3.
500 cm Fig. 2c . Some of the higher number concentrations )800 cm are
observed in the urban category, which presumably comprises some typical examples of
Ž .
polluted clouds. 71.0% of the urban clouds exhibited maximum droplet concentrations
y3 y3 Ž .
between 300 and 600 cm , and 12.9% actually exceed 600 cm Fig. 2d . A
comparison between the mean values of the maximum droplet number concentration for the four groups of clouds is shown in Table 3. This shows that the mean observed maximum concentration in continental clouds is about 65% larger than the correspond-ing value in maritime clouds, which can be considered a relatively modest discrepancy. Coastal clouds exhibit intermediate properties, although the clouds included in this category tend to behave more like maritime clouds. Urban clouds show the highest mean maximum number concentration, proving that Fortaleza has an important role in modifying the microstructure of nearby clouds. The standard deviations are relatively large but all of them have the same order of magnitude, suggesting that the high values
Ž
are not primarily due to poor sampling for instance, there are more than twice as much
.
continental clouds than urban and maritime clouds but are related to natural variability. Despite the strong dependence of the droplet radius on altitude, and microphysical
Ž .
processes condensational growth, collision–coalescence , it is well known that, for
Ž . Ž .
similar clouds, high small droplet concentrations favor small large mean diameters
Ž‘‘Twomey effect’’ . The distributions of maximum mean diameter occurrences for the.
four cloud groups are shown in Fig. 3. The largest occurrence of maximum mean diameters in maritime clouds lies in the range 12 to 14mm. Only 15.6% of these clouds had maximum mean diameters smaller than 12mm. A similar behavior was found in the
Ž . Ž . Ž .
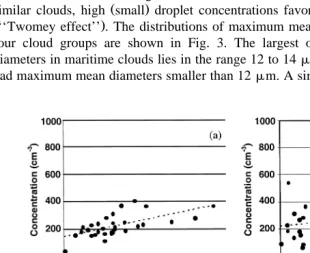
Fig. 4. Scatter plots of concentration versus LWC for the sets of maritime a , coastal b , continental c and
Ž .
coastal set, for which clouds with maximum mean diameters between 14 and 16 mm dominated. Also, in that case, clouds with maximum mean diameters smaller than 12
mm represented 36.3% of the total of coastal clouds. The situation is quite different for the set of continental clouds, in which the modal number of occurrences is in the range 10 to 12 mm and for which 78.1% presented maximum mean diameters less than 12
mm. Urban clouds again behaved more like continental clouds. Maximum mean
diameters between 10 and 12 mm dominated, and 61.3% of the clouds in that group exhibited maximum mean diameters smaller than 12 mm. Table 3 shows the averaged maximum mean diameter for the four distinct cloud groups. The averaged value for the set of continental clouds was about 70% of the corresponding value for its maritime counterpart.
The values of maximum LWC in most of the clouds studied in the field campaign were relatively low, representing only a small fraction of the values estimated for unmixed adiabatic cores. That can be in part due to sample problems, since eventually, as the instrumented aircraft traverses a cloud, it may not cross the major updrafts. On the other hand, several individual clouds in a cumulus ensemble are no longer convectively
Ž .
active. Fig. 4 is a set of scatter plots concentration versus LWC for the different cloud groups. First, it can be observed that the majority of the LWC values were smaller than 0.5 g my3. Second, there is a small positive correlation between the two parameters
Žconcentration and LWC in all cloud categories, except for the urban clouds, for which.
there was virtually no observed correlation.
5. Fitting cloud spectra to analytical distributions
Bulk parameterizations have been widely used to represent microphysical processes in cloud models, because they are, in general, more computationally efficient than
Ž .
bin-microphysics schemes. For instance, Feingold et al. 1998 show that, in LES simulations of marine stratocumulus, satisfactory results can be achieved using a bulk-microphysics scheme, in a computation time several times smaller than the one associated with the model with full bin microphysics. As far as the bulk representation is shown to be adequate to simulate the microphysical processes, the very expensive bin-microphysics schemes can be replaced. The higher efficiency of bulk-microphysics model allows the utilization of more computational resources to reduce the grid spacing or use more accurate numerical techniques or more sophisticated parameterizations of turbulence and radiation, for instance.
The sensitivity of the cloud models to the microphysical parameterization is, in general, model and case-dependent. However, if microphysical processes are important to the evolution of the simulated cloud–cloud system, it is necessary, in general, to verify if the hypothesis of representing the distribution-function of hydrometeors by a certain analytical function is appropriate or not.
The most standard postulation regarding the size distribution of precipitating cloud particles is that they follow an exponential or Marshall–Palmer distribution. Such an
Ž
assumption was used by many cloud modelers Lin et al., 1983; Rutledge and Hobbs,
.
utilize more flexible bulk parameterizations, with distinction to gamma distributions as
Ž .
basis functions Ferrier, 1994; Walko et al., 1995; Meyers et al., 1997 . Another
Ž .
possibility, as suggested by Pruppacher and Klett 1998 is the use of lognormal
Ž .
distribution functions e.g., Feingold et al., 1998 .
Ž .
For cloud droplets, cruder assumptions are frequently used. Lin et al. 1983 ,
Ž . Ž . Ž .
Rutledge and Hobbs 1984 , Wyant et al. 1997 , Reisner et al. 1998 all use
Kessler-type autoconversion parameterizations and assume that the cloud droplet spectra
Ž .
are monodispersed. Ferrier 1994 proposes that cloud droplets have an exponential distribution. Among the bulk microphysics models cited above, only Walko et al.
Ž1995 , Meyers et al. 1997 and Feingold et al. 1998 use the same level of complexity. Ž . Ž .
to treat precipitating particles and cloud droplets, which are also assumed to follow a gamma or a lognormal distribution. It is certainly important to investigate how
realisti-Ž .
cally those functions represent real droplet distributions. According to Liu et al. 1995
Ž .
and Liu and Hallet 1998 , though, it is the Weibull that maximizes the entropy of a
Ž .
droplet system for a definition, refer to Liu et al. 1995, Eq. 6 with a fluctuating cloud
Ž .
droplet size distribution. Liu et al. 1995 actually found that the Weibull distribution provided superior agreement with observed cloud droplet spectra. However, they used a limited number of distributions and a larger number of observations is, of course,
Ž . Ž .
necessary, to confirm or reject their hypothesis Table 4 .
Ž
In this section, attempts to fit four different analytical functions exponential, gamma,
.
lognormal and Weibull were carried out for the 32,460 observed spectra. In this paper, instead of comparing statistical properties of the observed spectra and analytical
Ž .
distributions as in Liu et al., 1995 , a direct comparison is made between the observed and fitted distributions. Hereafter, an ‘‘acceptable’’ or ‘‘good’’ fit is the one for which
Ž .
the root mean-squared RMS difference between the fitted and observed values of the distribution-function is equal or less than 2% of the total number concentration. Of course, such a guideline is one among many possible criteria and the threshold itself is completely arbitrary.
Table 5 shows the mathematical expressions for the distribution functions and the equations for the ‘‘scale diameter’’ or ‘‘slope’’ of the distribution, calculated from the
Ž
observed number concentration, LWC and ‘‘shape’’ or ‘‘width’’ parameter when
.
applicable .
Table 4
Equations for the exponential, gamma, lognormal and Weibull distribution functions and their respective scale diameters
Ž .
Distribution Mathematical expression Scale diameter slope
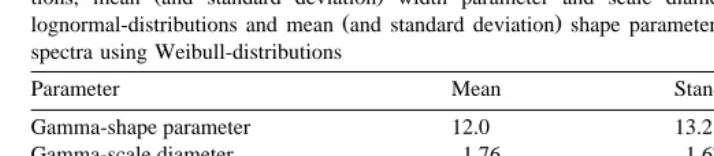
Table 5
Ž .
Mean and standard deviation shape parameter and scale diameter of the fitted spectra using
gamma-distribu-Ž .
tions, mean and standard deviation width parameter and scale diameter of the fitted spectra using
Ž .
lognormal-distributions and mean and standard deviation shape parameter and scale diameter of the fitted spectra using Weibull-distributions
The use of the Marshall–Palmer distribution to fit cloud droplet spectra has an obvious disadvantage: most spectra are not dominated by very small droplets, while the exponential function has its maximum at Ds0. The consequence is that the exponential distribution provides acceptable fittings for only 17.0% of the spectra observed in shallow cumuli during the Ceara experiment.
´
Because the gamma distribution has one degree of freedom more than the exponential distribution, the scale diameter and shape parameter that fit a given spectrum are not unically determined from the observed concentration and LWC. In this paper, the procedure was to find the shape parameter that minimizes the RMS difference between the observed and fitted spectrum, under the constraints associated with the observed concentration and LWC. The scale diameter is then calculated using the correspondent equation in Table 5. One alternative approach is to solve an equation for the shape parameter. However, such a method requires an accurate knowledge of the modal diameter, which is not feasible in our case, because the bin width of the observations is too large.
Ž .
Walko et al. 1995 show that the gamma distribution can assume a large variety of shapes, depending on the value ofn. Since the gamma distribution is more flexible than the exponential distribution, one might expect that the former is more able to represent the observed cloud spectra. In fact, according to the criterion proposed in the beginning of this section, 91.8% of the actual spectra could be fitted by gamma distributions. Examples of good fittings can be found for a variety of spectrum shapes, which attests the versatility of the gamma distribution to parameterize cloud droplet spectra in shallow cumuli. However, the wide range of values of the shape parameter turns out to be a shortcoming of the gamma fitting, as will be discussed later.
6. Spectrum shape variability
Although the Weibull, gamma and lognormal distributions were able to represent most of the observed spectra, significant variations in the parameters of the distributions were observed. As only a small fraction of the spectra were fitted by the exponential function, this distribution is discarded in this section.
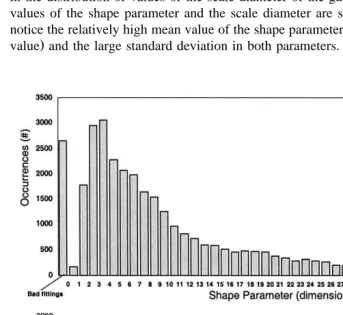
Considering all the fittings using a gamma distribution, described in the previous section, the occurrence of the shape parameter and the scale diameter are shown in Fig. 5. Although the largest number of values of the shape parameter was found between 3 and 4, it is clear there is significant variability, with 1224 spectra exceedingns40, and a few actually reaching values bigger than 100. A very large variability was also found in the distribution of values of the scale diameter of the gamma distribution. The mean values of the shape parameter and the scale diameter are shown in Table 6. One must
Ž
notice the relatively high mean value of the shape parameter about 3–4 times the modal
.
value and the large standard deviation in both parameters.
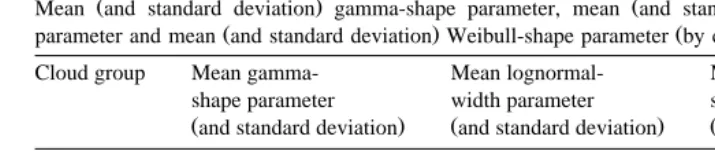
Table 6
Ž . Ž .
Mean and standard deviation gamma-shape parameter, mean and standard deviation lognormal-width
Ž . Ž .
parameter and mean and standard deviation Weibull-shape parameter by cloud category
Cloud group Mean gamma- Mean lognormal- Mean
Weibull-shape parameter width parameter shape parameter
Žand standard deviation. Žand standard deviation. Žand standard deviation.
Maritime 13.5"19.3 1.51"0.33 3.32"2.12 Coastal 10.7"13.5 1.54"0.31 3.03"1.78 Continental 12.5"10.6 1.40"0.18 3.46"1.34
Urban 9.8"10.2 1.45"0.19 3.18"1.59
The occurrence of the width parameter and scale diameter of the lognormal fittings is shown in Fig. 6. There is some variability in both parameters, however it is much less pronounced than in the case of the gamma fitting. Most of the fitted spectra presented
width parameters between 1.2 and 1.5 and scale diameters between 5 and 8mm. Means and standard deviations of s and D are shown in Table 6.0
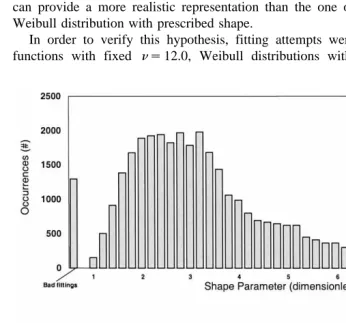
Finally, the occurrence of the Weibull-shape parameter and scale diameter is depicted in Fig. 7. There is a significant spread of the shape parameter, with a large number of occurrences from 1.5 to 4, and also of the scale diameter, from 7 to 15mm. Means and standard deviations ofm and D are shown in Table 6.0
Because the variability of the free parameters in the lognormal fitting is modest, compared to the ones found in association with their gamma-distribution and
Weibull-Ž .
distribution counterparts, it might be easier but not necessarily more appropriate to prescribe a value of s than a value of n or m. One could hypothesize that utilizing a lognormal distribution with prescribed width parameter in a bulk-microphysics model can provide a more realistic representation than the one obtained using a gamma or Weibull distribution with prescribed shape.
In order to verify this hypothesis, fitting attempts were performed using gamma functions with fixed ns12.0, Weibull distributions with ms3.32 and lognormal
Ž
functions with ss1.45 other attempts using the modal values of the shaperwidth parameter, or using a specified scale diameter were also carried out, but the results were
. Ž
found to be worse . Appropriate fittings were obtained for 16,086 spectra 49.6% of the
. Ž
total when the gamma distribution was used, while only 12,871 spectra 39.7% of the
.
total were appropriately fitted by the lognormal distribution. Both results are poor, which indicates that the use of a prescribed shaperwidth parameter indeed imposes an important limitation to bulk schemes using gamma or lognormal basis functions, even in
Ž .
a two-moment framework i.e., predicted mixing ratio and concentration . When the shaperwidth parameter is fixed, the gamma basis-function actually produces a superior result than the one obtained via lognormal fitting. Of course, both are much better than the exponential fitting in representing observed cloud droplet spectra in shallow cumuli. The best results with fixed, prescribed shape parameter, where achieved using
Ž .
Weibull distributions. When ms3.32 average value from the observations is used,
Ž .
21,590 66.5% of the total spectra were properly fitted. Using the value calculated
Ž .
theoretically by Liu et al. 1995 for the maximum-likelihood droplet distribution
Žms3.0 , the result was actually superior 22,180 spectra, or 68.3% of the total, were. Ž
. Ž .
well fitted . Both scenarios variable and prescribed shape parameters show a signifi-cant superiority of the Weibull-distribution in fitting the droplet spectra observed during the Ceara experiment. Therefore, the use of this type of analytical distribution as
´
basis-functions for bulk-microphysical parameterizations is recommended.Ž .
Several authors as the ones cited at the Introduction described observations that
Ž . Ž .
showed the prevalence of narrow broad spectra in continental maritime . In fact, the fitting attempts performed on the spectra observed during the Ceara experiment exhibit a
´
dependence on the cloud regime.As discussed previously, the exponential fitting provided very deficient results for
Ž .
most of the observed spectra. However, in two groups of clouds continental and urban the results were even poorer: only 13.2% of the urban spectra and 9.6% of the continental spectra were properly approximated by exponential functions. On the other hand, 24.6% of the maritime spectra and 29.6% of the coastal spectra were approxi-mately exponential.
Gamma fitting was effective in representing 83.9% of the maritime, 90.2% of the coastal, 95.5% of the continental and 90.4% of the urban spectra. The largest number of occurrences of n in both maritime and coastal clouds appears between 2 and 3. In the sets of continental and urban clouds, the most frequent values ofn occur between 3 and 7. In agreement with the result obtained for the exponential fitting, the occurrence of n
Ž .
between 0 and 2 close to the exponential, ns1 is much more common in maritime
Ž10.6% and coastal clouds 13.2% than in continental 1.8% and urban clouds 2.9% .. Ž . Ž . Ž .
Ž .
It should be noted, however, that the occurrence of very large shape parameters )40
Ž . Ž .
was more prevalent in maritime clouds 8.2% than in continental clouds 1.8% . Coastal
Ž . Ž .
clouds 5.3% and urban clouds 3.4% presented high-n frequencies in between. On average, the shape parameter was very similar, and also extremely variable, in all cloud categories, as shown in Table 7.
Ž .
As discussed by Walko et al. 1995 , as the shape parameter of the gamma
Table 7
Location, classification, mean aircraft altitude during penetration, maximum number concentration and maximum liquid water content for clouds 1–4
Cloud Location Regime Mean Maximum Maximum
aircraft conc. LWC
y3 y3
Ž . Ž . Ž .
altitude m cm g m
1 Northwest of Urban 1963 334 0.488
Fortaleza
2 30 km of the coast Maritime 1725 249 0.640
between Fortaleza and Paracuru
3 At the coast Coastal 1512 298 0.487
between Fortaleza and Paracuru
4 Close to Ocara Continental 1898 390 0.473
Ž .
the shape parameter increases. Maritimercoastal continentalrpolluted clouds tend to
Ž . Ž .
present broader narrower spectra and larger smaller modal diameters, thus the mean gamma-shape parameter of the fitted distributions are close in all cloud groups. The present analysis of the gamma-fittings suggest that it is not possible to determine a clear dependence of the shape parameter of gamma-distributions on the air mass type, which contributes to maintain the uncertainty associated with bulk-microphysics parameteriza-tions based on such funcparameteriza-tions.
The lognormal-fitting was less suitable than the gamma fitting for all cloud cate-gories. Good fittings were achieved for 71.8% of the maritime, 80.8% of the coastal, 89.0% of the continental, and 85.5% of the urban clouds. Maritime and coastal spectra tended to exhibit larger widths than the continental and urban spectra. The average values of s for each cloud category are shown in Table 7.
The Weibull-fitting was effective in representing 91.4% of the maritime, 93.9% of the coastal, 98.7% of the continental and 94.7% of the urban spectra, providing the best representation of cloud spectra for all cloud categories. The occurrence of the Weibull-shape parameter was very similar for coastal and maritime clouds, for which a large number of occurrences were found in the range of m-2.0, which corresponds to relatively broad and positively skewed spectra. On the other hand, in continental clouds, the modal occurrence was of the order of 3.0, which corresponds to narrow distributions, with skewness close to or even lower than zero. Urban clouds exhibited a peak of occurrences about ms2.5. Table 7 shows average values of m and corresponding standard deviations for each cloud group.
In conclusion, the clouds were separated into different regimes and a dependence of
the shaperwidth parameters on the cloud type became apparent. Lognormal and
n. The Weibull-fitting has advantages, since it was more suitable for all cloud types and, as the lognormal distribution, allows an easy distinction between the shape of maritimercoastal and continentalrurban spectra.
7. Small-scale spectrum shape variability
Ž .
Observations at very fine scales e.g., Brenguier, 1993 suggest that the turbulence in clouds acts to generate filaments that are stretched down to the viscous scale where the
Ž y3. Ž y3.
Fig. 8. Time series of droplet number concentration in cm and liquid water content in gPm for clouds
Ž .
Ž .
Fig. 8 continued .
Ž .
actual mixing takes place. Telford et al. 1993 discuss the role that differential droplet settling have in modifying the blending process to approach the one resulting from homogeneous mixing. Such a complex scenario, of course, cannot be accessed from observations at a coarse scale, as in the Ceara experiment. In most cloud models,
´
homogeneity is assumed in a grid cell, and this is very similar to the one provided by observations in a scale of several meters to a few tens of meters. Therefore, despite the limitations of such a kind of analysis, the investigation of the variability of cloud spectraŽ .
Ž .
Fig. 8 continued .
achieve more realistic representations in the microphysical parameterizations in cloud-resolving and LES models.
Ž .
The ‘‘coarse microstructure’’ from FSSP data processed at 10 Hz of four clouds is going to be examined in this section, in order to illustrate the diversity of shapes of droplet spectra. The measurements in all clouds were performed during the same flight
Ž940202-2, see Section 3 for the flight description , which allows one to assume similar.
large-scale environmental conditions. A summary of the cloud properties is presented in
Ž
Ž .
Fig. 8 continued .
.
continental and urban , however they exhibited similar horizontal dimensions and maximum LWCs. Also, they were penetrated in similar altitudes.
Ž .
As shown by several authors e.g., Paluch, 1979 , cumulus clouds exhibit significant
Ž .
variations in their microphysical as well as dynamic and thermodynamic structures, often showing abrupt transitions. Fig. 8 depicts the variation of the number concentra-tion and LWC inside clouds 1–4, which shows a behavior similar to the one found in
Ž
shallow cumuli by other authors. In each cloud, a particular sector delimited by lines in
.
In the selected portion in panel 8a, two regions of relatively high values of the droplet concentration and LWC are separated by a ‘‘hole’’, in which both quantities drop dramatically. The corresponding droplet spectra are depicted in Fig. 9a. A roughly uniform spectrum shape, with relatively large modal diameter characterizes the first of those two regions. The second region, on the other hand, comprises a more variable set of spectrum shapes, including near-exponential and bimodal spectra. In general, the modal diameter is smaller and the spectra are broader than in the first region. All those spectra were well represented by gamma, lognormal and Weibull distributions. The shaperwidth parameters of the corresponding fitted spectra are depicted in Fig. 9b, c and d. In agreement with the statements presented above, the shape parameter of the gamma-fitted spectra are higher in the first region, oscillating about ;9, dropping to values of the order of 5 in the second region. Also, the width of the lognormal-fitted
Ž .
spectra is smaller in the first region and larger and also more variable in the second region. The Weibull-shape parameter, as in every case, is strongly correlated with the gamma-shape parameter, ranging from approximately 3.0 to about 3.5 in the first region, dropping in the second region.
Ž
The selected sector in cloud 2 has almost uniform concentration ranging from 202 to
y3. Ž
242 cm , despite a significant variation in the LWC between 0.243 and 0.554 g
y3.
m . The cloud spectra for that region are depicted in Fig. 10a, along the parameters
Ž . Ž . Ž .
for the corresponding gamma Fig. 10b , lognormal Fig. 10c and Weibull Fig. 10d distributions. It should be pointed out that most of the fitted spectra barely matched the quality criterion established in Section 3, because they were often plateau-shaped or bi or multimodal. The borders of the selected sector were characterized by the significant presence of small droplets and, as a consequence, the corresponding gamma and Weibull
Žlognormal - fitted spectra showed small large shape width parameters. In between,. Ž . Ž .
the spectra were narrower, very similar to each other, and consistently bimodal. The selected portion of cloud 3 starts close to a relative minimum of droplet concentration and LWC. With the exceptions of a couple 10-Hz samples, the concentra-tion is close to or greater than 250 cmy3 while the LWC passes from small values to a plateau about 0.4 g my3, with small variations, decreasing to more variable values around 0.3 g my3. The changes in the shape of the cloud spectra follow the ones in the
Ž .
LWC field Fig. 11 . The transitional region from small to high LWCs is filled with
Ž .
bimodal spectra, which were barely fitted by gamma lognormal distributions with
Ž .
small shape large width parameters. Most of the spectra in the region of high LWCs
Ž
were relatively narrow, allowing better fittings by gamma distributions with shape
. Ž
parameters between 12 and 16 , lognormal distributions with width parameters close to
. Ž .
1.3 and Weibull distributions with shape parameters between 3 and 4 . The last region
Žintermediate, variable LWC was filled broader spectra some bimodal , for which the. Ž .
Ž .
fittings resulted in smaller gamma-shape and Weibull-shape larger lognormal-width parameters.
Ž . Ž . Ž .
Ž .
Ž .
Ž .
Cloud 4, which was penetrated over the continental landmass, was characterized by a dominance of narrow and peaked spectra, as in the selected region in panel 8d. Fig. 12
Ž .
shows the cloud spectra Fig. 12a and the corresponding shaperwidth parameters. The
Ž .
occurrence of very large gamma-shape parameters sometimes larger than 30 and also
Ž .
large Weibull-shape parameters often higher than 5 is an indication of the occurrence of narrow, peaked, almost non-skewed spectra.
Ž
Despite the differences associated with the air mass types for instance, cloud 4,
.
which was penetrated over land, presented the narrower spectra , clouds 1–4 showed a similar behavior. In all of them, the changes in the spectrum shaperwidth are associated with changes in the droplet concentration and the LWC. In some cases, as in cloud 2 and cloud 3, nearly constant concentrations were accompanied by significant variations in the LWC and the shape of the droplet size distribution. It suggests that transitions in the shape of droplet size distributions in clouds be more closely related to LWC variations rather than to concentration changes.
Bimodal, multimodal and broader spectra were observed near cloud holes, in cloud portions with lower LWC, or in transitional regions in clouds. Therefore, there are indications that mixing plays a major role to generate variability in the spectrum shapes. As it will be discussed in the Section 8, other processes associated with the cloud dynamics and microphysics are also important to the evolution of the shape of cloud spectra.
8. Bulk-microphysics parameterizations, physical processes in clouds and droplet spectrum variability
From the results presented in Section 5 it became obvious that the use of analytical functions as the Weibull, gamma and lognormal as basis for bulk-microphysics parame-terizations is able to provide a better representation of actual droplet cloud spectra in shallow cumuli than simple approximations of monodispersive or exponential spectra. Probably, this is also true for other types of hydrometeors and different species of clouds. Uniquely, the Weibull distribution fitted more spectra than any other function tested in this paper. One advantage of the Weibull over, for instance, the gamma distribution, is that, while gamma distributions are always positively skewed, Weibull distributions can be positively or negatively skewed.
However, from a practical viewpoint, Weibull, gamma or lognormal-based parameter-izations still have, in general, a severe limitation, associated with the prescribed shape or width parameter. Because there is a large variety of spectrum shapes, usually one is not able to properly represent every spectrum using a single, prescribed value for those parameters. Among all the tests using fixed shaperwidth parameters, the best results were found in the one in which a Weibull-shape parameter equal to that predicted by Liu
Ž . Ž .
et al. 1995 for a maximum likelihood distribution 3.0 was used. However, even in that case, a significant fraction of the observed spectra were not properly fitted.
Ž
suggested to improve Weibull, gamma or lognormal-based parameterizations listed
.
below .
Ž .1 Estimate an average shaperwidth parameter from a given CCN distribution. As shown in Section 5, a dependence of those parameters was found, on the air mass type in which the clouds form. The use of different shape parameters according to the CCN field can allow the differences between maritime, continental, and polluted clouds to be represented. Of course, one would have to find a simple relation between the character-istics of the CCN field, such as CCN concentration, and the shaperwidth of fully developed cloud spectra. Experimental and modeling studies could give this a support.
Ž .2 Use prognostic equations for the shaperwidth parameters or diagnose them from the characteristics of the air parcel, including its history. The results in the previous section suggest that the most important factors that drive the droplet spectrum shape, at least in shallow cumulus clouds, are the dynamical and microphysical processes associated with the cloud life cycle itself. The most apparent problem in a
bulk-para-Fig. 13. Initial spectra, corresponding to gamma-distributions N sN s300 cmy3, n sn s10.0, and
t1 t2 1 2
y3 Ž . y3 Ž . Ž . Ž Ž . Ž .. Ž .
ql1s0.5 g m thin line and ql2s1.5 g m thick line a , N D1 qN D2 r2 thin line and
Ž . Ž . Ž .
meterization with evolving spectrum shaperwidth is that those parameters area not ‘‘conservative’’, as the concentration, mixing ratio, etc. Also, the influence of physical processes such as mixing, condensationrevaporation, collisionrcoalescence, etc., can be extremely complicated.
In this paper, two examples are shown, in which the spectrum shape is changed by mixing and condensation. Gamma-distributions are going to be used as ‘‘initial condi-tions’’ and to fit the resulting spectra. The reason of the choice is because gamma-based parameterizations are more popular than lognormal or Weibull-based schemes, but the same analysis could be extended to different sets of basis-functions.
First, suppose that two cloudy parcels with identical masses and volumes are mixed and that condensation, evaporation or collision–coalescence can be neglected. Let their respective number concentrations, LWCs and distribution-functions N and N , qt1 t2 l1and
Ž . Ž .
q , and N D and N D . In this rather simplified scenario, the resulting total numberl2 1 2 concentration, the LWC and the distribution-function of droplets can be approximated as
ŽNt1qNt2.r2, qŽ l1qql2.r2 and N DŽ 1Ž .qN D2Ž ..r2. Consider the case in which the two initial spectra are both gamma-distributions, such that Nt1sNt2s300 cmy3,
ql1s0.5 gmy3 and ql2s1.5 g my3, andn1sn2s10.0, depicted in Fig. 13a. It can be
Ž
proved that the best gamma-fitting for the spectrum resulting from the mixing Nts300
y3 y3. Ž Ž . Ž ..
cm , qls1.0 g m is achieved for ns7.1. In Fig. 13b, N D1 qN D2 r2 is
compared with both the fittings using ns7.1 andnsn1sn2s10.0. In this case, the mixing produced a spectrum that could be fitted using a lower shape parameter; however, the use of the same parameter of the initial distributions would not produce huge errors.
Second, suppose that a distribution of droplets is allowed to grow by condensation only, producing a spectrum that is narrower, with a larger modal diameter. Consider the case in which the initial spectrum corresponds to a gamma-distribution, characterized by the parameters that Ns300 cmy3, qs0.5 g my3 and ns10.0. If the droplets grow
t l
by condensation to a final LWC qs1.5 g my3, good fittings for the resulting spectrum l
Fig. 14. Initial spectrum, corresponding to a gamma-distribution with Ns300 cmy3, qs0.5 g my3 and
t l
Ž . Ž . Ž
ns10.0 thin solid line , final spectrum line with black circles , and gamma-fittings using ns10.0 thick
. Ž .
Ž .
can only be achieved using shape parameters as high as 56.9 best possible fitting . In this case, the use of a constant n is obviously a bad assumption, producing very large errors. The initial and final spectra and the fittings using ns10.0 and ns56.9 are shown in Fig. 14.
Ž .3 Use multiple basis-functions. As reported by several authors and shown in the previous section, droplet spectra often exhibit multiple modes. Therefore, even predict-ing the shape or width parameter, bimodal and multimodal distributions would not be allowed using a single gamma or lognormal basis function. Of course the use of more than 2 or 3 basis functions can make the bulk-microphysical scheme computationally
Ž .
expensive as a bin-resolving scheme and virtually untreatable. Also, due to the complexity, it seems unfeasible to adopt both procedures 2 and 3 simultaneously.
9. Summary and concluding remarks
A major field campaign was carried out in Ceara, northern NEB, in which microphys-
´
ical measurements were performed in trade-wind cumulus clouds. Data from selected flights in such a campaign were analyzed in this paper. Significant differences were observed among clouds formed over different regions of the state. The well-known effect of the continent was verified, as well as the strong changes in the microstructure of clouds formed over Fortaleza, the capital of the state. A cloud classification, comprising four different cloud regimes was proposed: maritime, coastal, continental, and urban. In fact, it was observed that, on average, the so-called urban clouds exhibited the largest maximum droplet number concentrations among all the cloud categories. They were followed by continental, coastal, and maritime clouds. In essence, an opposite trend was verified regarding the observed maximum mean droplet diameters. Small liquid water contents were found in the majority of the samples, indicating that only a very small fraction of them correspond to active, near-adiabatic updrafts. The small values of LWC observed particularly in the urban category suggested that the data were not contaminated by ‘‘enhanced convection’’, associated with ‘‘urban heat island’’Ž .
effects. Along with the results of Coelho et al. 1998 , it indicates that the intensified aerosol production in Fortaleza is actually the primary cause of changes in the microstructure of ‘‘urban’’ clouds.
The variability of droplet spectra in shallow cumuli was investigated, as well as the feasibility of different types of analytical functions to represent actual droplet spectra. It was shown that Weibull, gamma and lognormal-distributions are able to provide reasonable fittings for most spectra, while the exponential function is a very bad representation for most of the cases. Furthermore, the Weibull-fitting was superior in comparison to the gamma and lognormal fittings, which reinforces the theoretical
Ž .
arguments by Liu et al. 1995 . However, because the variability in the droplet spectra
Žand probably in other hydrometeor spectra is so large, Weibull, gamma or lognormal-.
the similar limitations, the use of Weibull-distributions with prescribed shape was shown to be more attractive.
The cloud spectrum shape varies due to the distinct characteristics of CCN associated with different air masses. However, it was shown that dynamical and microphysical
Ž
processes on the cloud scale mixing and entrainment, condensationrevaporation,
.
collisionrcoalescence, precipitation, etc. are even more important to generate droplet spectrum shape variability. The very simple example of pure condensational growth of a population of droplets illustrated how the assumption of constant shaperwidth parame-ter in bulk-microphysics scheme can indeed lead to significant errors.
Finally, the possibility of the formulation of bulk-parameterizations using Weibull, gamma or lognormal distributions in a higher level of complexity is suggested. Although it is not clear what is the optimum degree of sophistication, the results from the fittings suggest that it might be beyond the use of prescribed, single-valued shaperwidth parameters. The basic ideas presented in this paper to improve Weibullrgammar
lognormal-based parameterizations are the development of parameterizations in which the shape of the spectra is allowed to vary, and the use of the superposition of basis functions to properly represent bi and multimodal spectra. Of course, the issue of the viability of those formulations requires further investigation.
Acknowledgements
The authors gratefully acknowledge to the Department of Atmospheric Science of the
Ž .
University of Wyoming and Dr. Jean-Louis Brenguier METEO-FRANCE for
permis-Ž
sion to use processing data software. We wish to thank FUNCEME Fundac
¸
ao Cearense˜
.
de Meteorologia e Recursos Hıdricos for providing the aircraft to the 1994 Ceara
´
´
Ž
Experiment, which was partially supported by Brazilian sponsors CNPq Conselho
. Ž
Nacional de Desenvolvimento Cientıfico e Tecnologico
´
´
and FUNCAP Fundac¸
ao˜
.
Cearense de Amparo a Pesquisa . Special thanks go to Mr. Francisco Geraldo M.
`
Pinheiro and Mr. Glenn W. Munroe for the valuable work on the calibration of the mounted instruments and data processing. Comments from anonymous reviewers helped to improve the manuscript.References
Austin, P.H., Baker, M.B., Blyth, A.M., Jensen, J.B., 1985. Small-scale variability in warm continental cumulus clouds. J. Atmos. Sci. 42, 1123–1138.
Baumgardner, D., 1983. Analysis and comparison of five water droplet measuring instruments. J. Clim. Appl. Meteorol. 22, 891–910.
Baumgardner, D., 1985. Evaluation of the forward scattering spectrometer probe: Part 2. Correction for coincidence and dead-time losses. J. Atmos. Oceanic Technol. 2, 626–632.
Brenguier, J.-L., 1989. Coincidence and dead-time corrections for particle counters: Part II. High concentration measurements with an FSSP. J. Atmos. Oceanic Technol. 6, 585–598.
Brenguier, J.-L., Amodei, L., 1989. Coincidence and dead-time corrections for particle counters: Part I. General mathematical formalism. J. Atmos. Oceanic Technol. 6, 575–584.
Brenguier, J.-L., Grabowski, W.W., 1993. Cumulus entrainment and cloud droplet spectra: a numerical model within a two-dimensional framework. J. Atmos. Sci. 50, 120–136.
Coelho, A.A., de Oliveira, C.J., Brenguier, J.L., Sampaio, A.J.C., de Oliveira, J.C.P., 1998. A preliminary analysis of the effects of Northeast Brazilian CCN on clouds microstructure. In: Proceedings of the AMS Conference on Cloud Physics. .
Costa, A.A., Almeida, G.P., Sampaio, A.J.C., 2000. A bin-microphysics cloud model with high-order, positive-definite advection. Atmos. Res., submitted for publication.
de Almeida, F.C., Munroe, G.W., Morales, C.A.R., Pereira, M.C., Barros, F.A., Sampaio, A.J.C., de Oliveira, J.C.P., 1992. An instrumented aircraft for tropical precipitation physics research: description and opportu-nity. WMP report 19, 145–150.
de Oliveira, C.J., Costa, A.A., Sampaio, A.J.C., de Oliveira, J.C.P., 1996. Climatology and microphysical characteristics of cumulus clouds of Ceara State in the Northeast region of Brazil. In: Proceedings of the´
12th International Conference on Clouds and Precipitation, Zurich 2 pp. 975–977.
Dye, J.E., 1984. Evaluation of the forward scattering spectrometer probe: Part 1. Electronic and optical studies. J. Atmos. Oceanic Technol. 1, 329–344.
Feingold, G., Stevens, B., Cotton, W.R., Walko, R.L., 1994. An explicit cloud microphysicsrLES model designed to simulate the Twomey effect. Atmos. Res. 33, 207–233.
Feingold, G., Walko, R.L., Stevens, B., Cotton, W.R., 1998. Simulations of marine stratocumulus using a new microphysical parameterization scheme. Atmos. Res. 47–48, 505–528.
Ferrier, B.S., 1994. A double-moment multiple-phase four-class bulk ice scheme: Part I. Description. J. Atmos. Sci. 51, 249–280.
Hall, W.D., 1980. Detailed microphysical model within a two-dimensional dynamic framework: model description and preliminary results. J. Atmos. Sci. 37, 2486–2507.
Hudson, J.G., 1993. Cloud condensation nuclei. J. Appl. Meteor. 32, 596–607.
Ž .
Knollenberg, R.G., 1981. Techniques for probing cloud microstructure. In: Hobbs, P.V., Deepak, A. Eds. , Clouds, Their Formation, Optical Properties, and Effects. Academic Press, 494 pp.
Kogan, Y.L., 1991. The simulation of a convective cloud in a 3-D model with explicit microphysics: Part I. Model description and sensitivity experiments. J. Atmos. Sci. 48, 1160–1189.
Lin, Y.-L., Farley, R.D., Orville, H.D., 1983. Bulk parameterization of the snow field in a cloud model. J. Clim. Appl. Meteorol. 22, 1065–1092.
Liu, Y., 1998. On size distributions of cloud droplets growing by condensation: a new conceptual model. J. Atmos. Sci. 55, 527–536.
Liu, Y., You, L., Yang, W., Liu, F., 1995. On the size distribution of cloud droplets. Atmos. Res. 35, 201–216.
Mason, J.B., 1971. The Physics of Clouds. Clarendon Press, Oxford, 358 pp.
Meyers, M.P., Walko, R.L., Harrington, J.Y., Cotton, W.R., 1997. New RAMS cloud microphysics parameter-ization: Part II. The two-moment scheme. Atmos. Res. 45, 3–39.
Ogura, Y., Takahashi, T., 1973. Numerical simulation of the life cycle of a thunderstorm cell. Mon. Weather Rev. 99, 891–895.
Paluch, I.R., 1979. The entrainment mechanism in Colorado cumuli. J. Atmos. Sci. 36, 2467–2478. Pruppacher, H.R., 1998. Microphysics of Clouds and Precipitation. 2nd edn. D. Reidel, 954 pp.
Reisner, J., Rasmussen, R.M., Bruintjes, R.T., 1998. Explicit forecasting of supercooled liquid water in winter storms using the MM5 mesoscale model. Q.J.R. Meteorol. Soc. 124, 1071–1107.
Rutledge, S.A., Hobbs, P.V., 1984. Mesoscale and microscale structure and organization of clouds and precipitation in midlatitude cyclones: Part XII. Diagnostic modeling study of precipitation development in narrow cold frontal bands. J. Atmos. Sci. 41, 2949–2972.
Soong, S.-T., 1974. Numerical simulation of warm rain development in an axisymmetric cloud. J. Atmos. Sci. 31, 1262–1285.
Squires, P., Twomey, S., 1966. Comparison of cloud nucleus measurements over central North America and the Caribbean Sea. J. Atmos. Sci. 23, 401–404.
Telford, J.W., Kim, K.-E., Keck, T.S., Hallet, J., 1993. Entrainment in cumulus clouds: II. Drop size variability. Q.J.R. Meteorol. Soc. 119, 631–653.
Twomey, S., Wojciechowski, T.A., 1969. Observations of the geographical variations of cloud nuclei. J. Atmos. Sci. 26, 684–688.
Tzivion, S., Feingold, G., Levin, Z., 1989. The evolution of raindrop spectra: Part II. Collisional collectionrbreakup and evaporation in a rainshaft. J. Atmos. Sci. 46, 3312–3327.
Walko, R.L., Cotton, W.R., Meyers, M.P., Harrington, J.Y., 1995. New RAMS cloud microphysics parameter-ization: Part I. The single-moment scheme. Atmos. Res. 38, 29–62.
Warner, J., Twomey, S., 1967. The production of cloud nuclei by cane fires and the effect on cloud droplet concentration. J. Atmos. Sci. 24, 704–706.
Wyant, M.C., Bretherton, C.S., Rand, H.A., Stevens, D.E., 1997. Numerical simulations and a conceptual model of the stratocumulus to cumulus transition. J. Atmos. Sci. 54, 168–192.