SIMPLE APPROACHES TO IMPROVE THE AUTOMATIC INVENTORY OF ZEBRA
CROSSING FROM MLS DATA
P. Arias a, B. Riveiro b, M. Soilán a, L. Díaz-Vilariño a, J. Martínez-Sánchez a
a
Applied Geotechnologies Group, Dept. Natural Resources and Environmental Engineering, University of Vigo, Campus Lagoas-Marcosende, CP 36310 Vigo, Spain (parias, msoilan, lucia, joaquin.martinez)@uvigo.es
b
Applied Geotechnologies Group, Dept. Materials Engineering, Applied Mechanics and Construction, University of Vigo, Campus Lagoas-Marcosende, CP 36310 Vigo, Spain – [email protected]
Commission III, WG III/4
KEY WORDS: Point clouds, LiDAR, Automatic Processing, Traffic signs, Road Inventory, 3D Modelling.
ABSTRACT:
The city management is increasingly supported by information technologies, leading to paradigms such as smart cities, where decision-makers, companies and citizens are continuously interconnected. 3D modelling turns of great relevance when the city has to be managed making use of geospatial databases or Geographic Information Systems. On the other hand, laser scanning technology has experienced a significant growth in the last years, and particularly, terrestrial mobile laser scanning platforms are being more and more used with inventory purposes in both cities and road environments. Consequently, large datasets are available to produce the geometric basis for the city model; however, this data is not directly exploitable by management systems constraining the implementation of the technology for such applications.
This paper presents a new algorithm for the automatic detection of zebra crossing. The algorithm is divided in three main steps: road segmentation (based on a PCA analysis of the points contained in each cycle of collected by a mobile laser system), rasterization (conversion of the point cloud to a raster image coloured as a function of intensity data), and zebra crossing detection (using the Hough Transform and logical constrains for line classification). After evaluating different datasets collected in three cities located in Northwest Spain (comprising 25 strips with 30 visible zebra crossings) a completeness of 83% was achieved.
1. INTRODUCTION
Cities are increasingly large and complex areas that require integrated technologies for an effective management and to ensure productivity, continued economic growth and environmental sustainability. The city management is increasingly supported by information technologies, leading to paradigms such as smart cities, where decision-makers, companies and citizens are continuously interconnected. 3D modelling turns of great relevance when the city has to be managed making use of geospatial databases or Geographic Information Systems. In this sense, the new concepts of 3D modelling not accounting only for geometry but also for semantic and topologic data became of essential importance. Standard schemas such as cityGML contribute to define how 3D models need to be structured in order to be used under an interoperable perspective. On the other hand, laser scanning technology has experienced a significant growth in the last years, and particularly, terrestrial mobile laser scanning platforms are being more and more used with inventory purposes in both cities and road environments. Consequently, large datasets are available to produce the geometric basis for the city model, however, this data is not directly exploitable by management systems constraining the implementation of the technology for such applications.
In the last times, an intense activity on automating data processing has been reported by the literature. Serna and Marcotegui (2014) published an interesting review of methods that focused on urban environments, including several approaches for tackling the detection, segmentation, and classification of urban objects. Intense work in the detection an classification of road markings has been published in the laset years (Hervieu et al., 2015; Kumar et al., 2014; Guan et al.,
2014). Different approaches such as the creation of images (Zhu et al., 2010), voxelization (Douillard et al., 2011), mathematical morphology (Hernández and Marcotegui, 2009) may contribute to the detection of urban objects from point cloud data. Classification requires more complex approaches after extracting appropriate descriptors for objects. An example is the usage of decision trees with support vector machine (SVM) algorithms as proposed by (Owechko et al., 2010; Golovinskiy et al., 2009).
This work presents different approaches to automatically detect and classify urban objects such as traffic signs and markings from large LiDAR datasets. Particularly, it will be shown how reducing data to 2D space can contribute for an efficient and robust segmentation of the 3D data. Also, using rasterization approaches permits the application of well-validated image processing algorithms (such as mathematical morphology, the Generalized Hough Transform, clustering algorithms, etc.) that contribute to a more robust segmentation of point clouds.
In the case of road marking, an algorithm was developed that consists of several subsequent processes starting with a road segmentation by performing a curvature analysis for each laser cycle, then intensity images are created in order to detect zebra crossing using the Generalized Hough Transform and logical constrains. To optimize the results, image processing algorithms are applied including binarization, median filtering, and mathematical morphology operations. Once the road marking is detected its position and orientation are calculated with inventorying purposes using Geographic Information Systems.
Real scenarios are scanned using the Mobile Laser Scanners (on-the-fly mode) and used to test the methods and algorithms presented in the paper. The initial results are promising, with The International Archives of the Photogrammetry, Remote Sensing and Spatial Information Sciences, Volume XL-3/W3, 2015
efficiency ratios over 83%. The accuracy of the results, as well as the acceptable computation time, recommend extending the approaches developed in this paper for traffic signs to other objects of the city. Additionally, by appropriately structuring the segmentation results using the cityGML schema eases the implementation of the MLS technology for the extensive inventory and 3D modelling of cities and their components.
2. METHODOLOGY
The main steps of the algorithm for automatic data extraction of zebra passes position and orientation are shown in figure 1. Next, the main processes of the algorithm are described which were implemented using Matlab software.
Figure 1. General workflow of the proposed algorithm for zebra crossing detection.
2.1 Road Segmentation
The principal component analysis (PCA) is a mathematical procedure that seeks to reduce the dimensionality of a set of variables to a new set of variables (principal components) that are linear combinations of the initial variables and are also uncorrelated to each other. In this work, a PCA is used in order to detect geometric changes into the profile defined by the points contained in each scanner line (each cross-section generated by the scanner when rotating 360º) [13, 15].
Since the data of each cross-section is represented into 2D space, analysis is performed using the altitude of each point (Z coordinate) and deflection angle. These two variables allow to easily detecting peaks denoting the transversal limits of the road when PCA analysis is performed into the local neighbourhood (10 points) of each of the points contained in each scanner cross-section. Figure 2 shows the value of the second eigenvalue in the PCA analysis (using 2 variables: z coordinate and deflection angle) with respect to deflection angle. As can be seen, in the range of angles than correspond to road the second eigenvalue is almost zero, and peaks appear at those points corresponding to the borders of the road.
Figure 2. Segmentation of road points using a peak detection based on the second eigenvalue during PCA analysis of a cross section of the road.
Figure 3a presents an example of point cloud to be segmented. After applying the filter to each individual cross section of the road, an irregular segmentation may happen in those cross sections where other objects alter the profile of the street to the segmentation does not happen in a coherent manner as shown in figure 3b. To improve the segmentation avoiding the effect caused by cars or other objects in the street, the angle of segmentation was averaged having into account the precedent cross-sections. Figure 3c shows the sample point cloud after correcting the angle of partition.
Figure 3. Segmentation of road from the original point cloud: a) original point cloud; b) noise segmentation evaluating each laser cross-section; c) improved segmentation averaging the angles of
segmentation with the angles of precedent cross-sections.
Once the road is segmented from the rest of the point cloud this down sampled point cloud is partitioned into strips of the same length in order to normalize the data processing. A length of 18 m was established for each strip, which is computed from the navigation data provided by the Mobile Laser Scanner used to collect the data.
An overlap of 50% between adjacent strips is programmed to avoid the loss of relevant information about the urban parts (i.e. zebra crossings). Figure 4 shows an example of road cutting in strips. For example, the zebra crossing is completely recorded in strip 7. However, if only strips 6 and 8 would be acquired, the data will not provide the complete information from the zebra crossing so the road marking would be hardly detected. The International Archives of the Photogrammetry, Remote Sensing and Spatial Information Sciences, Volume XL-3/W3, 2015
Figure 4. Example of road segmentation and strips with overlap of 50 %.
2.2 Point cloud rasterization
Point cloud data show geometric and radiometric information that can be easily converted in an image by applying image processing algorithms. The radiometric information of each coordinate comes from the reflective intensity of the laser light and depends on the distance between laser emitter and target surface, reflection angle, and target reflectivity. The painted road, as occurs in a zebra crossing, gives high reflectivity in comparison to their surroundings. This characteristic will be used to transform the point cloud data from the road to 2D imaging data.
The first step in road rasterization consists of the projection of the point cloud data on the plane that best fits to the road strip. Next, a nearest neighbour algorithm is used to assign the intensity data to a regular matrix created on the projection plane. The algorithm calculates the Euclidean distance between each node of the matrix and the neighbourhood points. Once the closest point is defined, the value of intensity is assigned to the node. Distance between nodes was selected to be 5 cm to have an enough spatial resolution in the images. Finally, the intensity from the images (12 bits: 0 – 4095) is normalized between 0 and 1. Figure 5 shows an example of the rasterized data.
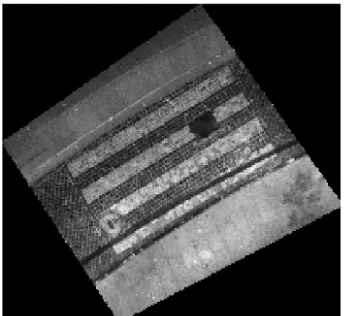
Figure 5. Example of the raster image of a zebra crossing from a point cloud.
2.3 Image preparation
Image processing techniques are used in this step of the algorithm in order to ease the detection of the road marks, particularly zebra crossing. Road marking detection is based on the higher reflectivity of the element and in the characteristic parallel lines of the edges between the painting area and the pavement.
The first step to detect reflective paintings consists of the noise reduction applying a median filter (figure 6b). Then threshold is applied to the previously filtered image. The thesholding is calculated using the Otsu method (Otsu, 1979), which chooses the threshold that minimize the intraclass variance of the black and white pixels (figure 6c).
Figure 6. Image processing to detect reflective painted marks. A intensity image; b) filtered image using median filter; c) binary image using the Otsu method.
To improve the edges of the markings Mathematical morphology is used. Particularly a closing operation (dilation followed by and erosion) of the image using a 5 x 5 square structure is performed (that correspond to a square element side length of 25cm on ground). The purpose of the closing is to fill the gaps between the pixels in the border of white marks. This morphological operation is critical to achieve robust edge detection.
The second step consists of the edge detection of the zebra crossing. Edge detection is performed using the Canny method, which finds edges by looking for local maxima of the gradient of the image. The gradient is calculated using the derivative Gaussian filter. As it can be observed in Figure 7 (left), edges appear very thin. To improve the edge thickness a dilation operation (Figure 7 – right) is performed with a square structure element (5x5).
Figure 7. Edge detection of the zebra crossing (left). Image after a dilation (right).
2.4 Line classification using Hough Transform
The last step refers to the detection of lines in a binary image using the Hough Transform. The result of detection is shown in Figure 8 where the lines detected are depicted in green. Some The International Archives of the Photogrammetry, Remote Sensing and Spatial Information Sciences, Volume XL-3/W3, 2015
lines are not detected for the constrains defined in the Hough Transform (principally lines were incomplete and their length did not satisfied the minimum length expected for a zebra crossing mark).
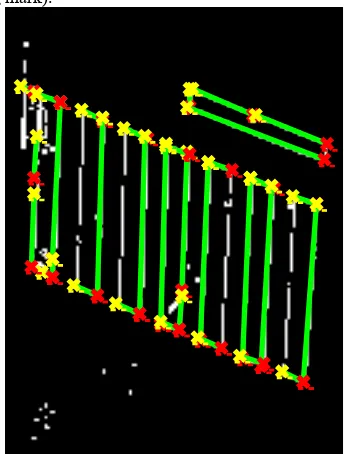
Figure 8. Line detection using the Hough Transform
To define detection of lines as a zebra crossing the authors established logical criteria. Lines represent a zebra crossing when they can be represented by a set of parallel lines with similar angle to the direction of the vehicle and with similar length. The authors establish a limit of 6 lines to avoid false positives. This threshold corresponds to a zebra pass with a minimum of 3 painting areas. The process of checking the number of lines from the Hough Transform detector counting is automatically performed.
The location of the zebra crossing is obtained from averaging the points defining the lines correctly used to identify the road mark from the HT detector. As the pixel coordinates from image come from the point cloud data, the 3D coordinates are directly obtained and the data can be transferred to Geographic Information Systems, for example to perform the inventory of a road. The direction and size of the zebra crossing is computed from the angle defined by lines and their length, respectively. Further details of the method can be seen in Riveiro et al., 2015.
3. CASE STUDIES 3.1 Study sites
Three mobile LiDAR datasets were used for this work. The mobile LiDAR survey was done without interrupting the traffic conditions using the Optech Lynx mobile mapper of the University of Vigo. In all cases the dilution of precision of the global navigation satellite system was kept below 2.5 to obtain accurate data. The acquisition frequency of the inertial measurement unit of the Optech was configured to 200 Hz to acquire an accurate trajectory data. LiDAR sensors were set up at 500 kHz (laser measurement rate) and 200 Hz (scan frequency) to provide a dense point cloud, with the maximum possible resolution.
LiDAR datasets were all collected in the Northwest region of Spain. The first dataset was collected in the Augas Férreas
Square in the city of Lugo; the second area was collected in Samil Avenue in the city of Vigo; and finally, the third dataset was registered in Progreso Street in the city of Ourense. Augas Ferreas data comprises 11 strips with a total of 34.352.512 points, Samil Avenue comprises 12 strips with 35.026.765 points, and Progreso Street has 2 strips with 6.181.733 points. An example view of the Progreso Street is shown in figure 9.
Figure 9. A 3D view of the point cloud collected in the Progreso Street (Ourense, Spain).
3.2 Instrumentation.
The mobile LiDAR used for surveying was the Optech Lynx Mobile Mapper (Figure 10). The systems consist of a navigation system with global navigation and inertial units, two LiDAR sensors and four digital cameras. All the systems are geometrically boresighted and time stamped to give an accurate point cloud from the environment after a mobile surveying. The maximum measurement range (according technical specifications from the manufacturer) is 200 m. Range precision is 8 mm and absolute accuracy 5 cm [14]. The laser measurement rate is programmable between 75 and 500 kHz. The system can detect up to 4 returns from each laser pulse. The scan frequency is also programmable between 80 and 200 Hz. The scanner field of view is 360º. It requires a power of 12 VDX and 30 A. Operating temperature ranges between -10º C and 40ºC.
Figure 10. Optech Lynx mobile mapper. Draw (right) and survey van (left).
4. RESULTS
Table 1 presents the results obtained from the 3 different study sites. A total of 30 zebra crossing were evaluated with a completeness of 83 %. The results were checked comparing the The International Archives of the Photogrammetry, Remote Sensing and Spatial Information Sciences, Volume XL-3/W3, 2015
output of the algorithm with the manual detection performed by
Table 1. Results found for the three study sites.
Figure 11 shows an example of a correctly detected zebra crossing. Some zebra crossing were not detected, although false positives are not presented in the results.
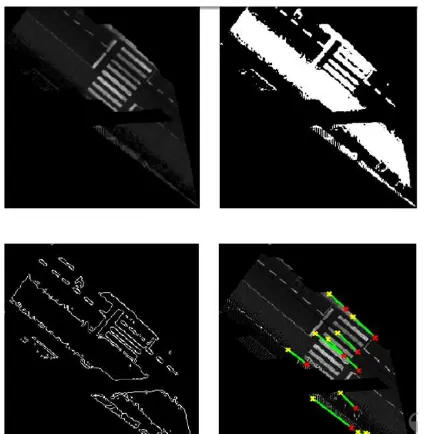
Figure 11. Correct detection of a zebra crossing in Samil contains occlusions due to vehicles above the zebra crossing in figure 12 (top – left image). As can be seen this would provoke a malfunction of the algorithm because those lines that are detected using the Hough transform would not satisfy the conditions of parallelism nor length established during the development of the algorithm.
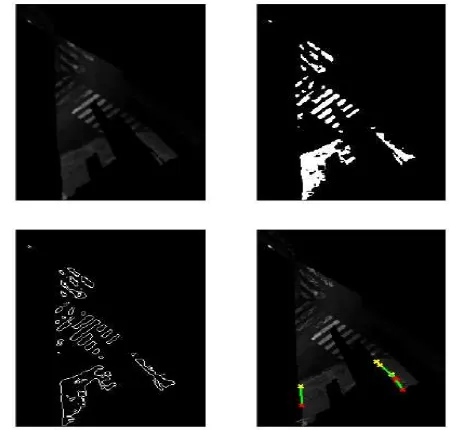
Figure 12. Malfunction of the algorithm due to occlusions of the point cloud.
In Figure 13 binarization from the image (top – right) appears slightly deficient, probably by the low reflectivity of the paint of the zebra crossing. This fact diminishes the contrast between the asphalt and the road markings, and decreases the quality of the binarization. It also affects to the edge detection operation (bottom – left) and consequently it also affects to the line detection using the Hough transform (bottom – right).
5. CONCLUSIONS
An algorithm for the automatic detection of zebra crossing is developed with the aim of automate the detection and inventory of zebra crossings. The algorithm is divided in three main steps: road segmentation (based on a PCA analysis of the points contained in each cross-section of collected by a mobile laser system), rasterization (conversion of the point cloud to a raster image coloured as a function of intensity data), and zebra crossing detection (using the Hough Transform and logical constrains for line classification).
A completeness of 83% was found when testing the algorithm over 25 strips with 30 zebra crossing. Non-detected zebra crossing were analysed and in all cases the reasons of failure come from two main reasons. The first comes from the loss of paining of the road marking due to time provoking a low contrast between the road and the zebra crossing. The second reason is motivated by occlusions caused by other vehicles in The International Archives of the Photogrammetry, Remote Sensing and Spatial Information Sciences, Volume XL-3/W3, 2015
the point cloud produced by other urban objects during the survey. All the test were done using Matlab software.
Figure 13. Malfunction of the algorithm due to a deficient reflectivity of the road paintings.
ACKNOWLEDGEMENTS (OPTIONAL)
This work has been partially supported by the Spanish Ministry of Economy and Competitiveness through the project “HERMES-S3D: Healthy and Efficient Routes in Massive Open-Data based Smart Cities (Ref.: TIN2013-46801-C4-4-R), by Xunta de Galicia (Grant No. CN2012/269). Human resources program FPI is acknowledged (Grant No. BES-2014-067736 and FPU AP2010-2969).
REFERENCES
Douillard, B., Underwood, J., Kuntz, N., Vlaskine, V., Quadros, A., Morton, P., Frenkel, A., 2011. On the segmentation of 3D LIDAR point clouds. In: IEEE International Conference on Robotics and Automation, ICRA’11, pp. 2798–2805.
Hernández, J., Marcotegui, B., 2009. Point cloud segmentation towards urban ground modeling. In: The 5th GRSS/ISPRS Joint Urban Remote Sensing Event (URBAN2009). Shangai, China, pp. 1–5.
Hervieu, A., Soheilian, B., & Brédif, M., 2015. Road Marking Extraction Using a MODEL&DATA-DRIVEN Rj-Mcmc. ISPRS Annals of Photogrammetry, Remote Sensing and Spatial Information Sciences, 1, 47-54.
Holgado-Barco A, González-Aguilera D, Arias-Sánchez P, and Martínez-Sánchez J., 2014. An automated approach to vertical road characterization using mobile LiDAR systems: Longitudinal profiles and cross-sections. ISPRS Journal of Photogrammetry and Remote Sensing 96: 28 – 37.
Kumar, P., McElhinney, C. P., Lewis, P., & McCarthy, T., 2014. Automated road markings extraction from mobile laser scanning data. International Journal of Applied Earth Observation and Geoinformation, 32, 125-137.
Golovinskiy, A., Kim, V.G., Funkhouser, T., 2009. Shape-based recognition of 3D point clouds in urban environments. In: 12th IEEE International Conference on Computer Vision, pp. 2154– 2161.
Guan, H., Li, J., Yu, Y., Wang, C., Chapman, M., & Yang, B., 2014. Using mobile laser scanning data for automated extraction of road markings. ISPRS Journal of Photogrammetry and Remote Sensing, 87, 93-107.
Owechko, Y., Medasani, S., Korah, T., 2010. Automatic recognition of diverse 3-D objects and analysis of large urban scenes using ground and aerial LiDAR sensors. In: Conference on Lasers and Electro-Optics (CLEO) and Quantum Electronics and Laser Science Conference (QELS), pp. 16–21.
Otsu, N., 1975. A threshold selection method from gray-level histograms. Automatica, 11(285-296), 23-27.
Riveiro, B., González-Jorge, H., Martínez-Sánchez, J., Díaz-Vilariño, L., Arias, P., 2015. Automatic detection of zebra crossings from mobile LiDAR data. Optics & Laser Technology, vol. 70 pp 63-70.
Serna, A. and Marcotegui, B., 2014. Detection, segmentation and classification of 3D urban objects using mathematical morphology and supervised learning. ISPRS Journal of Photogrammetry and Remote Sensing, vol 93, pp. 243–255.
Zhu, X., Zhao, H., Liu, Y., Zhao, Y., Zha, H., 2010. Segmentation and classification of range image from an intelligent vehicle in urban environment. In: IEEE/RSJ International Conference on Intelligent Robots and Systems (IROS2010), pp. 1457–1462.