IMPACT ASSESSMENT OF THE RENEWABLE ENERGIES IN THE CULTURAL
HERITAGE: THE CASE OF THE WAY OF ST. JAMES IN SPAIN
P. Chias a, *, T. Abad a
a
School of Architecture, University of Alcalá, Santa Ursula 8, 28801 Alcalá de Henares, Madrid, Spain - ([email protected]; [email protected])
Commission WG V/2
KEY WORDS: Impact Analysis, GIS, DEM/DTM, Renewable Energies, Landscape, Cultural Heritage, Spanish Way of St. James
ABSTRACT:
Medieval town centres and landscapes along the Way of St. James are being affected by renewable energy sources at the architectural, urban and territorial scales. The impact is not only visual, but thermal, accoustic and electromagnetic. Visual impact of solar photovoltaic power plants -which are placed over traditional crops close to the urban borders-, and also wind farms located at the hilltops, are sometimes remarkable. Solar photovoltaic modules are integrated into ancient roofs, and small scale wind turbines are taking up the ancient urban spaces. Among other effects on animal life and vegetation, the rise in temperature, radioelectric interferences, as well as changes in the traditional land uses are noticeable, and a deep analysis is needed. Our main target is to define an integrated methodology which considers all these effects. As a part of our project premises, we work with Open Source programs. We obtained a digital terrain model -25 m spatial resolution-, and from Corine Land Cover images we got different raster files according to our research targets. Databases where implemented from both remote sensing and measures obtained directly in the field work. We applied GIS based multicriteria decision analysis and weighted linear combination, and then we adapted GRASS tools for a better usability. Our case studies are particularly interesting due to their situation along the Spanish Way of St. James, which is an itinerary named one of UNESCO’s World Heritage Sites.
* Corresponding author.
1. INTRODUCTION
Landscape becomes an essential element of the Cultural Heritage as it is considered a construction of successive cultures. In fact, it is defined by the Europen Council defines as “every part of a territory as it is perceived by the population”, and whose character is the result of both the action and the interaction of both human and natural factors. As a consequence, cityscape is included in this concept as the result of centuries of cultural accumulation and superposition (Chias and Abad, 2012).
The first Spanish legislation concerned with the protection of the Cultural Heritage is from 1844, July 24th, when a Royal Decree (Real Orden) founded “the basis that must be considered by the provincial commissions for the historic and artictic monuments”, which were created by another Royal Decree a month before. They must gather and include all the available information about each element of the Cultural Heritage, in order to preserve it.
Current EU legislation is considered as a framework of the Spanish Law 16/1985, June 25th about the Spanish Cultural Heritage. In addition, each Autonomical Community (Comunidad Autónoma) has developed its own legislation, and considering the fact that the Way of St. James passes through five of these communities, the corresponding laws must be applied. All of them coincide with the importance of preserving the historic monuments and sites, what includes every human activity or goods that can be considered a valuable manifest of culture, and consequently deserve to be preserved and difussed. On the other hand, current legislation on impact assessment of the renewable energies facilities is particularly strength when considering the landscape, but seems to ignore its cultural essence.
Thus, landscape is gradually coming to be considered an essential resource, and therefore is a variable to be included in land planning and protection designations.
Tourism and Cultural Heritage become also important issues to be considered for the rural development. A structured method of landscape assessment, which links descriptions, classification, analysis and evaluation will provide an integrated framework within which the problem of scenic impact from the renewable energy sources can be debated and solved. Perceptual qualitative data, as well as quantitative data – such as road networks, land cover, satellite imagery, and aerial photography– are used either for purposes of site description and analysis, or for 3D modelling and GIS-based visualization work.
1.1 Renewable Energies Impact Assessment
Spain is largely concerned with advancing energy efficiency use since 2000 (EurObserv’ER, 2014). Thus, the construction of infrastructures for the new renewable energy sources along the Spanish Way of St. James was based on two main strategies: the first one supposes to move the element to another place mainly due to the construction of dams, which is a solution that is currently unaffordable; the second one implies to share the space assuming the possible changes in the landscape and the impacts at different levels.
will focus on other Spanish onshore installations –in the Tarifa area, and in Fuendetodos in the river Ebro valley– and offshore areas – such as the Gulf of Cadiz or the seashore of Santander– in order to get a wide range of involved circumstances and features.
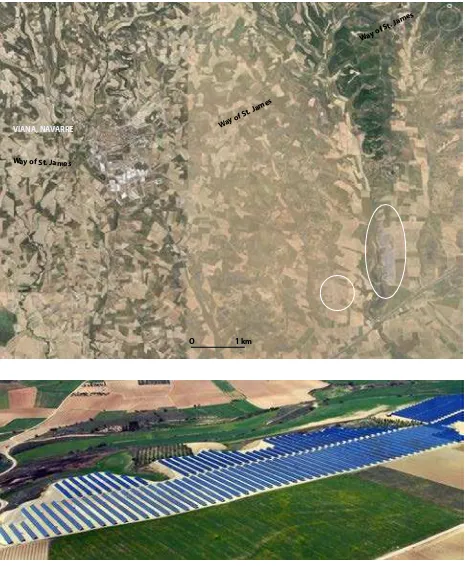
We are also working on other three case studies –a dam in Yesa (Zaragoza), and two solar photovoltaic facilities in Terradillos de los Templarios (Palencia) and in Viana (Navarra)-, which are outstanding examples of the divergences found in the application of EU, national and regional legislations, and other economic and energetic strategies.
Way of S t. James
Way of St. James
Way of S t. James
O 1 km
VIANA, NAVARRE
Figure 1. Solar photovoltaic facility in Viana (Navarre, Spain): an example of a carefully planned location that avoid the visual impact from the Way of St. James. The white ellipses show both
facilities.
1.2 Previous Perceptual Studies on Wind Farms
Most of the preceeding studies on visual impact of windfarm developments have been carried out in Denmark, the USA, the Netherlands and Great Britain (mainly in Scotland).
These early researches concentrated on investigating observers’ attitudes, as well as on the symbolic or connotative meanings of wind energy developments. They also investigated aesthetic concepts such as scale, visibility or dominance, coherence and diversity; and identified variable features such as the placement patterns of turbines –the site configurations– and the characteristics of individual turbines with respect to specific landscape types (Thayer and Freeman ,1987; Wolsink, 1990). Among the recent publications EWEA (2009, 2012), EESI (2010), Roy and Traiteur (2010), Righter (2011), and Colby et al (2009) must be mentioned. Among the recent publications EWEA (2009, 2012), EESI (2010), Papakonstantinou, Christodoulou and Soulakellis (2006), Righter (2011), and Colby et al (2009) must be mentioned.
However, these methods lack any integrated perspective of landscape assessment, relating only in part to some of the features listed above.
2. METHODOLOGY
Visual impact assessment constitutes part of the environmental impact assessment, which is defined as the set of changes in the appearance of the landscape resulting from developments that can be positive (improvements) or negative (detractions) (IEA and the Landscape Institute 1995). Neither be approached as unitary concepts, or tackled from a single point of view. The methodology that we are developing deals with the environmental impact assessment as a whole, and with the visual impact assessment in particular. As a consequence, we aim to make a systematic analysis of possible or foreseen impacts resultig from any proposed development.
We pay attention to three main approaches: geographical analysis, photographic modelling, and 3D computer modelling. All of them will cover essential aspects of the assessment such as the geographic measures of visibility, the visualization of the terrain and its potential developments, and the psycho-physical analysis of both terrain and development, based on photographic modelling.
Wind turbines, whether individual or grouped into wind farms, are usually assessed in isolation aside from any other developments in the area. Their increasing presence on hilltops, which frequently are essential landmarks in the landscape, shows the need for a cross-disciplinary methodology that integrates both qualitative and quantitative approaches into a GIS-based environmental impact assessment to be applied worldwide.
2.1 Objectives
Our essential aim is to develop a methodology which integrates both quantitative and qualitative aspects of landscape study, analysis and assessment, as well as the means that are available to predict and to mitigate the effects of any proposal at a territorial scale.
The research team is a transdisciplinary one, which includes engineers, architects, geographers, economists, and art historians.
At the final stage, and after having studied both onshore and offshore installations, our research will provide a complete and coordinated general procedure for energy enterprises and councils responsible for planning new wind energy developments. In order to test the methodology we started with an onshore case study at Navarre.
2.2 Project Planning
In order to achieve these targets, we are working on a methodology which explicitly addresses the questions of producting information, accuracy and linkage between tasks. The project planning includes the clarification of the information produced and needed by each participant, and the definition of protocols for the selection of scale and content of the databases.
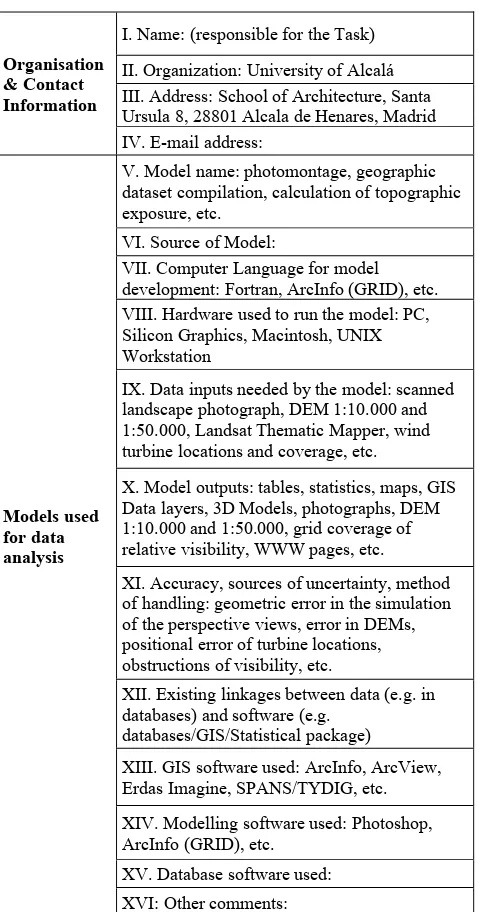
Organisation & Contact Information
I. Name: (responsible for the Task)
II. Organization: University of Alcalá III. Address: School of Architecture, Santa Ursula 8, 28801 Alcala de Henares, Madrid (Spain) VIII. Hardware used to run the model: PC, Silicon Graphics, Macintosh, UNIX Workstation
IX. Data inputs needed by the model: scanned landscape photograph, DEM 1:10.000 and 1:50.000, Landsat Thematic Mapper, wind turbine locations and coverage, etc.
X. Model outputs: tables, statistics, maps, GIS Data layers, 3D Models, photographs, DEM 1:10.000 and 1:50.000, grid coverage of relative visibility, WWW pages, etc.
XI. Accuracy, sources of uncertainty, method of handling: geometric error in the simulation of the perspective views, error in DEMs, positional error of turbine locations, obstructions of visibility, etc.
XII. Existing linkages between data (e.g. in databases) and software (e.g.
databases/GIS/Statistical package)
XIII. GIS software used: ArcInfo, ArcView, Erdas Imagine, SPANS/TYDIG, etc.
XIV. Modelling software used: Photoshop, ArcInfo (GRID), etc.
XV. Database software used:
XVI: Other comments:
Table 1. Wind Farm at Sierra de Erreniega: Project Planning Information Document template (Adapted from Macaulay Land
Use Research Institute 2011).
As the visual impact assessment is a current procedure for measuring and predicting the visual impact of some developments in natural environments, it uses limited quantitative tools such as zones of visual influence, and viewpoint analysis.
Up to now these tools were limited to manual and automated viewshed analysis and graphic representations of what the proposed facility would look like from sensitive viewpoints. Nowadays we deal with three major problems in visual landscape evaluation: the technical problem of how to visualize possible changes in the landscape; the theoretical problem of evaluation and simulation, always taking into consideration the objects in their context. It addresses spatial, quantitative and qualitative issues. Spatial issues include where the development is visible from, or more specifically, what is visible and to whom. Quantitative issues include how much of the development is visible, how much of the surrounding area is affected, and to what degree. And the qualitative issues include the visual character of the development and its compatibility with its surroundings (Fels, 1992).
Three basic functions are available in our model: a clear identification of the various types of impact, the organization of spatially and temporally dispersed inventory data, and the prediction of impact based upon potential land use decissions. A usable interface between these functions and the planner or manager, together with a set of efficient communication tools, facilitates the effective communication of potential impact on the public and on decision makers (Bishop and Hull, 1991). Finally, internal and external validity are of concern to any landscape visual assessment system. External validity reflects, in part, how well the system-generated assessments correspond to other known measures of visual quality. Internal validity reflects how well the system’s internal logic withstands testing and the violation of assumptions.
2.3 Quantitative Datasets, GIS and Geographic Analysis
The analysis carried out can be grouped into three tasks: geographic analysis, photographic modelling, and 3D modelling.
GIS are useful for building a spatial database comprising geographical features such as topography, land use, road networks, locations of public interest (such as view points), as well as the location of existing or proposed wind turbines. Geographic analysis needs to show the number of turbines that would be visible from any location within a 50 km radius, but also how clearly the turbines will be visible, and how much of the skyline they would occupy from certain view points or roads. However, nothing is ever absolutely certain in perception (different people, of different heights, with different levels of eyesight, will be able to see different numbers of turbines). Therefore some methods which assess the reliability of the analysis have been incorporated, and thereby the results can be expressed in terms of their predicted reliability. This aspect of the work is primarily related to the data rather than to the algorithms being used.
In photographic modelling view points are identified as being of particular importance for public access, or as locations from where the public would have their first clear sight of the wind farm when driving through the area. By linking the output of the GIS to a model of the view captured on camera, photographic simulations of the likely future view of the hillsides with a wind farm will be created. This technique provides the user with an illustration of likely future views, in order to aid in the subjective assessment of the acceptability of the proposed development in a visual context. The output is subsequently subjected to a psycho-physical model which provides a preference score for the scene from the number and type of features recorded by photography; then a quantitative estimate can be made of the visual impact of a single turbine or of an entire farm with respect to the observer preference.
particular time of the year. Users will be able to fly or drive through the landscape, and gain some impression of how visible the proposed wind farm may be from the main arterial roads, smaller side roads, or nearby hilltops.
2.4 GIS and 3D Graphics for digital visualisations on Cultural Heritage
Visualization provides additional easy-to-understand insights into results that were traditionally displayed as maps, line charts, diagrams, sketches, renderings, photographs, photomontages and, obviously, texts or numbers. Among them, the advantage of static simulations is that they can be realistically illustrated to near photographic quality, and they are far less expensive and laborious than dynamic simulations (Alencar and Stamato, 2011).
The new tools used to explore and expose design ideas include 3D models, animations, and interactive virtual reality environments. Computer graphics show no more than a generalization as they cannot provide all the details which can be recognized in the immediate surroundings, and they will never be able to represent the landscape as it is in reality. Thus visual simulation programmes must be considered as a support system to help the designer to outline the basic features of the environment.
Dynamic simulations using computer animations and video techniques illustrate the proposed wind farm from the point of view of a moving observer. Their advantages over static simulations are that they are not restricted to specific viewpoints, and they enable the users to select their own viewpoints. A disadvantage which can be mentioned is the necessity for sophisticated computing equipment.
GIS-based visualizations show the existing relationships between the geographical features across time and space, and facilitate the exploration of a wider ranges of possibilities.
2.5 Landscape Assessment and Evaluation
Some empirical studies found significant perceptual differences between experts and non-experts. The question has been the subject of much debate, and Nasar (1988) noted that “although experts are invaluable when used appropriately, they are a dubious source of objective judgments about what people care about in the landscape”.
In practice, the lay public’s visual reactions are often ignored by experts during the visual impact assessment studies, and also in the subsequent decision-making processes. But impact assessments based solely on professional judgment can also be problematic as they are not completely objective, and tend to be influenced by theories and concepts used in the analysis of art and architecture.
The above criticisms point to the importance of taking into consideration lay-public reactions, and any assessment made by designers should be based on ascertainable facts rather than purely on the intuitive judgments of architects and engineers. These ascertainable facts must be obtained not only from tangible observations of the physical characteristics of landscape, but also from the public response.
2.6 Case study: Wind Farm in Alto del Perdón (Navarre)
Both the ascent and the descent of this chain of hills is still a challenge to all pilgrims. This mountains are the limit between the grain-producing territories surrounding Pamplona, and the southern ones which are rich in olive, almond and fruit trees and wineyards, but that are also wooded lands. As a consequence, the historic and popular architecture of the villages changes at
both sides of the mountains of el Perdón (Mountains of Forgiveness). And due to the milder clima, windows and gates become bigger, and the inner spaces brighter.
From a historical point of view, on top of the hill there was in the 15th century a hospital, a sanctuary devoted to St. Mary and a hermitage where the only existing hermit took care of the pilgrims. Last time the hermitage was mentioned was in 1816. Zariquiegui is located at the lower part of the northern slope of the Sierra del Perdón. It was early mentioned in 1131, and in the 13th century there was a monastery in the village and the outstanding Romanesque church of St. Andrew that is still preserved. It is also noticeable by its buildings on carved stone masonry, located at both sides of the Way, and keeping the original coats of arms.
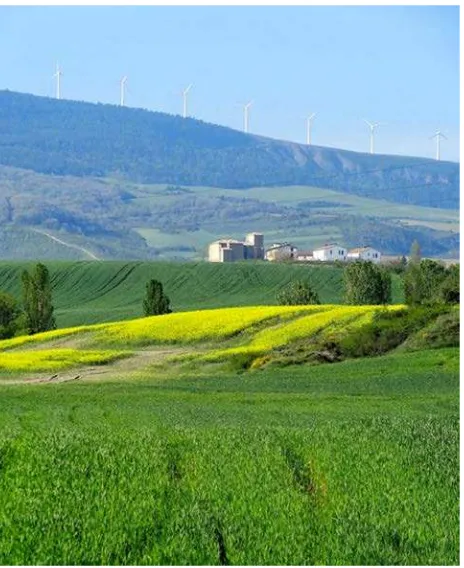
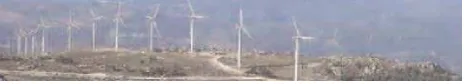
Figure 2. The wind farm as seen from the Way of St. James on top of the Alto del Perdón.
Figure 3. The Wind Farm as perceived from the northern slope of the Sierra de Erreniega. The village is Zariquiegui, a 12th
Exposed to continuous wind flows, the Sierra de Erreniega was particularly interesting for locating a wind farm. But as figures 2 and 3 show, visual impact of wind turbines from the Way of St, James and on its surrounding landscapes is really outstanding.
But the Sierra de Erreniega wind farm is a particularly interesting case study as it includes three placement patterns: rectangular, multiple clusters and lines.
Certain tasks required specialized computing facilities, but the majority of the work was not hardware dependent. Specifically, the visualization and 3D modelling work requires access to powerful graphics engines with a high capability of processing graphical images for effective visualizations of the landscape and ‘fly through’ simulations.
The software required includes in-house software for topographic exposure and error modelling, Netscape, and Open Source word processing, graphics and statistical packages (Chias and Abad, 2012).
Software Hardware Functionality
ArcInfo UNIX
Workstation
Grid : Visibility ArcPlot: Cartography for paper map
Arc View UNIX
Workstation
Screen based map output
Erdas Imagine
(VGIS) Silicon Graphics VGIS: fly-through Erdas Imagine
(Perspectives)
UNIX Workstation
Perspective view creation
Photoshop Macintosh Photomontage of turbines
MultiGen Silicon Graphics 3D model of a wind turbine
Iris Perfly Silicon Graphics Fly-through of terrain wind farm
Iris Showcase Silicon Graphics 3D model of terrain for VRML viewer Topex (Fortran
routine)
UNIX Workstation
Topographic exposure
Topo Error PC Modelling of error in
terrain models
Table 2. Software and hardware platforms used in the research.
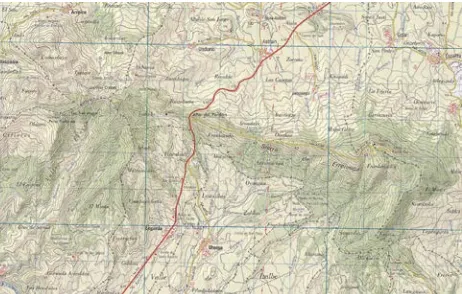
Figure 4. Sierra de Erreniega and Alto del Perdón. National Topographic Map, original scale 1:50.000. Sheet 141, det.
(Instituto Geográfico Nacional, Madrid, Spain).
The resultant digital cartography focuses on the location maps of thirty wind turbines, and is based on the digital map series of
the Instituto Geográfico Nacional of Spain. Working scales are 1:50.000 and 1:10.000.
Datasets Source
Digital Elevation Models (1:10.000, 1:50.000)
IGN (Instituto Geográfico Nacional)
Satellite imagery (Landsat
Thematic Mapper) EOSAT
Locations of wind turbines
(point details) IGN (paper maps)
Land Cover IGN (Corine Land Cover)
Spot heights IGN (digital maps)
3D model of a wind turbine Research project UAH
Road networks IGN (digital and paper maps)
Table 3. Geographic datasets and data sources.
Figure 5. DEM, 1:50.000.
As a general recommendation it is desirable for other digital data to come from common or at least widely available sources. The cartographic database and the DEM creation require a two stage process: firstly we undertake the digitilisation of the contour lines of the maps to a particular scale, where heights are recorded in only a small fraction of the total area of the intended DEM (Wilson and Gallant, 2000). Secondly, we estimate the values at all other locations by interpolation.
When implementing the static simulation techniques we combine surface models and superimposed aerial or photographic images, or satellite covers (depending on the working scale). As image-processing methods we use photographic images as a basis for simulations, manipulating them with on-screen imaging tools.
A combination of modelling and rendering software produces 3D landscapes which are the sceneries for the dynamic simulation techniques. The degree of realism of the visual displays is dependent on several factors related to the capabilities of the available software and hardware. A limitation of the configurations used is viewing 3D models with an Internet browser (Netscape): the lack of suitable software implies that the results of the 3D modelling, as presented in the Virtual Reality Modelling Language (VRML), might not be visible on all hardware platforms.
Probability predictions are defined in some data types from standard predictive equations. But before these were defined, we established the effect of database error on the results of an analysis by modelling the error so as to yield alternative versions of the data, and by deriving multiple versions of the product. This way we could examine the effects of different values of error parameters, as well as the different sources of error.
DEM
type Mean
Standard
Deviation Maximum Minimum
1:50.000 2,1003 6,9565 28 -26
1:10.000 0,5089 2,6481 26 -11,5
Table 4. Error parameters in DEMs.
Figure 6. High quality areas.
We tested that for 1:50.000 DEM data the Root Mean Square Error (RMSE) is between 2 and 3m.
The wind turbines which are in place in the study area range in height from 31m to 65m (to top of rotor arc).
Although the motion of wind turbines can be simulated using computer-generated animation, it is hardly ever used in the investigation of visual impact because simulation techniques need long image processing to achieve a realistic animation, and results lack the required reliability. Later field verification of the results to check their validity was unavoidable.
Figure 7. Fly-through of turbines simulating the previsible visual impact. The photogram of the animated sequence has been processed later using Photoshop tools in order to provide a
more realistic scenery.
The geographic analyses that were carried out are:
• The visibility census: visible land calculation was based upon a digital representation of the terrain, which provided a surface representing the relative visibility of each point on it in relation to its surroundings. A calculation of intervisibility was undertaken for each cell, which is counted only once in the DEM, and weighted according to the inverse of the distance between cells. A surrogate approach was used based upon the intervisibility of sample points from every grid cell in each DEM (1:50.000 DEM: point spacing 250m x 250m, grid cell spacing 50m x 50m,
maximum distance of view 3 km; 1:10.000 DEM: point spacing 100m x 100m, grid cell spacing 10m x 10m, maximum distance of view 1 km).
The outcome of this analysis was a scoring and ranking of relative visibility across the area studied. In general, the more enclosed an area, the fewer points would be visible, and conversely. The implementation of approach was by ArcInfo using the GRID module.
Other analyses were by the visibility levels for turbine location and height; the accumulated visibility of turbines and wind farms; the visibility of turbines with respect to the road network and the road type; the turbine locations with respect to the viewer’s horizon; the relative exposure of terrain to prevailing winds, and the accumulated visual impact of wind turbines.
2.7 Analytical discussion
The criteria that must prevail along the whole process are repeatability and transparency, practicality, and the link to landscape character.
Thus, assuming the reliability of the whole system based upon continuous feed-back processes, a further look is needed into both effectiveness and cost. According to this, two main questions must be taken into account in the following stages of the research.
The first one deals with the effectiveness of the methodology which will finally reduce costs. The scope for streamlining the data and image processing should reduce the number of platforms and software packages involved. For example, photomontages can be undertaken using Photoshop on either a PC or Silicon Graphics platforms; the topographic exposure calculations can be implemented within Idrisi on a PC platform; and a simplified fly-through can be undertaken with Erdas Imagine using the VGIS module.
The second one deals with the suitability of wind farm design. Among the placement patterns of turbines –the site configurations– the wind speed models must be taken into account. Most of the current techniques consider the available series of historical local wind-speed data, but a new perspective is opened by the use of synoptic pressure patterns using evolutionary computing (Carro-Calvo et al, 2011). A proper predictive methodology should be able to include the results of the various systems.
2.8 Conclusions
The conclusions deal with the quantitative and the qualitative aspects of the assessment.
The criteria to achieve good simulations are representativeness, accuracy, visual clarity, interest and legitimacy. Representativeness means that the simulation represents key viewpoints of the project. The accuracy is demonstrated by the similarity between the simulated image and the resulting project. Visual clarity deals with the fact that details, parts, and overall content must be clearly recognizable. By interest it is supposed that the simulation holds the attention of the viewer. And legitimacy means that a simulation must be defensible as it can be shown how it was produced, and how accurate it is. Estimation of the probabilities based on a spatially distributed model of error becomes essential.
consequently, as a decrease in people’s scenic preference of scenic quality. This consequence is consistent with the studies of Kaplan (1985), who found that coherence is directly related to preference.
Although the consideration of placement patterns was not conclusive, linear structures were rated more favourably than clusters or rectangular placements. In order to reduce the potential impact, restrictions must be imposed on hillside developments, by clustering similar wind turbines, establishing ‘free zones’ to separate clusters, and setting the turbines back from main historic ways.
Considering that motion is a unique feature of wind turbines in comparison with other renewable energy sources, they were found visually interesting as they were perceived as abstract sculptures.
Finally, the visual impact of wind turbines was perceived to be less intrusive than generally anticipated.
2.9 References
Alencar, A.L. and Stamato, L., 2011. What do people prefer and What is more effective for Maps: a Decision making Test. In Advances in Cartography and GIScience, ICA, Springer, Heidelberg, vol. 1, pp. 163-181.
Bishop, I.D. and Hull, R.B., 1991. Integrating technologies for visual resource management. Journal of Environmental Managementno. 32, pp. 295-312.
Carro-Calvo, L. et al, 2011. Extraction of synoptic pressure patterns for long-term wind speed estimation in wind farms using evolutionary computing. Energy no. 36, pp. 1571-1581.
Chias, P. and Abad, T., 2012. Open Source Tools and Cartography. Studies on the Cultural Heritage at a Territorial Scale. In: Cartography. A Tool for Spatial Analysis, InTech, Rijeka, Croatia, Chapter XII, pp. 277-294.
Chias, P. and Abad, T. 2013. Wind Farms: GIS-based Visual Impact Assessment and Visualisation Tools. Cartography and Geographic Information Science (CaGIS) no. 40 (3), pp. 229-237.
Colby, W.D. et al 2009. Wind Turbine Sound and Health Effects. An Expert Panel Review. American Wind Energy Association and Canadian Wind Energy Association. http://www.canwea.ca/pdf/talkwind/Wind_Turbine_Sound_and _Health_Effects.pdf. (15 January 2013).
Environmental and Energy Study Institute EESI, 2010. Fact
Sheet, Offshore Wind Energy.
http://www.eesi.org/files/offshore_wind_101310.pdf. (30 November 2012).
EurObserv’ER, 2014. Photovoltaic Barometer 2014, Wind Energy Barometer 2014, http://www.eurobserv-er.org (4 May 2014).
European Wind Energy Association EWEA, 2009. Wind Energy – The Facts. A guide to the technology, economics and future of wind power, Earthscan, London.
European Wind Energy Association EWEA, 2012. Wind in
power. 2011 European statistics.
http://www.ewea.org/fileadmin/ewea_documents/documents/pu blications/statistics/Stats_2011.pdf. (15 January 2013).
Fels, J.E., 1992. Viewshed simulation and analysis: an interactive approach. GIS World (7), pp. 54-59.
IEA and the Landscape Institute, 1995. Guidelines for landscape and visual impact assessment. E and FN Spon, London.
Kaplan, R., 1985. The analysis of perception via preference: a strategy for studying how the environment is experienced. Landscape Planning no. 12, pp. 161-176.
Lange, E., 1994. Integration of computerized visual simulation and visual assessment in environmental planning. Landscape and Urban Planning no. 30, pp. 99-112.
Macaulay Land Use Research Institute, 2011. Impact of Wind Turbines. http://www.macaulay.ac.uk/ccw/. (10 July 2012).
Nasar, J.L., 1988. Environmental aesthetics: theory, research and applications. Cambridge University Press.
Olagunju, A. and Gunn, J., 2013. What influences valued ecosystem component selection for cuulative effects in impact assessment?. Journal of Environmental Assessmen Policy and Management vol. 15, no. 4, doi: 10.1142/S1464333213500221.
Orland, B., 1992. Evaluating regional changes on the basis of local expectations: a visualization dilemma. Landscape and Urban Planning no. 21, pp. 257-259.
Righter, R.W., 2011. Windfall: Wind Energy in America Today. University of Oklahoma Press.
Roy, S.B. and Traiteur, J., 2010. Impacts of wind farms on surface air temperatures. Proceedings of the National Academy of Sciences of the USA PNAS no. 42, pp. 17899-17904.
Thayer, R.L. and Freeman, C.M., 1987. Altamount: public perception of a wind energy landscape. Landscape and Urban Planning no. 14, pp. 379-398.
Wilson, J.P. and Gallant, J.C., 2000. Terrain Analysis: Principles and Applications. John Wiley & Sons, New Jersey.
Wolsink, M., 1989. Attitudes, expectancies and values about wind turbines and wind farms. EWEC, Glasgow.
2.10Acknowledgements
The paper is a result of the Research Project of the Spanish Research Programme CTM2012-38241-C03-01: “Methodology for the study of the environmental impact of renewable energy technologies at a territorial scale and viability proposals”.