DTM CROSS VALIDATION AND MERGING: PROBLEMS AND SOLUTIONS FOR A
CASE STUDY WITHIN THE HELI-DEM PROJECT
Ludovico Biagi a, Laura Carcano a,*, Mattia De Agostino b
a
Politecnico di Milano – DIIAR, Geomatics Laboratory at Como Campus, Via Valleggio 11, IT-22100 Como, *(laura.carcano@mail.polimi.it)
b
Politecnico di Torino – DIATI, Corso Duca degli Abruzzi 24, IT-10129 Torino
KEY WORDS: DEM/DTM, Georeferencing, Multiresolution, Accuracy, Algorithms, Correlation
ABSTRACT:
Almost all official national cartographic bases in Europe include Digital Terrain Models (DTMs). To perform analyses at the borders between countries, transnational geographic information is needed: a transnational DTM can be obtained by merging regional DTMs (usually at low resolution) and other typically local high resolution DTMs. To be used the different DTMs must be in the same three dimensional reference frame, they must not present biases and must be consistent at the nominal scale. The following preliminary actions are required:
• 3D reference frame transformation of gridded data, • cross-validation of the regional DTMs,
• cross-check of the regional LR DTMs and the local HR DTMs.
The paper discusses the study, the implementation and the application of algorithms to solve these problems in the Alpine area between Italy and Switzerland. For this case study, the regional DTMs of Lombardy, Piedmont and Switzerland, respectively with a planimetric resolution of 20, 50 and 25 meters are available. In addition, a LiDAR DTM with a planimetric resolution of 1 meter for the Lombardy and Piedmont hydrographic basins is available. The different DTMs have been transformed to the same reference frame by applying the official national 3D transformations. The cross-validation and the cross-check of the elevation datasets have been performed. All these operations have required the implementation of novel approaches to interpolate and compare DTMs and to spatially analyze their differences.
1. INTRODUCTION
Elevation data are fundamental in Geographical Information Systems (GIS) and one of the spatial data provided by the European Directive INSPIRE (Infrastructure for Spatial Information in Europe). They are stored in Digital Elevation Models (DEM, Li et al., 2005, El-Sheimy et al., 2005), which are the basic tools for many environmental and territorial applications. DEM refers to the generic family of elevation models: they are distinguished between Digital Surface Models (DSMs), which represent the surface (including buildings, woods, etc.) and Digital Terrain Models (DTMs) which represent the elevation of bare soil. DTMs are important in Environmental Engineering, Civil Engineering and in many specific applications, such as the design of telecommunication networks or precise agriculture.
In recent years, both in Italy and Switzerland, elevation data with different reference frames, technologies, accuracies and data models have been acquired. HELI-DEM (HELvetia-Italy Digital Elevation Model) project (Biagi et al., 2011), funded by the European Regional Development Fund (ERDF) within the Italy-Switzerland cooperation program, aims at developing a unique DTM for the alpine and subalpine area between Italy (Piedmont, Lombardy) and Switzerland (Ticino and Grigioni Cantons). The DTM will be correctly georeferenced and produced validating and integrating all the available data. To meet this task with a planimetric resolution equal or better than 20 meters and the best achievable accuracy according to the available products, a recomputation of the geoid, i.e. the elevation datum, with an accuracy better than 10 cm is required (Barzaghi et al., 2007, Marti et al., 2007). Also the determination of a GNSS network for the validation and georeferencing along the border is necessary. The institutions involved in the project are: Fondazione Politecnico di Milano, Politecnico di Milano, Politecnico di Torino, Provincia
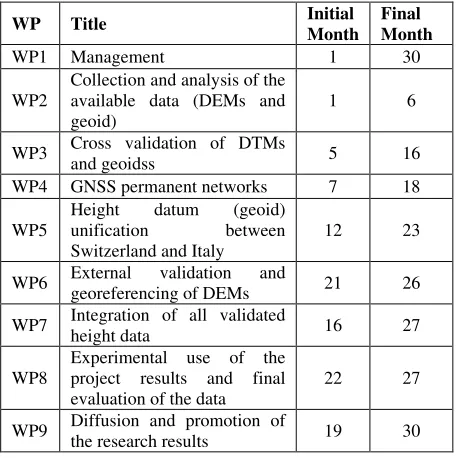
Autonoma di Bolzano, Regione Lombardia, Regione Piemonte and SUPSI (Scuola Universitaria della Svizzera Italiana). Two other institutions, SwissTopo and the Military Geographic Institute (IGM) are involved as external partners. The project is divided into nine Work Packages (WP) whose title and duration are shown in Table 1.
In the paper, the first steps of the project will be discussed: in Sect. 2 the available data are presented, in Sect. 3 the adopted strategies to cross-check the data are discussed and their application to some case studies are reported.
WP Title Initial Month
Final Month
WP1 Management 1 30
WP2
Collection and analysis of the available data (DEMs and geoid)
1 6
WP3 Cross validation of DTMs
and geoidss 5 16
WP4 GNSS permanent networks 7 18
WP5
Height datum (geoid) unification between Switzerland and Italy
12 23
WP6 External validation and
georeferencing of DEMs 21 26
WP7 Integration of all validated
height data 16 27
WP8
Experimental use of the project results and final evaluation of the data
22 27
WP9 Diffusion and promotion of
the research results 19 30
Table 1. Work Packages of the HELI-DEM projects International Archives of the Photogrammetry, Remote Sensing and Spatial Information Sciences, Volume XXXIX-B4, 2012
2. AVAILABLE DATA
In recent years, Italy and Switzerland have produced elevation data in different reference frames, produced with different technologies, resolutions, and accuracies. The first aim of the WP2 was the collection of the data and metadata for the study areas. In particular, this phase involved the research and the collection of local DTMs, i.e. digital terrain models with a medium or high resolution (at least 50 meters), developed by local authorities (Regions, National Geodetic Authorities), with a national or regional extension:
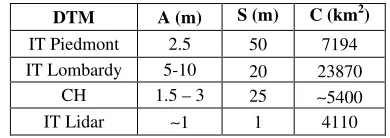
• official DTMs of Lombardy and Piedmont Italian Regions and Switzerland with resolutions of 20, 50 and 25 meters respectively,
• DTM with a 10 meters planimetric resolution for the eastern area of Piedmont,
• Lidar DTM (Wehr et al., 1999, Brovelli et al.,2004) that covers the catchement area of the Como Lake with a planimetric resolution equal to 2 meters,
• high resolution Lidar DTM (1 meter), produced by the Ministry of Environment, which covers the Lombardy and Piedmont main hydrographic basins.
The available DTMs are in different reference frames: the Lombardy DTM is in the Italian Roma 40, Gauss Boaga (R40-GB) reference frame (West zone), while the other DTMs are provided in ETRF89-IGM95. Some of them are in UTM coordinates (the two DTMs of Piedmont and the Lidar DTM of Como Lake), the others in geographic coordinates (the Swiss DTM and the HR Lidar DTM). Figure 1 shows the distribution of the DTMs collected over the project area of interest.
Figure 1. Distribution of the local DTMs for the area of interest of the HELI-DEM project
Table 2. The available data. A: nominal vertical accuracy. S: spatial resolution. C: covered area within the Helidem region
The main goal of the HELI-DEM project is the creation of a multiresolution digital terrain model unified for the alpine and subalpine area between Italy and Switzerland. Therefore some conclusions about the final resolution and accuracy of the resulting model can be drawn depending on the DTMs available. To this purpose, Figure 1 shows a graphical
representation of the maximum resolution available for the provinces involved in the project.
3. CROSS-VALIDATION OF DTMS
To cross validate the DTMs, two different analyses have been carried out. The first is the comparison between crossborder DTMs with similar planimetric resolution where they overlap, i.e. in the borders between their domain. The second comparison has been done between low and high resolution DTMs where the second one exist. Several cross-validations between different couples of DTMs have been carried out. As case studies, in the following sections only some comparisons will be reported:
• Piedmont (res. 50 m) and Switzerland (res. 25 m) DTMs, • Lombardy (res. 20 m) and Switzerland (res. 25 m) DTMs, • Lombardy (res. 20 m) and HR Lidar (res. 1 m) DTMs. The first and second comparisons are example of cross-validation between similar DTMs, while the third is a comparison between LR and HR DTMs.
Since these DTMs are not all in the same reference frame, before doing the cross-validation, some datasets have been transformed into a new reference frame. To do that the program GK2CNV which allows to transform a list of points or a grid from one original reference/coordinate frame to another one has been implemented.
The GK2CNV program, developed in FORTRAN language under the GNU General Public License, allows to transform spatial data between different reference frames (ETRF89, ETRF2000, R40-GB, ED50), according to Italian specifications realized by the Italian Military Survey Office (IGM – Istituto Geografico Militare, Altamimi and Boucher, 2001, Donatelli et al., 2002). The transformations are based on latitude and longitude shift parameters, gridded for the entire national territory with a spatial resolution of 5’ in latitude and of 7’30” in longitude. The vertices (more than 800) used for the calculation of the national transformation parameters between the different frames belong to the National geodetic network. In the most common case, in which the point to be transformed does not coincide with a grid node, the shift value is obtained interpolating (using a bilinear interpolation algorithm) the four nodes closest to the point.
GK2CNV accepts as input ASCII list of coordinates, a single DTM (ESRI or GRASS ASCII grid format) or a list of DTMs. The transformed output of the program is always a list of coordinates: it is worth to remember that, even if the input is on a regular grid, the transformed points are no more on a grid although regularly distributed.
In the following the cross-validations, the implemented procedures and the results will be presented.
3.1 Cross-validation of similar resolution DTMs
All the LR DTMs have similar resolutions and accuracies: no one of them can be considered as truth and they have been compared on some points that do not coincide with the nodes of one of the original DTMs. The comparison points have been randomly generated in ETRF89 with a uniform spatial distribution within the overlapping area of the DTMs. Their density is about 1point/400 m2.
For each point two elevations have been obtained, through exact bicubic interpolation from the nodes of the Switzerland DTM (hS) and then from those of the Piedmont DTM, hP (if the point is in the overlapping area between Switzerland and Piedmont) or Lombardy DTM, hL (if viceversa the point is in the overlapping area between Switzerland and Lombardy). For each International Archives of the Photogrammetry, Remote Sensing and Spatial Information Sciences, Volume XXXIX-B4, 2012
point the elevation difference,
The points located within the lakes of Lombardy and Piedmont are characterized by a constant h: for example points belonging to the Lago Maggiore in Piedmont are characterized by a constant h equal to 1 meter and points belonging to the Lago di Livigno in Lombardy has a constant h of 15 m. To avoid that these blunders influence the final statistics they have been removed from the datasets. The analyses on the height differences have been done following this schema:
• statistical analysis,
• subdivision of the differences into classes and computation of the percentage of points belonging to each class, • spatial analysis of the distribution of differences.
3.1.1 Results and statistics of the comparison between Switzerland and Lombardy DTMs: The CH DTM has been interpolated directly on the comparison points (which are in ETRF89). Since the Lombardy DTM is in R40-GB (cartographic coordinates), the comparison points have been transformed from ETRF89 to R40-GB before doing the interpolation, by adopting the afore mentioned GK2CNV routine.
The sample has been considered from a statistical point of view: • number of points = 256737 deviation greater but comparable with the altimetric accuracies of the two DTMs.
The sample has been classified by absolute values. The result of this operation has been summarized in Table 3 : more than 80% of the points present differences smaller than 20 meters. On this regard the results are satisfactory. On the other hand, several
Table 3. Classes of elevation differences between Switzerland and Lombardy and their percentages
As concerns the distribution of the sample, Figure 2 shows the frequency curve of the height differences, compared to a Gaussian with the same mean and standard deviation of the sample and computed in the interval -3σ÷+3σ. There is no correspondence between them, in particular in the neighborhood of ±σ, where the sample tends to differ from the theoretical distribution. This is confirmed by the classical chi square adapting test.
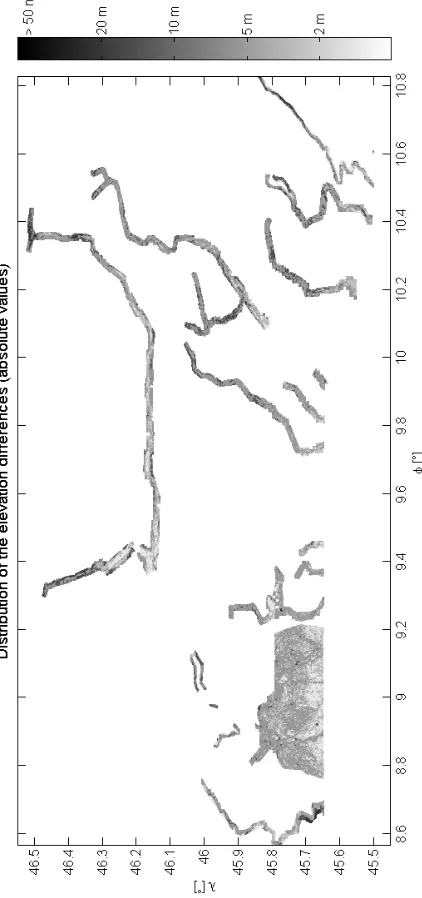
Figure 3 shows the spatial distribution of the differences. Note that the overlapping region between the two DTMs is in Lombardy, because the CH DTM covers part of the Italian region, while the viceversa does not happen. The figure shows that the biggest differences are concentrated in some specific
areas, that do not correspond to the most mountainous areas. For example, the North-East part has higher mountains than the central one where more outliers are present. The correlations between the differences and both the heights and the local slopes have been computed: none of them is significant (both the values are smaller than 0.05). This phenomenon is probably due to some problem during the realization of the DTMs (i.e. errors in the digitization of the cartography to obtain the DTMs): specific analyses have been started and will be reported in a following paper.
Figure 2. Adjustment of the height differences (Switzerland-Lombardy DTMs) sample to a Gaussian distribution
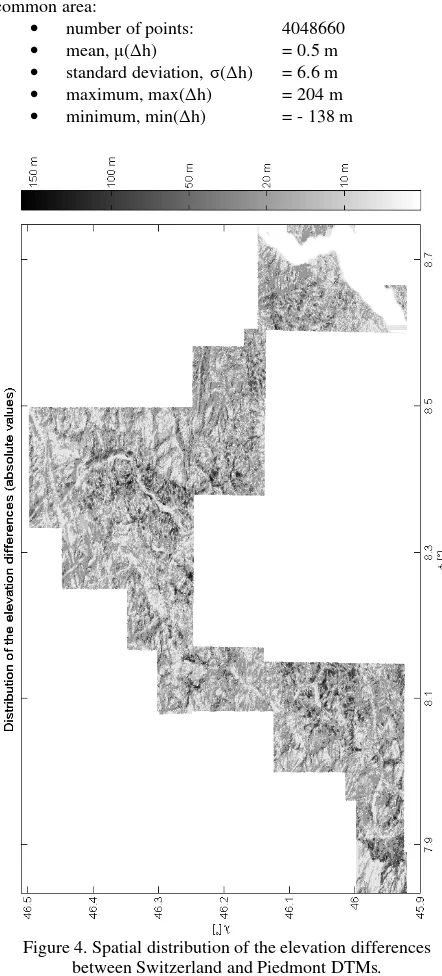
3.1.2 Results and statistics of the comparison between Switzerland and Piedmont DTMs: In this case the two DTMs are in the same reference frame (ETRF89). The statistics of the differences are reported below:
The mean of the differences is greater than 1 meter. This value is not significant if compared to the nominal accuracy of the datasets. However, a bias in the Piedmont DTM seems confirmed by its comparison with the Lombardy DTM (here not discussed for space reasons). Also in this case deeper analyses are needed.
In this case, the standard deviation of the differences is significantly bigger than the nominal accuracies of the two DTMs under consideration.
As in the Lombardy case, the sample distribution does not fit a Gaussian distribution with the same mean and standard deviation of the sample.
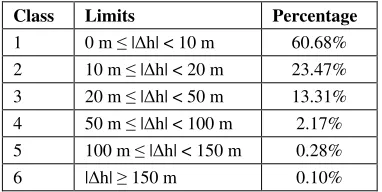
After the computation of the elevation differences hP, the sample has been divided into the six classes used already for Lombardy (Table 4). In this case the differences smaller than 20 meters are less than 70 % and more outliers are present (4637). Figure 4 shows the spatial distribution of elevation differences over the overlapping area of the two DTMs. Differently from the previous case, there aren’t areas characterized by particular anomalies and the hP change gradually from class 1 to 6. These considerations allow to exclude the presence of some systematic behavior in the realization of the DTMs. The correlations between the differences and both the heights and the local slopes are not significant (both the values are smaller than 0.05).
Class Limits Percentage
1 0 m | h| < 10 m 39.12%
2 10 m | h| < 20 m 27.11% 3 20 m | h| < 50 m 28.10%
4 50 m | h| < 100 m 5.11%
5 100 m | h| < 150 m 0.48%
6 | h| 150 m 0.08%
Table 4. Classes of elevation differences between Switzerland and Piedmont and their percentages
Figure 3. Spatial distribution of the elevation differences between Switzerland and Lombardy DTMs.
3.2 Cross-validation of high and low resolution DTMs in Lombardy
High and low resolution DTMS have been compared by implementing new commands in GRASS GIS 7.0. The procedures that have been applied for the cross-validation in the Lombardy region are here shortly described.
The LR DTM has been transformed to the ETRF89 reference frame. The result is a list of 3D points, that clearly are almost regularly spaced but no more on a regular grid. For each point, a square window of 20 × 20 m2 has been considered. All the HR
DTM nodes contained in the window are averaged and their mean is compared with the LR height.
Note that the HR DTM covers only the hydrographic main basins of the region, for a total coverage of about 3810 Km2 (which corresponds to the 16% of the total Lombardy region). The following global statistics have been obtained on the common area:
• number of points: 4048660
• mean, ( h) = 0.5 m
• standard deviation, ( h) = 6.6 m • maximum, max( h) = 204 m • minimum, min( h) = - 138 m
Figure 4. Spatial distribution of the elevation differences between Switzerland and Piedmont DTMs.
To verify the existence of global biases, the differences have been clustered in eight classes: the results are reported in Table 5. Figure 5 depicts the spatial distribution of the differences. Moreover we have started to investigate a phenomenon that, at first sight, seems quite strange. As example, Figure 6 and Table 6 report the differences relevant to the Valley of S.Giacomo that covers all the B1 Lombardy grid.
The mean difference is 0.5 meters, which is not significant with respect to the LR DTM accuracy. However, in the West slope (the lower part of the figure) a negative bias between HR and LR DTMs appears. In the other slope an opposite bias is present. Such a behavior could be justified by a translation of International Archives of the Photogrammetry, Remote Sensing and Spatial Information Sciences, Volume XXXIX-B4, 2012
the two DTMs with respect to the valley axis. A program to estimate biases between DTMs has been implemented to verify the existence of such translation.
Class Limits Percentage
1 0 m | h| < 5 m 78.78%
2 5 m | h| < 10 m 13.80%
3 10 m | h| < 20 m 5.99%
4 20 m | h| < 50 m 1.19%
5 50 m | h| < 100 m 0.22%
6 | h| 100 m 0.01%
Table 5. Differences between LR Lombardy DTM and HR Lidar DTM
Figure 5. Planimetric distribution of the height differences
between HR and LR DTMs.
Figure 6. HR-LR differences in the valley of S.Giacomo. The presence of systematic patterns is clear: biases with opposite signs that are present on the valley left and right slopes are hardly observable in the B/W figure.
Class Range Percentage
1 h < -100 m 0 %
2 -100 m h < -50 m 0.25 %
3 -50 m h < -20 m 0.46 %
4 -20 m h < -10 m 3.11 %
5 -10 m h < -5 m 15.74 %
6 -5 m h < 0 m 39.98 %
7 0 m h < 5 m 31.19 %
8 5 m h < 10 m 5.98 %
9 10 m h < 20 m 2.25 %
10 20 m h < 50 m 0.99 %
11 50 m h < 100 m 0.04 %
12 h 100 m 0 %
Table 6. HR-LR height differences in the valley
The estimate of a translation and a bias between two DTMs is performed by Least Squares (Koch et al., 1987). The height of a point P is described by the following:
1 1
( ) ( ( ))
h P = f x P +
ν
2 2
( ) ( ( ))
h P = f x P +
ν
where
f
1,
f
2 are respectively the height functions of DTM1 (inour case, the HR DTM) and DTM2 (the LR DTM), ν1,ν2, are their observation noise, [ ]T
P P
N E =
x are the planimetric coordinates of P. In the absence of a translation and bias, clearly we have:
1( ( )) 2( ( ))
f x P = f x P
Let suppose that a translation
[
]
TN E
t
t
=
t
and a biash
exist between the two DTMs. The functional model becomes the following:1( ( )) 2( ( ) )
f x P = f x P +t +h It can be linearized by the following
1 2 2
( ( )) ( ( )) ( ( )) ( ( ))
f P f P f P f P h
∆ x = x − x = ∇ x ⋅ +t
where ∇f is the gradient of the function.
By all the observed differences ∆f(Pi),i=1,2...,M, the
translation and the bias can be estimated by LS.
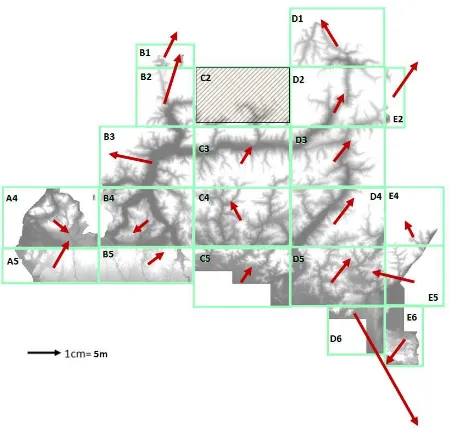
To fill the design matrix, the gradient of the LR DTM are computed by the usual numerical approximation. At the present, translations and biases have been estimated on the whole region, then they have been analyzed for the subgrids of the LR DTM. In Figure 7 the planimetric translations for each subgrid are depicted. The height biases estimates have values in the range International Archives of the Photogrammetry, Remote Sensing and Spatial Information Sciences, Volume XXXIX-B4, 2012
±1.5 m, and their mean is 0.27 m. No systematic translation appears at the regional scale. On the contrary anomalous values appear in several subgrids (a clear example is provided by D6): these anomalies require deeper investigation that will be performed in the next future.
Figure 7. Estimates of the translations between the LR Lombardy and the HR LiDAR DTMs. Individual translations have been estimated for the subgrids of the regional DTM. Grid
C2 has no overlap with the Lidar DTM.
4. CONCLUSIONS
The presented research is in the framework of the Interreg Italy-Switzerland HELI-DEM (Helvetia-Italy Digital Elevation Model) project. HELI-DEM is aimed at creating a transalpine DTM by merging all the available height information for the alpine area. Particularly the LR DTMs of Piedmont (50 meters of planimetric resolution) and Lombardy (25 meters) Italian regions and the national Switzerland DTM (25 meters) are available. Moreover, local HR LiDAR DTM (1 meter) is available for the main hydrographic basins in Italy.
The paper has discussed the first operations needed for the final merging. At first, all the DTMs have been transformed to the same 3D reference frame, that is the european ETRF89. Then, several cross-checks have been performed: in particular, the LR DTMs have been compared in their overlapping boundaries and have been compared with the HR DTMs where they are available.
To these purposes, several algorithms and procedures have been developed in MATLAB and GRASS.
The cross-check between Lombardy and Switzerland has not shown any general bias and the standard deviation of the differences, even if bigger, is comparable with the nominal accuracy. However, the spatial distribution of the differences presents an anomalous behavior. The magnitude of the differences is not correlated with the heights or the slopes and the biggest differences are localized in particular subgrids of the Lombardy DTM: this clearly implicates some blunder in the production of those particular datasets.
A bias of about 1.5 meter exists between Piedmont and Switzerland DTMs: obviously, the bias is below the nominal accuracy of both the datasets but it is everywhere present. Moreover, it is confirmed by the comparison with the Lombardy DTM.
In some valley, the comparison between Lombardy LR DTM and the HR DTM shows an apparent planimetric translation. A software to estimate the translation between two DTMs by least squares has been implemented. Globally, a common translation does not exist: this is also true at the level of the several sub-grids of the Lombardy DTM. Therefore, no bias in the reference frames of the two DTMs should be suspected. However, more investigations should be done on the subgrids and valleys where the bias is more evident.
In particular, external validation by GPS surveys will be done in the next months.
5. ACKNOWLEDGMENTS
This research is a part of the HELI-DEM (Helvetia-Italy Digital Elevation Model) project, funded by the European Regional Development Fund (ERDF) within the Italy-Switzerland cooperation program. More details about the project can be found on the website: www.helidem.eu.
References:
Altamimi, Z. and C. Boucher, The ITRS and ETRS89 Relationship: New Results from ITRF2000, Report on the Symposium of the IAG Subcommission for Europe (EUREF), Dubrovnik, 2001.
Barzaghi R., Borghi A., Carrion D., Sona G. (2007). Refining the estimate of the Italian quasi-geoid. Bollettino di Geodesia e Scienze Affini, ISSN 0006-6710, fascicolo 3/2007, pp. 145-159
Benciolini B., Biagi L., Crespi M., Manzino A., Roggero M., Reference frames for GNSS positioning services: some problems and proposals. Journal of Applied Geodesy, N. 2-2008
Biagi L., Brovelli M.A., Campi A., Cannata M., Carcano L., Credali M., De Agostino M., Manzino A., Sansò F., Siletto G. (2011). Il progetto HELI-DEM (Helvetia-Italy Digital Elevation Model): scopi e stato di attuazione, in Bollettino della Società Italiana di Fotogrammetria e Topografia, n°1/2011, pp. 35-51, ISSN: 1721-971X.
Brovelli M. A., Cannata M., and Longoni U., LIDAR data filtering and DTM interpolation within GRASS, Transactions in GIS, vol. 8, no. 2, pp. 155–174, 2004.
Donatelli D., Maseroli R., Pierozzi M., La trasformazione tra sistemi di riferimento utilizzati in Italia, Bollettino di Geodesia e Scienze Affini, Anno LXI, N° 2, 2002
El-Sheimy N. , Valeo C., Habib A. , 2005. Digital Terrain Modeling – Acquisition, manipulation and applications. Artech House.
Koch K. R., Parameter estimation and hypothesis testing in Linear models, Springer Verlag, 1987
Li Z., Zhu Q., and Gold C., Digital terrain modeling: principles and methodology. CRC, 2005.
Marti, U. Comparison of High Precision Geoid Models in Switzerland. Dynamic Planet, International Association of Geodesy Symposia, 2007, Volume 130, Part III, pp. 377–382.
Rees W.G., The accuracy of digital elevation models interpolated to higher resolutions. International Journal of Remote Sensing, vol. 21, no.1, pp. 7-20, 2000.
Wehr A., Lohr U., Airborne laser scanning–an introduction and overview, ISPRS Journal of Photogrammetry and Remote Sensing, vol. 54, no. 2-3, pp. 68–82, 1999.