Open GIS Consortium
35 Main Street, Suite 5Wayland, MA 01778 Telephone: +1-508-655-5858
Facsimile: +1-508-655-2237 Editor:
Telephone: +1-703-830-6516 Facsimile: +1-703-830-7096
The OpenGIS™ Specification Model
Topic 15: Image Exploitation Services
Version 6
Copyright © 1999, 2000, Open GIS Consortium, Inc.
NOTICE
The information contained in this document is subject to change without notice.
The material in this document details an Open GIS Consortium (OGC) specification in accordance with the license and notice set forth on this page. This document does not represent a commitment to implement any portion of this specification in any companies’ products.
While the information in this publication is beleived to be accurate, the Open GIS Consortium makes no warranty of any kind with regard to this material including but not limited to the implied warranties of merchantability and fitness for a particular purpose. The Open GIS Consortium shall not be liable for errors contained herein or for incidental or consequential damages in connection with the furnishing, performance or use of this material. The information contained in this document is subject to change without notice.
The Open GIS Consortium is and shall at all times be the sole entity that may authorize developers, suppliers and sellers of computer software to use certification marks, trademarks, or other special designations to indicate compliance with these materials.
This document contains information which is protected by copyright. All Rights Reserved. Except as otherwise provided herein, no part of this work may be reproduced or used in any form or by any means (graphic, electronic, or mechanical including photocopying, recording, taping, or information storage and retrieval systems) without the permission of the copyright owner. All copies of this document must include the copyright and other information contained on this page.
Revision History
Date Description
15 January 1999 New topic volume from project document 98-025r4.
31 March 1999 Update Section 1 for new document template; move introduction of Section 2 and Section 2.1 in 99-115 to Section 1.2 of this version.
22 June 1999 Update sections 2.1.1.1, 2.1.1.2 and 2.1.3 with change proposal 99-025 (w/ friendly changes), approved at April 1999 TC meeting.
Table of Contents
1. Introduction... 5
1.1. The Abstract Specification ...5
1.2. Introduction to Image Exploitation Services ...5
1.3. References for Section 1...5
2. Background for Image Exploitation Services ... 6
2.1. Use Cases ...6
2.1.1. The Information Consumer Perspective...6
2.1.1.1. The Farmer ... 6
2.1.1.2. The Prospective Home Buyer... 8
2.1.1.3. The Soldier ...10
2.1.2. The Information Producer Perspective ...12
2.1.2.1. Produce Feature Product...13
2.1.2.2. Extract Feature from Image...14
2.1.2.3. Edit Elevation Data ...15
2.1.2.4. Prepare Feature Source Package...16
2.1.2.5. Register Images ...17
2.1.3. Description of Some Services ...19
2.1.3.1. Display Image With Overlaid Graphics ...19
2.1.3.2. Generate Perspective Scene...20
2.1.3.3. Classify Pixels and Segment Image...20
2.1.3.4. Automated Feature Detection...20
2.2. Image Exploitation Services Categorization and Taxonomy ...20
2.2.1. Notes on the image exploitation service taxonomy ...25
2.3. Uses of Other Services...26
2.4. References for Section 2...27
3. Abstract Specification for Image Exploitation Services ... 28
3.1. Ground Coordinate Transformation Services...28
3.1.1. Function ...28
3.1.2. Service subtypes...28
3.1.2.1. Ground coordinate conversion (exact) services...28
3.1.2.2. Ground coordinate transformation (approximate) services...28
3.1.2.3. Concatenated ground coordinate transformation services ...28
3.1.3. Results Data...28
3.1.4. Needed data ...29
3.1.5. Discussion...29
3.2. Image Coordinate Transformation Services...30
3.2.1. Function ...30
3.2.2. Results Data...30
3.2.3. Needed data ...30
3.2.4. Service subtypes...30
3.2.4.1. Image-ground position transformation services...30
3.2.4.2. Image position transformation services (2-D to 2-D) ...31
3.2.4.3. Concatenated image coordinate transformation services...31
3.2.5. Discussion...31
3.3. Imaging Time Determination Service...31
3.3.2. Service subtypes...32
3.3.2.1. Determine imaging time for one or more image positions ...32
3.3.3. Results Data...32
3.3.4. Needed data ...32
3.3.5. Discussion...32
3.4. Image Modification Services ...32
3.4.1. Function ...32
3.4.2. Service Subtypes ...33
3.4.2.1. Change pixel values services...33
3.4.2.2. Change pixel positions services...33
3.4.2.3. Change image data format services ...33
3.4.3. Results Data...34
3.4.4. Needed data ...34
3.4.5. Discussion...35
3.5. Dimension Measurement Services ...35
3.5.1. Function ...35
3.5.2. Service Subtypes ...35
3.5.2.1. Line segment dimensions services: ...35
3.5.2.2. Multi-segment line length service: ...35
3.5.2.3. Area dimensions services: ...35
3.5.2.1. Height dimension service: ...36
3.5.2.2. Volume dimension service: ...36
3.5.2.3. Temporal dimension service:...36
3.5.3. Results...36
3.5.4. Needed data ...36
3.6. Geodata Registration Services ...37
3.6.1. Function ...37
3.6.2. Service Subtypes ...37
3.6.2.1. Adjust one SRS (Spatial Reference System) to another SRS. ...37
3.6.2.2. Adjust multiple SRSs to each other (but not adjust to a fixed SRS) ...37
3.6.2.3. Adjust multiple SRSs to a fixed SRS and to each other ...37
3.6.3. Results Data...37
3.6.4. Needed data ...37
3.6.5. Discussion...38
3.6.6. Related Services...38
3.7. Automated Image Matching Services...38
3.7.1. Function ...38
3.7.2. Service Subtypes ...38
3.7.2.1. Basic image matching services (services used by following subtypes): ...38
3.7.2.2. Tie point extraction service ...38
3.7.2.3. Control point transfer service ...39
3.7.2.4. Elevation extraction service ...39
3.7.2.5. Image pattern following services...39
3.7.2.6. Fiducial mark measurement service ...39
3.7.2.7. Sample image matching services...39
3.7.3. Results Data...39
3.7.4. Needed data ...39
3.8. Accuracy Conversion Services ...40
3.8.1. Function ...40
3.8.2. Service Subtypes ...40
3.8.2.1. Convert covariance matrices to other forms ...40
3.8.2.2. Convert other forms to covariance matrices ...40
3.8.3. Results Data...40
3.8.4. Needed data ...40
3.8.5. Discussion...40
3.9. Metadata Access Services ...40
3.9.2. Service Subtypes ...41
3.9.2.1. Image geometry model metadata access service ...41
3.9.2.2. Spatial reference system (SRS) metadata access service...41
3.9.2.3. Coordinate transformation metadata access service ...41
3.9.2.4. Image format metadata access service...41
3.9.2.5. Values (of pixels) metadata access service...41
3.9.2.6. Service capabilities metadata access service ...41
3.9.2.7. Service properties (or strategies) metadata access service...41
3.9.2.8. Support Metadata Retrieval Services...41
3.9.2.9. Support Metadata Modification Services ...41
3.9.3. Discussion...41
3.10. Image Geometry Model Transformation Services...41
3.10.1. Function ...41
3.10.2. Consequences ...41
3.10.3. Service Subtypes ...42
3.10.3.1. Fit approximate image geometry model to point positions computed using existing image geometry model...42
3.10.3.2. Convert image geometry model to different, mathematically equivalent model, by converting geometry parameters of existing image geometry model ...42
3.10.4. Results Data...42
3.10.5. Needed data ...42
4. Well Known Types and Structures ... 43
4.1. Metadata...43
4.2. Image Pixels ...44
4.3. Desired Image Section...44
4.4. Point Position Coordinates ...44
4.5. Position Accuracy Estimates ...44
4.5.1. Covariance Matrix Data Structures...45
4.6. Elevation Data...46
4.7. Elevation Accuracy Estimates ...46
4.8. Image SRS Definition ...47
4.9. Features With Geometry ...48
4.10. Strategy Parameters ...48
4.11. Selection of Service Operation...48
4.12. Other Inputs and Outputs...49
4.12.1. Accuracy Conversion Parameters...49
4.13. Other Possible Outputs...50
4.14. Hierarchical Name Value Lists...51
4.15. Input and Output Specifications ...52
4.15.1. Name Value List Use Objects...53
4.16. ISO Standard IDL ...54
5. Future Work... 55
5.1. Software Frameworks ...55
6. Appendix A. Acronyms and Glossary ... 56
6.1. Acronyms ...56
6.2. Definitions ...56
1.
Introduction
1.1.
The Abstract Specification
The purpose of the Abstract Specification is to create and document a conceptual model sufficient enough to allow for the creation of Implementation Specifications. The Abstract Specification consists of two models derived from the Syntropy object analysis and design methodology [1]. The first and simpler model is called the Essential Model and its purpose is to establish the conceptual linkage of the software or system design to the real world. The Essential Model is a description of how the world works (or should work).
The second model, the meat of the Abstract Specification, is the Abstract Model that defines the eventual software system in an implementation neutral manner. The Abstract Model is a description of how software should work. The Abstract Model represents a compromise between the paradigms of the intended target implementation environments.
The Abstract Specification is organized into separate topic volumes in order to manage the complexity of the subject matter and to assist parallel development of work items by different Working Groups of the OGC Technical Committee. The topics are, in reality, dependent upon one another⎯ each one begging to be written first. Each topic must be read in the context of the entire Abstract Specification.
The topic volumes are not all written at the same level of detail. Some are mature, and are the basis for Requests For Proposal (RFP). Others are immature, and require additional specification before RFPs can be issued. The level of maturity of a topic reflects the level of understanding and discussion occurring within the Technical Committee. Refer to the OGC Technical Committee Policies and Procedures [2] and Technology Development Process [3] documents for more information on the OGC OpenGIS™ standards development process.
Refer to Topic Volume 0: Abstract Specification Overview [4] for an introduction to all of the topic volumes comprising the Abstract Specification and for editorial guidance, rules and etiquette for authors (and readers) of OGC specifications.
1.2.
Introduction to Image Exploitation Services
This topic volume is the portion of the OpenGIS™ Abstract Specification that describes the categories and taxonomy of image exploitation services needed to support the use of images and certain related coverage types. The Image Exploitation Services SIG of the Core Task Force is using this categorization to organize their work, especially development of more detailed abstract specification material for each service category.
Image exploitation services are required to support most aspects of image exploitation, including precision measurement of ground positions and of object dimensions. For example, a variety of services are needed for extracting features from images, or digital elevations from stereoscopic images. Image exploitation services are widely implemented and used in photogrammetric systems, currently using custom interfaces. Although the focus of this document is on services for using images, many of these services are expected to also be applicable to using other types of grid coverages and some non-grid coverages.
1.3.
References for Section 1
[1] Cook, Steve, and John Daniels, Designing Objects Systems: Object-Oriented Modeling with Syntropy, Prentice Hall, New York, 1994, xx + 389 pp.
[2] Open GIS Consortium, 1997. OGC Technical Committee Policies and Procedures, Wayland, Massachusetts. Available via the WWW as <http://www.opengis.org/techno/development.htm>. [3] Open GIS Consortium, 1997. The OGC Technical Committee Technology Development Process,
Wayland, Massachusetts. Available via the WWW as <http://www.opengis.org/techno/development.htm>.
2.
Background for Image Exploitation Services
2.1.
Use Cases
This Section presents a set of use cases that have been defined to support the definition the needed image exploitation services. That is, most listed steps in each use case will use one or more image exploitation services. These use cases start to show how image exploitation services are used in the “real world.” This Section also starts to define the image exploitation services that are needed by each use case. These use cases are grouped into two types: information consumer and information producer.
2.1.1.
The Information Consumer Perspective
The following “use cases” describe several possible situations in which information consumers could perform activities that require uses of image exploitation services.
2.1.1.1.The Farmer
A farmer has the goal of making management decisions on the application of insecticide, fertilizer, and irrigation to his fields. To do this:
1) The farmer obtains a map of his fields, through an interface to a local or remote map library or to a map creation service. (Note that this interface determines the spatial datum and projection and scale, or units, of the map). The farmer overlays this map with:
a) One or more previous images of his fields, orthorectified to overlay the map (obtained from a local or remote crop image library),
b) One or more previous years crop yield results (note that the yield information might be grid coverages, linear features, or polygon features),
c) Soil sample results, recent and previous (note that the soil samples are point features), d) Selected scouting reports (note that the scouting reports may be point features).
2) Using this data, the farmer assesses the need for fertilizer as a function of location in his fields. (Note that the algorithm which estimates the fertilizer need requirements may be provided by the local farmer's cooperative. That algorithm uses the map, current crop image, previous years yields, and soil samples as input.) The fertilizer need function produces a coverage that aligns with the farmer’s fields, where each polygon represents certain fertilizer application requirements. 3) The farmer can use historical data to find areas of crop damage due to insects, and determine appropriate corrective action. The need for insecticide is estimated using multispectral images from each of the past five years that have been processed to highlight insect infestation. (Note that the multispectral images are obtained via an interface to USDA's database, with rectification
parameters that ensure that it will fit the map automatically. The "insecticide need" is a partition of the farmer’s fields into polygons, each of which specifies a certain mixture and concentration of chemicals. The algorithm that computes these polygons and concentrations from the multispectral imagery is provided by the local extension service.)
4) To help minimize the environmental impact of applying fertilizer and pesticides, the decision support tools would use additional data. These tools overlay the "insecticide need" polygons and values, and the “fertilizer need” polygons, with wetlands data from the county or state (note that the wetlands data is a vector file), together with sensitivity factors from the Fish and Wildlife office (this is a raster file). Then, using an algorithm from the EPA, the farmer modifies his insect and fertilizer plans to protect a creek natural habitat of an endangered species.
5) The farmer generates an irrigation schedule for today and tomorrow. The irrigation need is determined by an algorithm using weather data (obtained from a weather prediction service), soil samples, and the current soil moisture profile (obtained through an interface to NASA's real-time data).
Notice the various actors: the farmer, the state university extension service (with insect data), the EPA, fish and wildlife, the farmer's cooperative (with algorithms), the image library (could be a commercial or a government source), USGS, etc.
Note that the selective application of fertilizer, insecticide, and irrigation probably would be done by computer controlled farm equipment using GPS. Similarly, crop yield information would be automatically collected by harvesting equipment using GPS.
Notes: The above discussion assumes irrigation is being used. In some farming areas, irrigation is always used. However, irrigation is never used in other farming areas. Other aspects of the above use case are probably applicable to some farming areas but not to other areas.
The above discussion assumes that algorithms and data are supplied by outside agencies such as the farmer's cooperative, the state university extension service, etc. However, outside sources
(particularly those supplying material and services) may not be the best source of algorithms. The farmer has a personal and vital interest in the results, and wants to avoid bias if possible. The farmer must at least retain understanding and customizing capability. He also needs to retain data ownership rights over his operation. That said, there can be value in getting the viewpoint of someone who sees a lot of other surrounding operations for comparison.
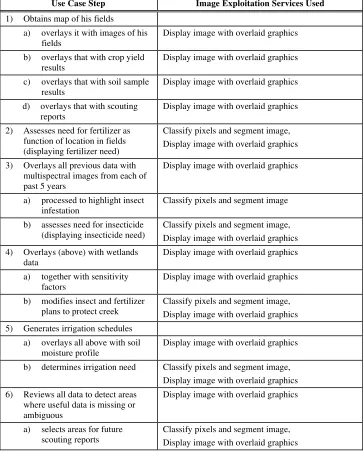
Use Case Step Image Exploitation Services Used
1) Obtains map of his fields
a) overlays it with images of his fields
Display image with overlaid graphics b) overlays that with crop yield
results
Display image with overlaid graphics c) overlays that with soil sample
results
Display image with overlaid graphics d) overlays that with scouting
reports
Display image with overlaid graphics 2) Assesses need for fertilizer as
function of location in fields (displaying fertilizer need)
Classify pixels and segment image, Display image with overlaid graphics 3) Overlays all previous data with
multispectral images from each of past 5 years
Display image with overlaid graphics
a) processed to highlight insect infestation
Classify pixels and segment image b) assesses need for insecticide
(displaying insecticide need)
Classify pixels and segment image, Display image with overlaid graphics 4) Overlays (above) with wetlands
data
Display image with overlaid graphics a) together with sensitivity
factors
Display image with overlaid graphics b) modifies insect and fertilizer
plans to protect creek
Classify pixels and segment image, Display image with overlaid graphics 5) Generates irrigation schedules
a) overlays all above with soil moisture profile
Display image with overlaid graphics b) determines irrigation need Classify pixels and segment image,
Display image with overlaid graphics 6) Reviews all data to detect areas
where useful data is missing or ambiguous
Display image with overlaid graphics
a) selects areas for future scouting reports
Classify pixels and segment image, Display image with overlaid graphics
Table 2-1. Image Exploitation Services Needed by “The Farmer”
2.1.1.2.The Prospective Home Buyer
The buyer, in the real estate broker's office or from home, selects a neighborhood (from an Internet service provided to support home-buying in a region), and is provided an aerial view of it. Service functions allow the buyer to zoom and roam through the region covered by the broker or service provider. Houses for sale appear in a red tint. Service interfaces allow the buyer to state a price range and mandatory features. Houses for sale in the desired price range and with the mandatory features flash red and green.
A few candidate green-and-red homes are selected through interfaces provided to the prospective buyer.
Functions using elevation data produce a three-dimensional perspective that allows the buyer to assess the view from each back porch.
Using orthorectified county imagery from 5, 10, 15, and 20 years ago, the buyer assesses the age of the roof, the health of the trees, and the trends in the neighborhood.
Using city, county and state data, the imagery is superimposed with: 1.Underground pipe and wire information (linear features); 2.The assigned school districts and schools (point and area features) 3.The nearest hospital and fire station
4.The lot lines
5.All easements and right-of-ways.
Using chamber of commerce data, the nearest shops and supermarket and auto repair shops are located and superimposed.
Using Automobile Association data, a family of alternate routes to work are determined, with the conditions that make each optimal. Each route is displayed, registered to the image backdrop. Using thermal infrared imagery from the department of energy, the prospective buyer assesses the heat loss in winter, and the need for new insulation. The algorithm is provided by EPA and DoE, jointly.
Using measuring tools, the sizes of the lot and house are separately measured. The size of the parking area is assessed and compared to the number of cars owned by the buyer.
Using census tract data and interfaces provided to the buyer, the demographics of the neighborhoods are visualized.
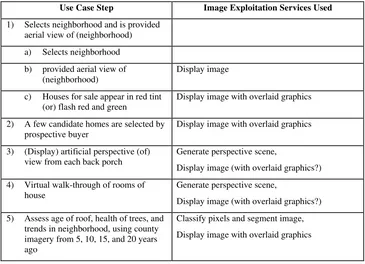
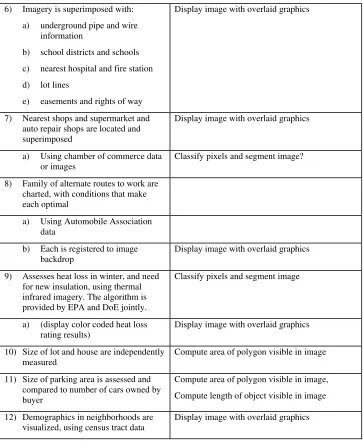
Table 2-2 summarizes the steps in this use case and lists some of the image exploitation services needed by each step.
Use Case Step Image Exploitation Services Used
1) Selects neighborhood and is provided aerial view of (neighborhood) a) Selects neighborhood b) provided aerial view of
(neighborhood)
Display image
c) Houses for sale appear in red tint (or) flash red and green
Display image with overlaid graphics
2) A few candidate homes are selected by prospective buyer
Display image with overlaid graphics
3) (Display) artificial perspective (of) view from each back porch
Generate perspective scene,
Display image (with overlaid graphics?) 4) Virtual walk-through of rooms of
house
Generate perspective scene,
Display image (with overlaid graphics?) 5) Assess age of roof, health of trees, and
trends in neighborhood, using county imagery from 5, 10, 15, and 20 years ago
6) Imagery is superimposed with: a) underground pipe and wire
information
b) school districts and schools c) nearest hospital and fire station d) lot lines
e) easements and rights of way
Display image with overlaid graphics
7) Nearest shops and supermarket and auto repair shops are located and superimposed
Display image with overlaid graphics
a) Using chamber of commerce data or images
Classify pixels and segment image?
8) Family of alternate routes to work are charted, with conditions that make each optimal
a) Using Automobile Association data
b) Each is registered to image backdrop
Display image with overlaid graphics
9) Assesses heat loss in winter, and need for new insulation, using thermal infrared imagery. The algorithm is provided by EPA and DoE jointly.
Classify pixels and segment image
a) (display color coded heat loss rating results)
Display image with overlaid graphics
10) Size of lot and house are independently measured
Compute area of polygon visible in image
11) Size of parking area is assessed and compared to number of cars owned by buyer
Compute area of polygon visible in image, Compute length of object visible in image 12) Demographics in neighborhoods are
visualized, using census tract data
Display image with overlaid graphics
Table 2-2. Image Exploitation Services Needed by "The Home Buyer"
The image exploitation services listed above assume:
1.All displays are in a (scaled and windowed) ground coordinate system (not in an unrectified image coordinate system).
2.Selection of a neighborhood is done using either a text menu or a graphic map display (not using an image display).
3.Virtual walk-through of a house is done using images of the house interior. 2.1.1.3.The Soldier
automatically bring up yesterday's image whenever something is suspicious in order to reduce the number of false "hits". If an interesting spot wasn't covered yesterday, older imagery is can be provided and used.
The image detection algorithms need to know where the roads are in the images, so an interface is provided that projects roads into the image geometry. Of course this assumes a prior interface that registers the road data to the images.
Image coordinates (pixel row and column) are automatically converted to the position data needed by his ordnance (that is, point and aim information). All the types of ordnance understand the target position objects; conversion is not necessary. [That is, a common interface exposes target positions.]
The soldier is in contact with his command authority; they share a common view of the battle space. [That is, there is a single interface (or family of interfaces) exposing a view of the battle space.]
The soldier finds something of interest on an image. He points at it and with a simple interface generates a report instantly that is understood by other analysts, who check his finding using other sources.
The other analysts are coalition members who speak a different language, and are supported with different technology, and who use different datums and projections. Yet interfaces bridge these gaps.
The soldier in his spare time makes contingency mission plans: selects potential targets, finds optimum access and egress paths, prepares flight folders that pilots and other weapon control officers can use to train, navigate, execute, escape, etc. [Note that interfaces exist to create and modify mission plans, and that mission plans include coordinated maps, images, vector and coverage features, …]
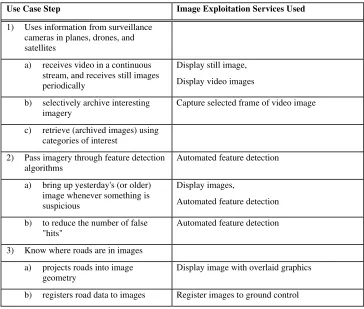
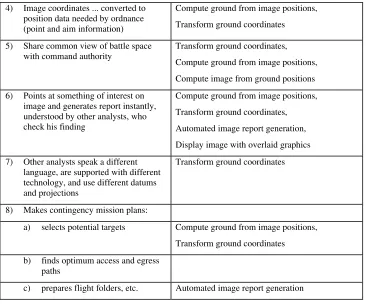
Table 2-3 summarizes the steps in this use case and lists some of the image exploitation services needed by each step.
Use Case Step Image Exploitation Services Used
1) Uses information from surveillance cameras in planes, drones, and satellites
a) receives video in a continuous stream, and receives still images periodically
Display still image, Display video images b) selectively archive interesting
imagery
Capture selected frame of video image
c) retrieve (archived images) using categories of interest
2) Pass imagery through feature detection algorithms
Automated feature detection
a) bring up yesterday's (or older) image whenever something is suspicious
Display images,
Automated feature detection b) to reduce the number of false
"hits"
Automated feature detection
3) Know where roads are in images a) projects roads into image
geometry
Display image with overlaid graphics
4) Image coordinates ... converted to position data needed by ordnance (point and aim information)
Compute ground from image positions, Transform ground coordinates 5) Share common view of battle space
with command authority
Transform ground coordinates, Compute ground from image positions, Compute image from ground positions 6) Points at something of interest on
image and generates report instantly, understood by other analysts, who check his finding
Compute ground from image positions, Transform ground coordinates, Automated image report generation, Display image with overlaid graphics 7) Other analysts speak a different
language, are supported with different technology, and use different datums and projections
Transform ground coordinates
8) Makes contingency mission plans:
a) selects potential targets Compute ground from image positions, Transform ground coordinates b) finds optimum access and egress
paths
c) prepares flight folders, etc. Automated image report generation
Table 2-3. Image Exploitation Services Needed by "The Soldier"
The listed services assume that all displays are in a (scaled and windowed) un-rectified image coordinate system (not in a ground coordinate system).
2.1.2.
The Information Producer Perspective
Figure 2-1 is a UML diagram of the five use cases defined in this Section. Each of these five use cases is defined and described in the following subsections. These five use cases show steps of a workflow used by information producers to extract geospatial data from images. They were derived from the conceptual process for geospatial data extraction described in Section 7 (Appendix B. The Geospatial Data Extraction Process). The five use cases presented in this section represent only a few of the many possible image exploitation scenarios that can be derived from the conceptual model of Section 7. Refer also to Section 8 (Appendix C. OGC Image Levels) for a description of the OGC standard set of image levels to be used in labeling processed images.
Figure 2-1. Use Cases for Extracting Geospatial Information from Images
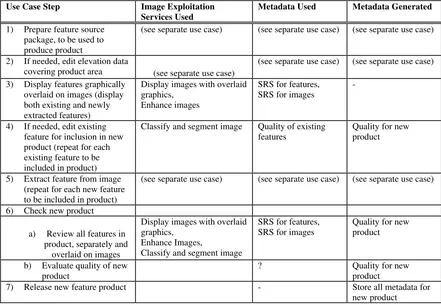
2.1.2.1.Produce Feature Product
In the Produce Feature Product use case, the actor is a user of a photogrammetric system (sometimes called an operator, a photogrammetrist, or a cartographer). This use case is started when the user starts to produce a specific feature product. The assumptions made in this use case include:
1.A feature product is (all or mostly) a collection of features with geometry, and/or one or more coverages based on feature collections.
2.Images plus existing vector feature data are used to produce the new feature product.
3.Elevation data is needed to obtain correct horizontal positions from feature positions in images. 4.A feature product may include elevation data, in feature geometry vertices and/or separately 5.An external use case handles decisions to produce feature products, plus any needed assignment and scheduling of users and systems.
Table 2-4 summarizes the steps in this use case and lists some of the image exploitation services needed by each step. Some of the use case listed in the table are optional. Several of these steps could be lower level use cases, such as the fourth step “Edit existing feature”. This table also lists some of the metadata used and generated by each step.
Use Case Step Image Exploitation Services Used
Metadata Used Metadata Generated
1) Prepare feature source package, to be used to produce product
(see separate use case) (see separate use case) (see separate use case)
2) If needed, edit elevation data
covering product area (see separate use case)
(see separate use case) (see separate use case) 3) Display features graphically
overlaid on images (display both existing and newly extracted features)
Display images with overlaid graphics,
Enhance images
SRS for features, SRS for images
-
4) If needed, edit existing feature for inclusion in new product (repeat for each existing feature to be included in product)
Classify and segment image Quality of existing features
Quality for new product
5) Extract feature from image (repeat for each new feature to be included in product)
(see separate use case) (see separate use case) (see separate use case)
6) Check new product a) Review all features in
product, separately and overlaid on images
Display images with overlaid graphics,
Enhance Images,
Classify and segment image
SRS for features, SRS for images
Quality for new product
b) Evaluate quality of new product
? Quality for new
product
7) Release new feature product - Store all metadata for
new product
Table 2-4. Image Exploitation Services Used to Produce Feature Product
Some of the possible variations in this use case are: 1.Nature of feature product, either:
1.2.New product
2.Elevation values attached to feature vertices, either: 2.1.No elevation values recorded
2.2.Elevation values automatically obtained from elevation data
2.3.Elevations values extracted from stereoscopic images (with horizontal positions) 3.Type of images from which features are extracted or edited, either:
3.1.Stereoscopic images
3.2.Unrectified monoscopic images 3.3.Rectified monoscopic images 3.4.Orthorectified monoscopic images
3.5.Mosaicked monoscopic images, normally orthorectified first 2.1.2.2.Extract Feature from Image
In the Extract Feature from Image use case, the actor is a user of a photogrammetric system (sometimes called an operator, a photogrammetrist, or a cartographer). This use case is started when the user decides to extract a new feature from displayed image(s). The assumption made in this use case is that a feature with geometry is to be extracted.
Table 2-5 summarizes the steps in this use case and lists some of the image exploitation services needed by each step. Some of the use case steps listed in the table are optional. Several of these steps could be lower level use cases. This table also lists some of the metadata used and generated by each step.
Use Case Step Image Exploitation Services Used
Metadata Used Metadata Generated
1) Delineate new feature geometry in image(s) 2) Convert feature geometry to
product SRS
Convert image positions to product SRS
SRS for image, SRS for new product, Quality for delineation
Quality for new feature 3) If needed, measure
dimension of feature from images, in product SRS (for example, measure feature
4) Assign type and all attributes to feature 6) Display new feature overlaid
on image(s)
Display images with overlaid graphics,
Convert ground positions to image SRS
SRS for image, SRS for new product
-
7) Review extracted feature ? Quality for new
feature
Table 2-5. Image Exploitation Services Used to Extract Feature from Image
Some of the possible variations in this use case are:
1.1.Stereoscopic images
1.2.Unrectified monoscopic images 1.3.Rectified monoscopic images 1.4.Orthorectified monoscopic images
1.5.Mosaicked monoscopic images, usually orthorectified first 2.Elevation values attached to feature vertices, either:
2.1.No elevation values recorded
2.2.Elevation values automatically obtained from elevation data
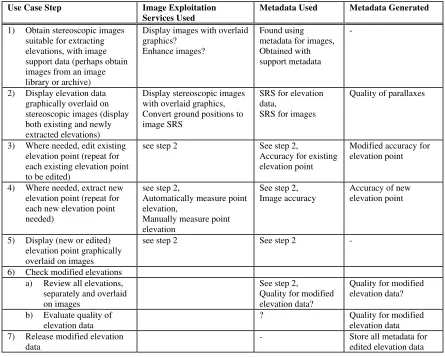
2.3.Elevations values extracted from stereoscopic images (with horizontal positions) 2.1.2.3.Edit Elevation Data
In the Edit Elevation Data use case, the actor is a user of a photogrammetric system (sometimes called an operator, a photogrammetrist, or a cartographer). This use case is started when the user decides to edit or extract elevation data.
Table 2-6 summarizes the steps in this use case and lists some of the image exploitation services needed by each step. Some of the use case steps listed in the table are optional. Several of these steps could be lower level use cases. This table also lists some of the metadata used and generated by each step.
Use Case Step Image Exploitation Services Used
Metadata Used Metadata Generated
1) Obtain stereoscopic images suitable for extracting elevations, with image support data (perhaps obtain images from an image library or archive)
Display images with overlaid graphics?
2) Display elevation data graphically overlaid on stereoscopic images (display both existing and newly extracted elevations)
Display stereoscopic images with overlaid graphics, Convert ground positions to image SRS
SRS for elevation data,
SRS for images
Quality of parallaxes
3) Where needed, edit existing elevation point (repeat for each existing elevation point to be edited)
4) Where needed, extract new elevation point (repeat for each new elevation point needed)
5) Display (new or edited) elevation point graphically overlaid on images
see step 2 See step 2 -
6) Check modified elevations a) Review all elevations, separately and overlaid b) Evaluate quality of
elevation data
? Quality for modified
elevation data 7) Release modified elevation
data
- Store all metadata for
Table 2-6. Image Exploitation Services Used to Edit Elevation Data
Some of the possible variations in this use case are: 1.Nature of elevation data, either:
1.1.Grid elevation data 1.2.TIN elevation data 1.3.Contour lines
1.4.Geomorphic features (that is, ridge lines, valley lines, slope break lines, peak points, saddle points, etc.)
1.5.Combination of above 2.Nature of elevation extraction, either:
2.1.Edit existing elevation data (e.g., improve accuracy, density, etc.) 2.2.Extract new elevation data (in part or all of product area) 2.3.Combination of above
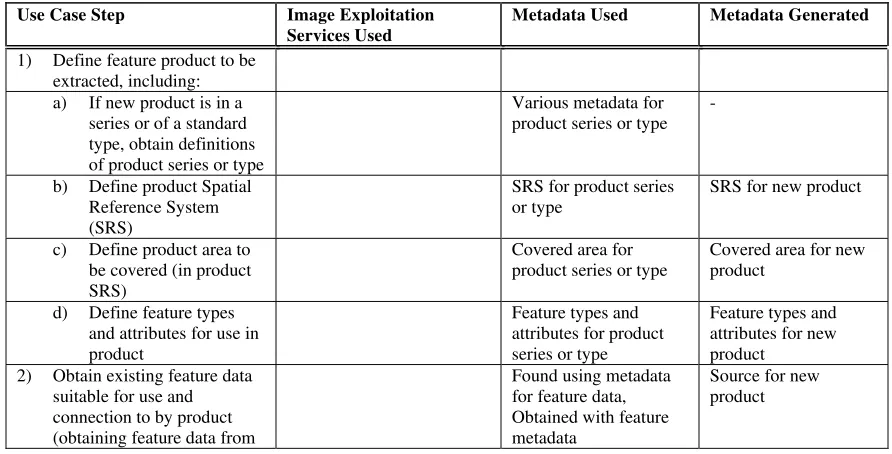
2.1.2.4.Prepare Feature Source Package
In the Prepare Feature Source Package use case, the actor is a user of a suitable source package preparation system. This use case is started when the user begins to prepare to produce a specific feature product. The assumptions made in this use case include:
1.Images plus existing vector feature data are used to produce the feature product,
2.Elevation data is needed to obtain correct horizontal positions from feature positions in images, 3.An external use case handles decisions to produce feature products, plus any needed assignment and scheduling of users and systems.
Table 2-7 summarizes the steps in this use case and lists some of the image exploitation services needed by each step. Some of the use case listed in the table are optional. Several of these steps could be lower level use cases. This table also lists some of the metadata used and generated by each step.
Use Case Step Image Exploitation Services Used
Metadata Used Metadata Generated
1) Define feature product to be extracted, including: a) If new product is in a
series or of a standard type, obtain definitions of product series or type
Various metadata for product series or type
-
b) Define product Spatial Reference System (SRS)
SRS for product series or type
SRS for new product
c) Define product area to be covered (in product SRS)
Covered area for
product series or type
Covered area for new product
d) Define feature types and attributes for use in product
2) Obtain existing feature data suitable for use and connection to by product (obtaining feature data from
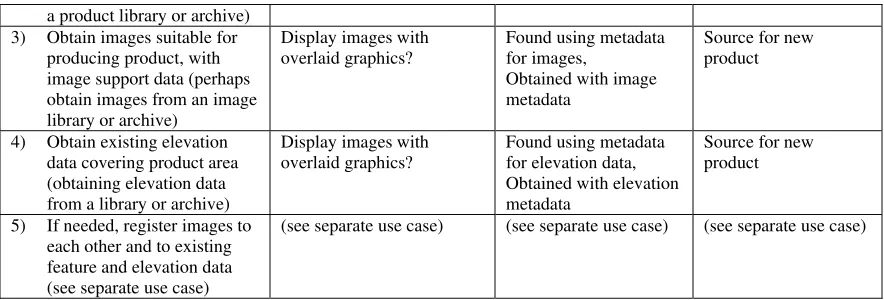
a product library or archive) 3) Obtain images suitable for
producing product, with image support data (perhaps obtain images from an image library or archive)
4) Obtain existing elevation data covering product area (obtaining elevation data from a library or archive)
Display images with
5) If needed, register images to each other and to existing feature and elevation data (see separate use case)
(see separate use case) (see separate use case) (see separate use case)
Table 2-7. Image Exploitation Services Used to Prepare Feature Source Package
Some of the possible variations in this use case are: 1.Nature of feature product, either:
1.1.Updated existing product
1.2.New product in a standard series of products 1.3.New product of a predefined type of products 1.4.Completely custom product
2.Type of images from which features to be extracted or edited, either: 2.1.Stereoscopic images
2.2.Unrectified monoscopic images 2.3.Rectified monoscopic images 2.4.Orthorectified monoscopic images
2.5.Mosaicked monoscopic images, usually orthorectified first 2.1.2.5.Register Images
In the Register Images use case, the actor is a user of a suitable photogrammetric system. This use case is started when the user decides that one or more images need to be registered to each other and/or to existing digital feature and elevation data. The assumptions made in this use case include: 1.One or more images plus existing data are to be used to produce feature and/or elevation products, and the existing mathematical models of (some of) these image geometries are not as accurate as needed.
2.For registration, the existing image geometry models will be adjusted by a mathematical process that uses the positions of multiple points as measured in the images being adjusted.
3.The points used in adjustment include “control” points and/or “tie” Points. Control points are points whose ground coordinates are known (with some accuracy), in three, two, or just one dimension. Tie points are points whose ground coordinates are not known (with useful accuracy), but which can be measured in two or more overlapping images.
could be lower level use cases, especially the step “Compute corrected image geometry models”. Indeed, a variety of different use cases for that step could be defined, using different methods for computing the corrected geometry models using the point data. This table also lists some of the metadata used and generated by each step.
Use Case Step Image Exploitation Services Used
Metadata Used Metadata Generated
1) Obtain the existing parameter values of the image geometry models for all images to be registered. These parameter values include information for each individual image, such as camera position data collected at the time of image exposure using the Global Positioning System (GPS) or an Inertial Navigation System (INS). These parameter values also include data common to multiple images, such as camera calibration information.
Current image geometry -
2) Obtain additional existing feature data suitable for use as control points in the registration process (obtaining feature data from a library or archive)
Display images with
3) Obtain additional existing elevation data suitable for use in the registration process (obtaining elevation data from a library or archive)
4) Select suitable control points in the existing feature and/or elevation data
5) Select suitable tie points Display images with overlaid graphics, Measure point positions, Automatically select tie points
Current image geometry Image position accuracy
6) Measure the position of each selected control point in one or more of the images in which that point is visible
Display images with
7) Measure the position of each selected tie point in each other image in which that point is visible
see step 6 Current image geometry Image position accuracy
8) Check all point position data for consistency, to detect any
Display images with overlaid graphics
major errors (or blunders) 9) Correct or eliminate the
point position data detected as erroneous
Display images with overlaid graphics
See step 6
10) Compute corrected values for selected parameters of the image geometry models for all images, so as to obtain the best practical fit to the known ground and image positions of all selected control and tie points
Register images/geodata, Convert ground position to image SRS,
Convert image position to ground SRS
See step 6 Modified image
geometry,
Image accuracy data
11) Check corrected image geometry models, to detect any major errors (or blunders)
12) Record corrected image geometry model data, in a form suitable for setting up images for data extraction
Modified image
geometry,
Image accuracy data
Store modified image metadata
Table 2-8. Image Exploitation Services Used to Register Images
Technical Note: Position accuracy data is often required for ground and image coordinates that are generated or used. Methods need to be developed for determining the accuracy and other quality metadata listed above under Metadata Generated. The draft of ISO 15046-14 specifies some quality determination methods. Some other quality determination methods also exist, but they are not complete and are of questionable reliability.)
Some of the possible variations in this use case are:
1.Lines can be used for image registration in addition to points, or instead of points, perhaps called “control lines” and “tie lines”. The corresponding positions of lines can be matched in one less dimension than for points: one dimension instead of two dimensions for image positions.
2.1.3.
Description of Some Services
This section describes in more detail some of the image exploitation services listed for steps the above use cases.
2.1.3.1.Display Image With Overlaid Graphics
As listed above, many use case steps display an image, usually with overlaid graphics. The overlaid graphics are used to display features or elevations plus measurement cursors and perhaps other information. Such image display uses a number of image exploitation services, including: 1.Retrieve selected image window from larger image, centered on a specified image position (roaming) and with a specified window size (zooming).
2.Resample pixels of retrieved image window to change pixel spacing (zooming). 3.Enhance images, to make desired features more easily visible
4.Rectify or orthorectify original image, either whole image or retrieved window of image. 5.Mosaic multiple rectified or orthorectified images (mosaicking is not always needed).
6.Convert data positions stored in another coordinate system into the ground coordinate system of the display window.
7.Convert data positions stored in all other coordinate systems into the image coordinate system of the display window.
Items 4 through 6 listed above are appropriate when the display is in a ground-position-based coordinate system, as assumed for “The Farmer” and “The Prospective Home Buyer” use cases. When the display is in an image-position-based coordinated system, as assumed for “The Soldier” use case, items 4 through 6 above are replaced by item 7.
Many items listed above could be done in real-time for just the portion of the images being displayed, as implied in the above list. Alternately, these operations could be done in a pre-processing step for the entire images. In that case, these operations could be done as a step 6 at the end of the Prepare Feature Source Package use case
2.1.3.2.Generate Perspective Scene
Generation of a perspective scene (or image perspective transformation) is the generation of a synthetic image by processing one or more actual images. Each synthetic image is generated to simulate a different image geometry, such as an image taken from a different point in space and/or looking in a different direction. In addition to using one or more actual images, perspective scene generation uses data defining the (approximate) shape of the visible surface that was imaged. This shape data is usually derived from grid elevation data, and can include vector feature 3-D shape data.
2.1.3.3.Classify Pixels and Segment Image
As listed, many use case steps classify image pixels and segment the resulting image (or raster data set). Such image manipulation can use a number of image exploitation services, including: 1.Register multiple images, coverages, and feature collections to one another.
2.Reproject and resample vector feature coverages and raster image coverages to one another, or to a third common coverage scheme (e.g. grid).
3.Change pixel values, to make the properties of interest more easily visible (including reduction of effective "noise"). These imagery enhancement operations can use (input) data from only one pixel at a time, or from a small neighborhood of adjacent pixels.
4.Apply previously defined classification or other analysis algorithms to multispectral pixel data. These classification or analysis algorithms can:
•
Produce results that are discrete (assigning each pixel to one of several possible categories) or continuous (assigning a numeric value to each pixel, as derived from a continuous function).•
Use data from only one pixel at a time, or from a small neighborhood of adjacent pixels.•
Use multiple bands from the same image or from different images that have been registered to each other (see item 1). One or more bands can also be non-image coverages, that are registered to all other data.5.Segment classified or analyzed image into discrete regions with similar properties, by finding groups of adjoining pixels with the same or similar values. The segmentation results can be produced in either raster or vector form. Such segmentation usually ignores single pixels or very small regions that may differ from all surrounding pixels.
2.1.3.4.Automated Feature Detection
Automated feature detection can also use a number of image exploitation services, including all those listed above for Classify Pixels and Segment Image. The results of such Classify Pixels and Segment Image operations are then automatically and/or manually analyzed to detect the feature types of interest and their attributes. Alternately or in addition, the image being analyzed can be compared with sample images showing the feature types of interest.
Automated feature detection is largely outside the defined scope of the Image Exploitation Services SIG, so these services are not further detailed here.
2.2.
Image Exploitation Services Categorization and Taxonomy
1.Ground Coordinate Transformation Services: 1.1.Ground coordinate conversion (exact) services:
1.1.1.Geodetic coordinate conversion services 1.1.2.Map projection conversion services
1.2.Ground coordinate transformation (approximate) services: 1.2.1.Datum transformation services
1.2.2.Affine 2-D transformation service
1.2.3.General 2-D Polynomial transformation service 1.2.4.Polynomial 3-D transformation service
1.2.5.Vertical ground position transformation services 1.2.6.Other 3-D coordinate transformation services
1.2.7.Other 2-D horizontal ground position transformation services
1.3.Concatenated ground coordinate transformation services (including two or more of the above transformations and/or conversions ):
1.3.1.3-D to 3-D concatenated transformation 1.3.2.2-D to 2-D concatenated transformation 1.3.3.1-D to 1-D concatenated transformation 2.Image Coordinate Transformation Services:
2.1.Image-ground position transformation services:
2.1.1.Ground to image position transformation service (3-D to 2-D)
2.1.2.Stereoscopic images to ground position transformation service (multiple 2-D to one 3-D)
2.1.3.Monoscopic image plus elevation to ground position transformation service (2-D plus elevation to 3-(2-D)
2.1.4.Monoscopic image plus other data to ground position transformation service (2-D plus other data to 3-D)
2.2.Image position transformation services: (2-D to 2-D) 2.2.1.Polynomial transformation service
2.2.2.Image to rectified image position transformation service 2.2.3.Rectified image to image position transformation service
2.3.Concatenated image coordinate transformation services (including two or more of the above image transformations plus ground coordinate transformations and conversions):
2.3.1.3-D to 2-D concatenated transformation 2.3.2.2-D to 3-D concatenated transformation 2.3.3.2-D to 2-D concatenated transformation 2.4.Imaging time determination service
3.1.Change pixel values services:
(Note: Includes previously defined simple pixel manipulation services) 3.1.1.Tone modification services
3.1.2.Spatial filtering (or convolution) services
3.1.3.Pixel (multi-band or multi-image) classification services 3.1.4.Image segmentation services
3.1.5.Band and image combination services 3.1.6.Other image enhancement services 3.1.7.Simulate non-idealities services 3.1.8.Histogram generation service 3.1.9.Fourier analysis service
3.1.10.Other frequency domain services 3.1.11.Graphical overlay application service 3.1.12.Grid overlay generation service 3.2.Change pixel positions services:
3.2.1.Pixel resampling service (services used by following subtypes) 3.2.2.Polynomial transformation warping service
3.2.3.Computer graphics warping services (including splines, piece-wise transformations)
3.2.4.Image rectification service 3.2.5.Orthorectification service 3.2.6.Image mosaicking service
3.2.7.Perspective scene generation service 3.3.Change image data format services:
(Note: Includes or uses image coverage access services) 3.3.1.Image section retrieval services 3.3.2.Image section replacement services 3.3.3.Tiling change services
3.3.4.Reduced resolution generation service
3.3.5.Increased resolution estimation (or creation) services 3.3.6.Image compression and decompression services
3.4.Composite image modification services, including two or more of above image modifications
4.Dimension Measurement Services: 4.1.Line segment dimensions service:
4.1.2.Compute 3-D length and direction angles of a line segment, from one point to a second point
4.2.Multi-segment line length service:
4.2.1.Compute length of multi-segment line feature or real world object, from sequence of vertices representing spatial position of that line
4.3.Area dimensions services:
4.3.1.Compute area and perimeter of area feature or real world object, from sequence of vertices representing boundary of that area
4.3.2.Compute size, orientation, and center position of a standard geometrical shape, from a sequence of points on the perimeter of that shape
4.4.Height dimension service:
4.4.1.Compute height of a vertical real-world object (such as a pole or building), from one point on the image of the top and a second point on the image of the base 4.4.2.Compute height of a vertical real-world object (such as a pole or tower), from one point on the image of the top and a second point on the image of the shadow of the first point
4.5.Volume dimension service:
4.5.1.Compute volume of a solid features using its shell, from a sequence of vertexes for each facet of the shell.
4.5.2.Compute cut and fill volumes between two different elevation surfaces, specified by a digital terrain matrix, regular triangulated network, or triangulated irregular network.
4.6.Temporal dimension service:
4.6.1.Support time-stamping of features, or of each vertex of a feature, as a single value or as a time range. (The image exposure time of the feature, or its vertexes, could be associated with each feature or its vertexes. A feature time-stamp can be stored in feature attribute (or property) fields, using separate attributes for the beginning and ending times. A vertex time-stamp can be stored as a fourth dimension.)
5.Geodata Registration Services:
5.1.Adjust one SRS (Spatial Reference System) to another SRS. 5.2.Adjust multiple SRSs to each other (but not adjust to a fixed SRS) 5.3.Adjust multiple SRSs to a fixed SRS and to each other
6.Automated Image Matching Services:
6.1.Basic image matching services (services used by following subtypes) 6.2.Tie point extraction service
6.3.Control point transfer service 6.4.Elevation extraction service 6.5.Image pattern following services 6.6.Fiducial mark measurement service 6.7.Sample image matching services:
6.7.2.Object identification services
6.7.3.Object dimension determination services 6.7.4.Object classification services
7.Automated Image Understanding Services: 7.1.Pattern recognition services:
7.1.1.Object detection and location services 7.1.2.Object identification services
7.1.3.Object dimension determination services 7.1.4.Object classification services
7.2.Image comparison services
7.2.1.Pixel values difference determination services 7.2.2.Change detection services
7.2.3.Trend analysis services
7.2.4.Model-based differencing services
7.2.5.Negation (determination of origin) of changes services 8.Accuracy Conversion Services
8.1.Convert covariances to other forms:
8.1.1.Convert 3-D covariances to CE plus LE 8.1.2.Convert 2-D covariances to CE 8.1.3.Convert 1-D variance to LE
8.1.4.Convert 1-D variance to Standard Deviation 8.1.5.Convert 3-D covariances to Spherical Error 8.2.Convert other forms to covariances:
8.2.1.Convert CE plus LE to 3-D covariances 8.2.2.Convert CE to 2-D covariances 8.2.3.Convert LE to 1-D variance
8.2.4.Convert Standard Deviation to 1-D variance 8.2.5.Convert Spherical Error to 3-D covariances 9.Composite image exploitation services:
(Note: These higher level services use multiple lower level services) 9.1.Display window generation services:
(Note: Including image pan, zoom, rotate, and change histogram) 9.1.1.Monoscopic display window generation service 9.1.2.Stereoscopic display generation service 9.2.Object counting services
9.4.Synthetic image generation service 9.5.Intelligence data extraction services 9.6.Image registration services 10.Support metadata access services:
10.1.Image geometry model metadata access service 10.2.Spatial reference system (SRS) metadata access service 10.3.Coordinate transformation metadata access service 10.4.Image format metadata access service
10.5.Values (of pixels) metadata access service 10.6.Service capabilities metadata access service
10.7.Service properties (or strategies) metadata access service 10.8.Image geometry model transformation services
10.8.1.Fit approximate image geometry model to existing image geometry model 10.8.2.Convert image geometry model to different, mathematically equivalent model Editor’s Note: In the service categorization above, the top level items (numbered 1 through 10) are the current categorization of image exploitation services to be used for further detailing. That is, OGC abstract specifications will be prepared for each listed service category. The first three listed categories are the highest priority for further detailing, in the listed order.
The Coordinate Transformation WG is already developing abstract specifications for the first listed category “Ground Coordinate Transformation Services”. The Image Exploitation Services SIG plans to develop abstract specifications for the second listed category “Image Coordinate Transformation Services”. The “Image Modification Services” category partially overlaps the scope of the Simple Coverages RFP, and further development of abstract specifications for that category may be delayed until definitive responses to that RFP are received.
2.2.1.
Notes on the image exploitation service taxonomy
Some notes on the above taxonomy and categorization:1.This taxonomy favors similarity of the fundamental interfaces needed by different services (instead of similarities of services functions or use). Similarity of interfaces is more appropriate for development of multiple standard APIs to image exploitation services.
2.This taxonomy includes Automated Image Understanding Services (item 7) and Synthetic Image Generation Service (item 9.4), although these services are considered largely beyond the scope of this SIG. Many other services listed above under Composite Image Exploitation Services (item 9) are also largely beyond the scope of this SIG. These services are listed in this taxonomy in order to show how these higher level services are related to the image exploitation services within the scope of this SIG.
3.This taxonomy includes image coverage access services, although Coverages are a major concern of the Coverage Working Group. These coverage services are listed toward showing how this lower level service is related to and used by the image exploitation services within the scope of IES-SIG.
5.This taxonomy intends to exclude high level services that are largely the same for features and/or collections of features with geometry. For example, geodata discovery and access services (Catalog services) are not included.
6.Most listed image exploitation services are also applicable to other grid coverage types, and some listed services are also applicable to grid coverage types. However, other grid and non-grid coverage types will need additional services, not included here.
7.Some of the listed services will have distinct sub-items (not all listed) using, for example, a) only one image or coverage and b) multiple images or coverages.
2.3.
Uses of Other Services
Many of the image exploitation services listed above will use other listed services. For example, the Change Pixel Positions Services may use the Image-Ground Position Transformation Services. The service usage relationships are expected to produce a network of connected services, with some services being higher level and some being lower level in the service use network.
«uses»
Figure 2-2. Possible Usage Relationships Among Image Exploitation Services
2.4.
References for Section 2
[1] OpenGIS Abstract Specification, OpenGIS Project Documents 98-100 through 98-114, available through www as http://www.opengis.org/techno/specs.htm
3.
Abstract Specification for Image Exploitation Services
The following subsections provide more detailed descriptions of most of the image exploitation service categories listed in the preceding taxonomy. These descriptions do not describe the contents and formats of the “needed data” and “result data” of each service. The “needed data” could alternately be called inputs, and the “result data” could alternately be called outputs. The “needed data” and “result data” of multiple services are often identical or similar, so the possible contents and formats of this data are discussed later in Section 4.
The image exploitation services will often use and produce metadata about the geospatial data that is manipulated. Metadata is the subject of the Metadata SIG and of Topic 11 of the Abstract Specification. To start to define service interactions with metadata, the “needed data” and “result data” items listed are often annotated with “(is metadata for ...)”.
3.1.
Ground Coordinate Transformation Services
3.1.1.
Function
The Ground Coordinate Transformation services convert ground position coordinates between different Spatial Reference Systems (SRSs). Some service types may have operations that convert the positions of multiple points (not just one point at a time).
3.1.2.
Service subtypes
Service subtypes include but are not necessarily limited to the following: 3.1.2.1.Ground coordinate conversion (exact) services
3.1.2.1.1.Geodetic coordinate conversion services 3.1.2.1.2.Map projection conversion services
3.1.2.2.Ground coordinate transformation (approximate) services
3.1.2.2.1.Datum transformation services 3.1.2.2.2.Affine 2-D transformation service
3.1.2.2.3.General 2-D Polynomial transformation service 3.1.2.2.4.Polynomial 3-D transformation service
3.1.2.2.5.Vertical ground position transformation services 3.1.2.2.6.Other 3-D coordinate transformation services
3.1.2.2.7.Other 2-D horizontal ground position transformation services
3.1.2.3.Concatenated ground coordinate transformation services
These services may include two or more of the ground transformation and/or conversion services. Note: Although different interfaces could be used for different numbers of input and output coordinates for the services listed below, we consider such separation undesirable.
3.1.2.3.1.3-D to 3-D concatenated transformation 3.1.2.3.2.2-D to 2-D concatenated transformation 3.1.2.3.3.1-D to 1-D concatenated transformation
3.1.3.
Results Data
The data resulting from these services (output data) includes, but are not limited to: 1.Output ground position coordinates, in desired SRS
2.Partial derivatives of output position coordinates with respect to input position coordinates (optional, see note below)
4.Output SRS definition (is metadata for output positions)
5.Absolute accuracy estimates for output position coordinates (is metadata for output positions) 6.Relative accuracy estimates for output position coordinates (is metadata for output positions)
Note: Result metadata is optionally returned to client software, depending on how the service is called. Similarly, partial derivatives are optionally returned to client software. The ability to produce result metadata and partial derivatives when requested are required capabilities of this service category.
3.1.4.
Needed data
The data needed by these services (input data) includes, but are not limited to, the following: 1.Input ground position coordinates, in another SRS
2.Output SRS definition (is metadata for output positions)
3.Coordinate transformation parameters (optional) (is metadata for SRS or transformation) 4.Transformation accuracy estimates, for each SRS transformation (when output accuracy is needed)(is metadata for transformation)
5.Metadata for input position coordinates, including: 5.1.Input SRS definition (is metadata for input positions)
5.2.Absolute accuracy estimates for input position coordinates (when output absolute accuracy is needed) (is metadata for input positions)
5.3.Relative accuracy estimates for input position coordinates (when output relative accuracy is needed) (is metadata for input positions)
3.1.5.
Discussion
Ground Coordinate Transformation Services are considered a service category separate from the Image Coordinate Transformation Services (see Section 3.2) in order to limit the size of service categories. However, these two service categories require very similar interfaces, and they must be able to inter-operate easily. Specifically, the Concatenated Image Coordinate Transformation Services must be able to include individual or concatenated Ground Coordinate Transformation Services.
When a Ground Coordinate Transformation Service is needed, the corresponding service for the opposite direction will often also be needed. Instead of requiring a client to handle separate Ground Coordinate Transformation Services for each direction, it appears desirable to automatically link the corresponding Services for the two directions. This linking might be done in several ways, including: