CR-Form-v3
CHANGE REQUEST
SE 1.1.0 CR 07-105
rev
4
Current version:
1.1.0
Proposed change affects:
AS
Imp Spec
X
Recom. Paper
Other
Title:
SE Implementation Specification Change Request – extensions for thematic mapping
Source:
Ionut Iosifescu-Enescu (ETH Zurich) and EU FP7 ORCHESTRA Consortium
Work item code:
Date:
2007-08-17
Category:
B
Use one of the following categories: F (Critical correction)
A (corresponds to a correction in an earlier release)
B (Addition of feature),
C (Functional modification of feature) D (Editorial modification)
Detailed explanations of the above categories can be found in the TC Policies and Procedures.
Reason for change:
Organizations are developing interactive applications based on WMS servers
and the SLD WMS already provides an open framework supporting
implementation of various cartographic functionalities with minimal effort.
Standardized support for thematic mapping (e.g. proportional symbol maps,
Diagram maps, choropleth maps) is a requirement coming from the risk
management community (and also from other communities).
Summary of change:
SE/SLD extensions for thematic mapping
Consequences if
not approved:
Thematic mapping is ignored by the SE/SLD standards.
Clauses affected:
Other specs
X
Other core specifications
Affected:
Abstract specifications
Recommendation Papers
Change 1: Definition of a “DiagramSymbolizer”
Diagram symbolization of geographic features is an effective way of visualizing statistical
data in a spatial context, thus a “DiagramSymbolizer” is defined in order to allow
visualization of multiple data values using diagrams.
A
DiagramSymbolizer
is used to draw a diagram at a point. It has the following definition:
<xsd:element name="DiagramSymbolizer" type="se:DiagramSymbolizerType" substitutionGroup="se:Symbolizer"/>
<xsd:complexType name="DiagramSymbolizerType">
<xsd:complexContent>
<xsd:extension base="se:SymbolizerType">
<xsd:sequence>
</xsd:complexContent> </xsd:complexType>
The Geometry element is discussed in the latest SLD/SE specifications. If a line, polygon,
or raster geometry is used with this Symbolizer, then the semantic is to use the centroid of
the geometry, or any similar representative point.
The Name element is an optional name given to the DiagramSymbolizer describing the
resulting diagram layer.
<xsd:element name="se:Name" type="xsd:string"/>
The Diagram element is graphic symbol suitable for thematic mapping (e.g. proportional
symbols and diagrams) defined as following:
<xsd:element name="Diagram" type="se:DiagramType"/>
<xsd:complexType name="DiagramType">
<xsd:sequence>
<xsd:choice> <xsd:sequence>
<xsd:element ref="se:WellKnownName"/>
<xsd:element ref="se:Subtype" minOccurs="0"/>
<xs:element ref="se:Category" minOccurs="0" maxOccurs="unbounded"/>
<xsd:element ref="se:3D" minOccurs="0"/>
<xsd:sequence>
<xsd:element ref="se:SvgSymbol"/> </xsd:choice>
<xsd:element ref="se:Size" minOccurs="0"/>
<xsd:element ref="se:Scale" minOccurs="0"/>
<xsd:element ref="se:Opacity" minOccurs="0"/>
<xsd:element ref="se:Rotation" minOccurs="0"/>
<xsd:element ref="se:AnchorPoint" minOccurs="0"/>
<xsd:element ref="se:AnchorLine" minOccurs="0"/>
<xsd:element ref="se:Displacement" minOccurs="0"/>
<xsd:element ref="se:Halo" minOccurs="0"/>
</xsd:sequence> </xsd:complexType>
least “Pie”, “Bar”, “Line”, “Area”, “Ring”, and “Polar”, though map servers may have
additional (specialized) ones. The default WellKnownName is “Pie”.
<xsd:element name="WellKnownName" type="xsd:string"/>
The Subtype element gives the subtype of the diagram. Allowed values include
“Normal”, “Stacked” and “Percent”, though map servers may have additional
(specialized) ones. The default Subtype is “Normal”.
<xsd:element name="Subtype" type="xsd:string"/>
The
3D
element instructs the map server to create a 3D diagram (the
map server can choose freely how to create the 3D diagram). The default
3D is “false”.
<xsd:element name="3D" type="xsd:boolean"/>
The Category element defines one of multiple values from an ogc:PropertyName to be
represented in the diagram.
<xs:element name="Category" type="se:CategoryType"/>
<xsd:complexType name="CategoryType">
<xsd:sequence>
<xsd:element ref="se:Title" minOccurs="0"/>
<xsd:element ref="ogc:PropertyName"/>
<xsd:choice>
<xsd:element ref="se:SvgParameter"minOccurs="1"maxOccurs="unbounded"/>
<xsd:element ref="se:Symbolizer" minOccurs="1"maxOccurs="unbounded"/> </xsd:choice>
<xsd:element ref="se:Gap" minOccurs="0"/>
</xsd:sequence> </xsd:complexType>
The Title element is an optional name given to the Category. Is to be used by the
“GetFeatureInfo” operation on a diagram or by legend names.
<xsd:element name="se:Title" type="xs:string"/>
The SvgParameters and their values are derived from SVG/CSS2 standards with identical
names and semantics. They are defined in the in the latest SE specifications. The allowed
SVG/CSS styling parameters for a stroke are: “
stroke
” (color), “
stroke-opacity
”, “
stroke-width
”,
“
stroke-linejoin
”, “
stroke-linecap
”, “
stroke-dasharray
”, and “
stroke-dashoffset
”. The allowed
SVG/CSS styling parameters for a fill are: “
fill
” (color) and “
fill-opacity
”. Alternatively
PoligonSymbolizer
and
LineSymbolizer
may be used for styling.
The
SvgSymbol
element contains valid SVG code (including SVG-embedded raster images if
desired) that defines a symbol to be used for the representation of data values. It is to be used if no
diagrams are necessary as in the case of simple proportional symbol maps.
<xsd:element name="SVGSymbol" type="svg:svg"/>
The Gap element is an optional gap distance given to the Category. Is to be used by the
various diagram types to define a distance in rendering the various categories (e.g. for Bar
diagrams represents a gap between bars and for Pie diagrams it represents how much a
category should be exploded).
<xsd:element name="se:Gap" type="se:ParameterValueType"/>
ogc:PropertyNames it uses to map values to absolute sizes or a fixed absolute size can be
given.
<xsd:element name="Size" type="se:SizeType"/>
<xsd:complexType name="SizeType">
<xsd:sequence>
<xsd:choice>
<xsd:element name="Value" type="se:ParameterValueType"/>
<xsd:element ref="ogc:PropertyName" maxOccurs="unbounded"/>
<xsd:choice>
If more than one ogc:PropertyName element is encountered than the sum of all the
ogc:PropertyNames, which can be only numeric, is considered (allowing usually to define
the size of the diagram proportional with the total sum of the categories but also to define
a simple proportional symbol).
The Categorize and Interpolate elements have the same definition as in the section
11.6.4
from the
latest SE specifications. The LookupValue is set to
“ogc:PropertyName” with the semantic that the lookup is occurring in the values defined
in the ogc:PropertyName element (or their sum).
The use of Categorize element is best suited for the presentation of qualitative data and
the Interpolate element for the presentation of quantitative data.
An additional effect of using these elements is the implicit definition of the maximum and
minimum symbol sizes.
The Scale element allows scaling the defined absolute size of the diagrams or symbols to
various map scales.
<xsd:element name="Scale" type="se:ScaleType"/>
<xsd:complexType name="ScaleType">
<xsd:sequence>
<xsd:element ref="se:MinScaleDenominator"/>
<xsd:element ref="se:MinScaleSizeMultiplication"/>
<xsd:element ref="se:MaxScaleDenominator"/>
<xsd:element ref="se:MaxScaleSizeMultiplication"/>
</xsd:sequence> </xsd:complexType>
The MinScaleDenominator and MaxScaleDenominator elements have the same
definition as in the latest SE specifications.
<xsd:element name="MinScaleDenominator" type="xsd:double"/>
<xsd:element name="MaxScaleDenominator" type="xsd:double"/>
Corresponding to the scale denominators MinScaleSizeMultiplication and
specifies how much of the map area is covered with diagrams.
<xsd:element name="MinScaleSizeMultiplication" type="xsd:double"/> <xsd:element name="MaxScaleSizeMultiplication" type="xsd:double"/>The
Opacity
element gives the opacity to use for rendering each
diagram either by value or by associating an ogc:PropertyName to map data
thresholds to opacity values. The default value is “
1.0
”.
<xsd:element name="Opacity" type="se: OpacityType"/>
<xsd:complexType name="OpacityType">
<xsd:sequence>
<xsd:element ref="ogc:PropertyName"/> <xsd:choice>
<xsd:element name="Value" type="se:ParameterValueType"/> <xsd:element ref="se:Categorize"/>
<xsd:element ref="se:Interpolate"/> </xsd:choice>
</xsd:sequence> </xsd:complexType>
The
Rotation
element gives the rotation of a graphic in the clockwise
direction about its center point in decimal degrees, encoded either by
value or by associating an ogc:PropertyName to map data thresholds to opacity
values as floating-point numbers. Negative values mean
counter-clockwise rotation. The default value is 0.0 (no rotation). If a format
does not include an inherent rotation point or an
AnchorPoint
, then
the point of rotation should be the centroid. The diagram/symbol
rotation is important for wind maps.
<xsd:element name="Rotation" type="se: RotationType"/>
<xsd:complexType name="Rotation ">
<xsd:sequence>
<xsd:element ref="ogc:PropertyName"/> <xsd:choice>
<xsd:element name="Value" type="se:ParameterValueType"/> <xsd:element ref="se:Categorize"/>
<xsd:element ref="se:Interpolate"/> </xsd:choice>
</xsd:sequence> </xsd:complexType>
The
AnchorPoint
element gives the location inside of a
Diagram
(or
label) to use for anchoring the diagram to the main-geometry point.
The coordinates are given as two floating-point numbers in the
AnchorPointX
and
AnchorPointY
elements each with values
between 0.0 and 1.0 inclusive. The bounding box of the diagram/label
to be rendered is considered to be in a coordinate space from 0.0
(lower-left corner) to 1.0 (upper-right corner), and the anchor position
is specified as a point in this space. The default point is X=
0.5
, Y=
0.5
,
which is at the middle height and middle length of the diagram/label
text. A system may choose different anchor points to de-conflict
diagram/labels. It has the same semantics as in the latest SE
specifications.
<xsd:complexType name="AnchorPointType">
<xsd:sequence>
<xsd:element ref="se:AnchorPointX"/>
<xsd:element ref="se:AnchorPointY"/>
</xsd:sequence> </xsd:complexType>
<xsd:element name="AnchorPointX" type="se:ParameterValueType"/>
<xsd:element name="AnchorPointY" type="se:ParameterValueType"/>
The
AnchorLine
element specifically instructs the map server to
de-conflict diagram/labels by displacement as best possible and to draw
additional anchor lines to clearly associate the diagram/symbol with
its logical geometry point on the map.
<xsd:element name="AnchorLine"type="xsd:boolean"/>
The
Displacement
gives the X and Y displacements from the
“hot-spot” point. This element may be used to avoid over-plotting of
multiple diagrams used as part of the same point symbol. The
displacements are in units of measure above and to the right of the
point. The default displacement is X=0, Y=0. It has the same
semantics as in the latest SE specifications. If
Displacement
is used
in conjunction with
Size,
Scale
and/or
Rotation
then the diagram
symbol shall be scaled and/or rotated before it is displaced.
<xsd:element name="Displacement" type="se:DisplacementType"/>
<xsd:complexType name="DisplacementType">
<xsd:sequence>
<xsd:element ref="se:DisplacementX"/>
<xsd:element ref="se:DisplacementY"/>
</xsd:sequence> </xsd:complexType>
<xsd:element name="DisplacementX" type="se:ParameterValueType"/>
<xsd:element name="DisplacementY" type="se:ParameterValueType"/>
A
Halo
is a type of
Fill
that is applied to the backgrounds of font
glyphs. The use of halos greatly improves the readability of text
labels.
Halo
is defined as:
<xsd:element name="Halo" type="se:HaloType"/>
<xsd:complexType name="HaloType">
<xsd:sequence>
<xsd:element ref="se:Radius" minOccurs="0"/>
<xsd:element ref="se:Fill" minOccurs="0"/>
</xsd:sequence> </xsd:complexType>
<xsd:element name="Radius" type="se:ParameterValueType"/>
containing
DiagramSymbolizer
, then no halo will be rendered. The
definition is similar with the one present in the latest SE specification.
Final Note:
A
DiagramSymbolizer
is similar with the
PointSymbolizer
as the diagrams are also point
symbols. It was preferred to be defined separately for an easier integration into existing SLD
implementations. The
DiagramSymbolizer
allows SLD/SE extension for a thematic mapping
profile of SLD (for point symbols) and does not impose unnecessary changes in existing SLD/SE
implementations. However, if the Diagram element is preferred to be included (as conceptually
correct) in the PointSymbolizer then the following modification of the PointSymbolizer will apply
(everything else remaining the same):
<xsd:element name="DiagramSymbolizer" type="se:DiagramSymbolizerType" substitutionGroup="se:Symbolizer"/>
<xsd:complexType name="DiagramSymbolizerType">
<xsd:complexContent>
<xsd:extension base="se:SymbolizerType">
<xsd:sequence>
<xsd:element ref="se:Geometry" minOccurs="0"/>
<xsd:element ref="se:Graphic" minOccurs="0"/> <xsd:element ref="se:Diagram" minOccurs="0"/>
</xsd:sequence>
</xsd:extension>
</xsd:complexContent> </xsd:complexType>
Reference implementation
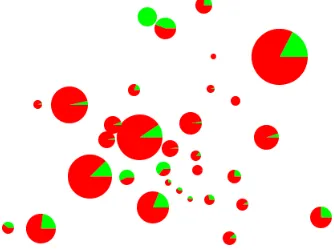
A reference implementation is under way which is already capable of generating simple Pie and
Bar diagram layers (Fig. 1, Fig. 2).
Fig. 1. Output of a GetMap request with an SLD_BODY containing only a DiagramSymbolizer
End of Change 1.
Change 2: Definition of classification methods “EqualInterval”, “NaturalBreaks”,
“Quantile”, “StandardDeviation”
The definition of
classification
methods like “EqualInterval”, “NaturalBreaks”, “Quantile”,
“StandardDeviation” makes the creation of choropleths maps straightforward. Classification
methods allows interactive Web mapping clients to easily serve also as exploratory data
visualization backend tools (a requirement in the risk management domain). It allows the user to
get a first impression of the spatial distribution of the attribute data before creating more lengthy
ogc:Filters
definitions to manually define classes.
The
Classification
element can be added to the “Rule” element:
<xsd:element name="Rule" type="se:RuleType">
</xsd:element>
<xsd:complexType name="RuleType">
<xsd:sequence>
<xsd:element ref="se:Name" minOccurs="0"/>
<xsd:element ref="se:Description" minOccurs="0"/>
<xsd:element ref="se:LegendGraphic" minOccurs="0"/>
<xsd:choice minOccurs="0">
<xsd:element ref="ogc:Filter"/>
<xsd:element ref="se:ElseFilter"/>
</xsd:choice>
<xsd:element ref="se:MinScaleDenominator" minOccurs="0"/>
<xsd:element ref="se:MaxScaleDenominator" minOccurs="0"/>
<xsd:element ref="se:Symbolizer" maxOccurs="unbounded"/>
<xsd:element ref="se:Classification" minOccurs="0"/>
</xsd:sequence> </xsd:complexType>
When the
Classification
element is present inside a
Rule
element then the number of
Symbolizers
of the same type has to be at least equal (or greater) with the number of classes that will be defined
in the
Classification
element.
<xsd:element name="Classification" type="se:ClassificationType"/>
<xsd:complexType name=" ClassificationType">
<xsd:sequence>
<xsd:element ref="ogc:PropertyName"/>
<xsd:element ref="se:Normalization" minOccurs="0"/> <xsd:element ref="se:Method" minOccurs="0"/>
The ogc:PropertyName has the same semantic as in the latest SE specification. It refers
to a field of the attribute data associated with the feature geometry.
ogc:PropertyName which allows the normalization of the data to be
classified.
<xsd:element name="Normalisation" type="se:NormalisationType"/>
<xsd:complexType name=" ClassificationType">
<xsd:sequence>
<xsd:choice>
<xsd:element ref="ogc:PropertyName"/>
<xsd:element name="Value" type="se:ParameterValueType"/> </xsd:choice>
</xsd:sequence> </xsd:complexType>
The Method element gives the name of the classification method to be applied. Allowed
values include
“
EqualInterval
”, “
NaturalBreaks
”, “
Quantile
”,
“
StandardDeviation
”
. The default Method is “
EqualInterval
”.
<xsd:element name="Method"/>
<xsd:simpleType>
<xsd:restriction base="xsd:string">
<xsd:enumeration value="EqualInterval"/> <xsd:enumeration value="NaturalBreaks"/> <xsd:enumeration value="Quantile"/>
<xsd:enumeration value="StandardDeviation"/> </xsd:restriction>
</xsd:simpleType> </xsd:element>
The NoClasses element specifies the number of classes in the classification. The default
number of classes is 5. It is to be used in conjunction with the
“
EqualInterval
”,
“
NaturalBreaks
” and “
Quantile
” classification methods.
<xsd:element name="se:NoClasses" type="se:ParameterValueType"/>
The Interval element specifies the interval size for the “
StandardDeviation
” classification
method. The default is 1 standard deviation. It is to be used only in conjunction with the
“
StandardDeviation
” classification method.
<xsd:element name="se:Interval" type="se:ParameterValueType"/>
Final Note:
The use of classification methods allows easy-to-define user symbolization for attribute data
attached to Feature Types (geometries). It allows the user to get a first impression of the spatial
distribution of the attribute data before creating more lengthy
ogc:Filters
definitions to manually
define classes.
For the client to be able to manually-define intervals, the DescribeLayer operation must contain
also Count, Minimum, Maximum, Sum, Mean, Standard Deviation, and Histogram of every
ogc
:
PropertyName
to which the map server offers access to which is not always possible or even
desirable.
End of Change 2.
SE defines only basic
Marks
which has coloring applied to it. The WellKnownName element gives
the name of the shape of the mark. Allowed values include at least “square”, “circle”, “triangle”,
“star”, “cross”, and “x”. The alternative to a WellKnownName is an external or in-lined graphic
format (including complete SVG files) which it is handled as “a little picture”, thus limiting its
scalability.
A better solution is to enhance the “
Mark
” element explicitly with SVG (Scalable Vector Graphics)
point symbol definitions:
<xsd:element name="Mark" type="se:MarkType"/>
<xsd:complexType name="MarkType">
<xsd:sequence>
<xsd:choice minOccurs="0">
<xsd:element ref="se:WellKnownName"/>
<xsd:element ref="se:SvgSymbol"/>
<xsd:sequence>
<xsd:element name="WellKnownName" type="xsd:string"/>
<xsd:element name="SVGElement" type="svg:svg"/>
<xsd:element name="MarkIndex" type="xsd:integer"/>
The
SvgSymbol
element can contain any valid SVG code (including gradients and patterns).
Simples example:
<svg:path d="M 0 0 L 7 0 L 3.5 7 z" fill="blue" stroke="red"/>
<svg ><path d="M 0 0 L 7 0 L 3.5 7 z" fill="blue" stroke="red"/></svg>
More complex examples can contain symbols styled with SVG gradients (or SVG filters):
<svg width="100%" height="100%" xmlns="http://www.w3.org/2000/svg"><defs>
<radialGradient id="grey_blue" cx="50%" cy="50%" r="50%" fx="50%" fy="50%">
<stop offset="0%" style="stop-color:rgb(200,200,200); stop-opacity: 0"/> <stop offset="100%" style="stop-color:rgb(0,0,255); stop-opacity: 1"/> </radialGradient>
</defs>
<ellipse cx="230" cy="200" rx="110" ry="100" style="fill:url(#grey_blue)"/>
</svg>
Raster images can be also embedded in SVG although it is discouraged.
SvgSymbol
used together
with the
DiagramSymbolizer
can produce expressive proportional symbol maps.
End of Change 3.
The
Stroke
element of the
LineSymbolizer
includes
SvgParameters
like “
stroke-dasharray
”,
and “
stroke-dashoffset
” which allows encoding dash patterns for linear geometries.
On the other hand, the
Fill
element of the
PolygonSymbolizer
not yet defines encodings for
patterns and gradients for polygons or area-type geometries. A possible solution is to enhance the
Fill
element with SVG-based patterns and gradients:
<xsd:element name="Fill" type="se:FillType"/>
<xsd:complexType name="FillType">
<xsd:sequence>
<xsd:choice>
<xsd:element ref="se:GraphicFill" minOccurs="0"/>
<xsd:element ref="se:SvgParameter" minOccurs="0" maxOccurs="unbounded"/>
<xsd:element ref="se:SvgRadialGradient" minOccurs="0"/> <xsd:element ref="se:SvgLinearGradient" minOccurs="0"/> <xsd:element ref="se:SvgPattern" minOccurs="0"/> </xsd:choice>
</xsd:sequence> </xsd:complexType>
The
SvgRadialGradient
and
SvgLinearGradient
elements must contain valid SVG code (that
can be validated against the SVG XML schema or parts of it) for defining a gradient for polygons
or area-type geometries.
<xsd:element name="SvgRadialGradient" type="svg:radialGradient"/>
<xsd:element name=" SvgLinearGradient" type="svg:linearGradient"/>
Example for
RadialGradient
:
<svg:radialGradient id="RadialGradientGreyBlue" cx="50%" cy="50%" r="50%" fx="50%" fy="50%"> <stop offset="0%" style="stop-color:rgb(200,200,200); stop-opacity: 0"/>
<stop offset="100%" style="stop-color:rgb(0,0,255); stop-opacity: 1"/> </svg:radialGradient>
Although no
ConicalGradient
is defined, the future SE specifications may choose to define one.
The
SvgPattern
element contains valid SVG code (that can be validated against the SVG XML
schema or parts of it) for defining a pattern for polygons or area-type geometries.
<xsd:element name="SvgPattern " type="svg:pattern"/>