Brain Research 887 (2000) 432–435
www.elsevier.com / locate / bres
Short communication
The afferent origin of the secondary somatosensory evoked potential
from the lower limb in humans
a ,
*
a b a b,cA.J. Nelson
, J.D. Brooke , W.E. McIlroy , C.M. Linklater , W.R. Staines
a
Human Neurophysiology Laboratory, Department of Human Biology and Nutritional Science, University of Guelph, Guelph, Ontario,
Canada N1G 2 W1 b
Graduate Department of Rehabilitation Science, University of Toronto, Toronto, Ontario, Canada M5T 1 W5 c
Department of Medicine(Neurology), University of Toronto, Toronto, Ontario, Canada Accepted 19 September 2000
Abstract
The afferent origin of the secondary somatosensory evoked potential elicited from stimulation of the sural and tibial nerves was investigated as the limb was cooled. It was hypothesized that the peak of this potential is initiated from primary afferents in the Aagroup. We conclude that the peak of the secondary SEP arises from an afferent source whose diameter is of similar size to that of large diameter Aa afferents. 2000 Elsevier Science B.V. All rights reserved.
Theme: Sensory systems
Topic: Somatosensory cortex and thalamocortical relationships
Keywords: A-alpha; A-beta; Afferents; Conduction; Group I
1. Introduction of sub-maximal amplitude. With cooling, a similar delay in the latency of the P1 and P2 components would suggest The electroencephalogram, following stimulation of a that P2 arises from large diameter afferents, similar to nerve in the lower limb, displays a positive wave followed those initiating the primary complex. Confirmation of this by a negative one, the first cortical complex (P1–N1). A hypothesis would suggest that the later occurring P2 second waveform (P2–N2) appears approximately 20 ms component arises from additional processing of Aa affer-after the first cortical complex. The origin of this sec- ent input through central pathways and nuclei. While the ondary potential is not clear and the aim of the present cooling technique employed allowed us to investigate the investigation was to explore its afferent origins. To sepa- origin of the peak of P2, it did not differentiate between rate the potential contributions of large versus small muscle and cutaneous afferents that travel at similar diameter afferent inputs we cooled the limb. Cooling a velocities. The results have been published in part in peripheral nerve results in a greater increase in conduction abstract [7].
time for slow, small diameter afferents than for fast, large diameter afferents [8].
The latency of the tibial and sural nerve SEP was
investigated when the lower limb was cooled and the 2. Materials and methods
evoking stimulus was mild, producing a primary potential
2.1. Subjects
*Corresponding author. Division of Neurology, Room A421, Eight healthy volunteers (four females, four males, aged Sunnybrook Health Science Centre, University of Toronto, 2075 Bayview
21–27 years) gave informed consent prior to their
partici-Avenue, North York, Ontario, Canada M4N 3M5. Tel.: 1
1-416-480-pation. The local ethics committee approved the
ex-6100, ext. 3396; fax:11-416-480-4552.
E-mail address: [email protected] (A.J. Nelson). perimental procedure.
A.J. Nelson et al. / Brain Research 887 (2000) 432 –435 433
2.2. Stimulation Subjects sat in a reclined customized chair with their
supported legs extended. Warm water was pumped through A square wave pulse of 0.5 ms duration (Grass S88 the tubing for 30 min, followed by cold water (between 8 stimulator with SIU5A Stimulus Isolation Unit, Grass Inst., and 128C) for 90 min and finally warm water (38–428C) MA, USA) was delivered to the skin over the tibial and for 30 min. SEPs were recorded in blocks of 50 samples sural nerves at the ankle on both limbs. The intensity of after electrical stimulation of the tibial or sural nerve: (1) tibial nerve stimulation was controlled by maintaining before warming, ‘neutral’, (2) after 30 min of warming, stable M waves in abductor hallucis via Ag /AgCl elec- (3) every 30 min during cooling, (4) after 30 min of trodes. Stimulus intensity was maintained at 2 times re-warming. During cooling, SEPs from the non-cooled perceptual threshold, defined as the lowest detectable limb were recorded at 90 min. Water, room and skin stimulus intensity, for sural nerve stimulation. temperature measurements were recorded following each
SEP collection.
2.3. Recording procedures
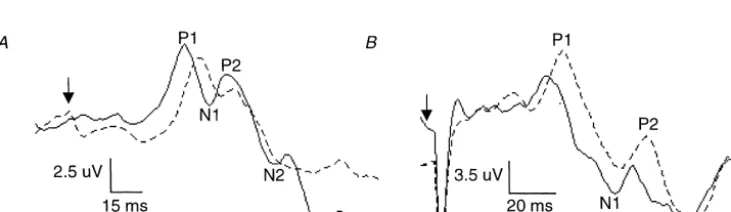
2.5. Data analysis SEPs were recorded from Cz9 and referenced to Fpz9
(Electro-cap International, Eden, OH, USA). Impedance at Latencies of average SEPs were measured from stimulus scalp electrodes was ,3 kV (EZM5 impedance meter, onset to the peaks of the first four waveforms (P1, N1, P2 Grass Inst.). Evoked potentials and EMG recordings were and N2, respectively), as illustrated in Fig. 1A. Mean amplified (340 000, 31000, respectively) and filtered peak-to-peak M wave amplitudes were measured from (band-pass 1–100 and 3–300 Hz, respectively) with an abductor hallicus and expressed as a percentage of the isolated bioelectric amplifier (SA Instruments, San Diego, maximal attainable M wave (Mmax). Statistical analysis for CA, USA). Data were sampled at 1000 Hz (Keithley the latency of each SEP waveform component, mean M DAS-1800 HC, Taunton, MA, USA) for 150 ms, including wave amplitudes and skin temperatures, used a one way a 30-ms pre-stimulus period. analysis of variance (ANOVA) blocked on subjects. Con-ditions used in the ANOVA were warmed’ (after 30 min of warming), ‘cooled 30 min’, ‘cooled 60 min’, ‘cooled 90
2.4. Cooling procedure min’ and ‘re-warmed’ (after 30 min of re-warming). The
absolute change in latency from the neutral to subsequent The cooling procedure [5,12] used polyvinyl tubing temperature states was tested using a two-way ANOVA, (10-mm internal diameter; 1.5-mm walls) wrapped spirally blocked on subjects, the conditions being ‘time in minutes’ around the left lower limb from just below the groin to just with five levels (30, 60, 90, 120, 150 min) and wave above the ankle. A pump was used to push water through component (P1, N1, P2, N2). The primary research the tubing, entering at the level of the thigh. The water in hypothesis (change in the latency of P1 versus P2) at the the basin was maintained between 37 and 448C during most cooled (120 min) compared to the most warmed (30 initial warming and re-warming and 8 and 128C during min) state was tested specifically with an a priori com-cooling. Skin temperature probes were stuck to the skin on parison (t-test with Bonferroni correction) utilizing the the cooled and non-cooled limb at the popliteal fossa, calf, appropriate mean square error from the analysis of vari-internal malleolus and sole of the foot proximal to the ance [4]. Statistical significance was set at P#0.05. The hallux. A digital thermometer (2100 Tele-thermometer, amplitudes of these waves were assessed by measuring the YSI, Yellow Springs, OH, USA) was used to measure the peak-to-peak magnitude for the P1 to NI and P2 to N2 water, room and skin temperatures to a precision of 0. 18C. components.
434 A.J. Nelson et al. / Brain Research 887 (2000) 432 –435
3. Results
From the most warmed to the most cooled state, mean skin temperature was decreased by 45% at the popliteal fossa (F [1,23]592.90, P,0.05), 46% at the calf (F [1,23]575.45, P,0.05), 15% at the medial malleolus (F [1,23]525.36, P,0.05), and 12% at the sole of the foot (F [1,231513.18, P,0.05). Skin temperatures were not significantly affected at any location in the control limb. Fig. 1 shows averaged (A) tibial nerve and (B) sural nerve SEPs (n560) from one subject after 30 min of warming and 90 min of cooling. As can be seen in this subject, both the P1 and P2 components are similarly delayed with cooling for both tibial and sural nerve stimulation. The group data revealed that the sural and tibial P1 components were significantly delayed in the most cooled versus warmed state ([F(1,23)544.44, 76.02], P,0.05 for sural
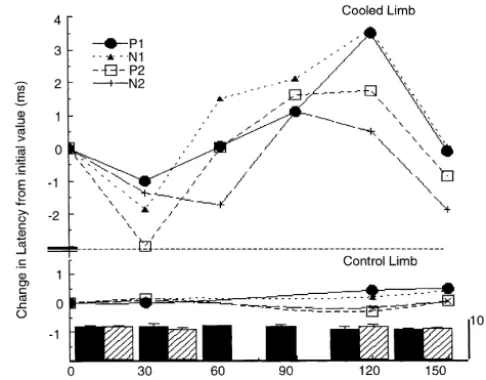
Fig. 3. Effect of temperature on tibial nerve elicited SEPs. Change in
and tibial, respectively) confirming that peripheral cooling
latency of P1, N1, P2 and N2 from neutral (0 min) to most warmed (30
successfully slowed conduction in the largest and fastest
min), cooled (60, 90, 120 min) and re-warmed (150 min) throughout the
afferent fibres. From the warmed to most cooled state, both experiment. Records for non-cooled limb at 0, 30, 120 and 150 min only. N1 ([F(1,23)540.38, 20.64, P,0.05 for sural and tibial Each point shown represents an average of eight data points. Solid
nerve]) and P2 ([F(1,23)516.36, 7.95, P,0.05 for sural histogram, mean M wave (n52) and S.E. recorded from cooled limb. Crossed histogram, mean M wave (n52) and S.E. recorded from the
and tibial, respectively) were delayed significantly. The N2
non-cooled limb. S.E. values for means are given in text.
component from tibial and sural was delayed by 1.9 and 3.6 ms, respectively, from warmed to most cooled. At 60 min of cooling the delay observed was statistically signifi-cant (P,0.05), although not at 90 min (P.0.05).
Comparison of the delay induced in the different SEP Fig. 2, show that both P1 and P2 are delayed to a similar wave peaks was the central purpose of this paper. We extent from the most warmed to most cooled state (P1 / calculated the difference between the latency for the P2–7.8 / 6.0 ms). The delays observed in P1 and P2 did not neutral value and that for subsequent values. The mean differ significantly (F [1,84]50.20, P.0.05). The N2 delay delays (n58) for sural nerve SEP components, shown in was significantly shorter than the Ni delay (F [l,84]55.47,
P,0.05). Sural nerve SEP latencies from the control limb did not alter significantly with cooling (Fig. 2). Mean delays for tibial nerve SEP components are shown in Fig. 3. Similar to the sural nerve it can be seen that the delay for P1 between the most warmed and cooled states did not differ significantly from that P2 (F [1,84]52.37, P.0.05). The delay for N2 was significantly shorter than that for Ni (F [1,84]57.54, P,0.05), similar to the sural nerve. SEPs recorded from the control limb were not significantly affected by cooling (P.0.05). The figure also shows that the M wave amplitude recorded in the EMG from the abductor hallucis muscle, and used for biocalibration of the stimulus input, remained stable for both limbs throughout the experiment.
There were no significant differences in mean am-plitudes between temperature states for SEP components elicited from sural or tibial nerve stimulation at the ankle (P.0.05). The mean and standard error of P1–N1 and P2–N2 were 4.760.2 and 4.660.5mV for sural nerve and
Fig. 2. Effect of temperature on sural nerve elicited SEPs. Change in 5.460.4 and 6.260.9 mV for tibial nerve, respectively. latency of P1, N1, P2 and N2 from neutral (0 min) to warmed (30 min),
Amplitudes of SEP components recorded from stimulation
cooled (60, 90, 120) and re-warmed (150 min). Non-cooled limb, shown
in the control limb did not alter significantly throughout
at 0, 30, 120 and 150 min only. Each point shown represents an averaged
A.J. Nelson et al. / Brain Research 887 (2000) 432 –435 435 [2] J.W. Hutchinson, J.A. Kusske, M. Verzeano, Cortical and thalamic
4. Discussion
activity in the late phases of somatosensory evoked potentials, Electroencephalogr. Clin. Neurophysiol. 45 (1978) 35–44.
The central hypothesis of the present work was con- [3] J. Karhu, R. Hari, J.P. Makela, J. Huttunen, J. Knuutila, Cortical firmed. Primary afferents of large diameter contribute to somatosensory magnetic responses in multiple sclerosis,
Elec-both the primary and secondary somatosensory evoked troencephalogr. Clin. Neurophysiol. 83 (1992) 192–200.
[4] R.O. Kuehl, in: Statistical Principles of Research Design and
potentials. It has been proposed that the leading edge of
Analysis, Duxbury Press, Belmont, CA, 1994.
this primary complex arises from group I afferents [1]. The
[5] P.B.C. Matthews, Long-latency stretch reflexes of two intrinsic
similar delays with the cooling support such a suggestion, muscles of the human hand analysed by cooling the arm, J. Physiol. while not excluding a contribution from cutaneous affer- 419 (1989) 519–538.
ents of Aa class. With peripheral cooling, P1 and P2 [6] M. Mesulam, From sensation to cognition, Brain 121 (1998) 1013– 1052.
components of the sural and tibial SEP were delayed
[7] A.J. Nelson, J.D. Brooke, W.E. McIlroy, D.C. Bishop, R.G. Norriee,
similarly. This is strong support for the proposal that both
The afferent origin of the secondary cortical somatosensory evoked
components arise from the same, large diameter Aa, potential analysed by cooling the lower limb, Soc. Neurosci. Abstr.
afferent source. 2 (1999) 2197.
From the present conclusions, it appears that the sec- [8] A.S. Paintal, Block of conduction in mammalian myelinated nerve fibres by low temperatures, J. Physiol. 180 (1965) 1–19.
ondary complex arises from conduction over a more
[9] A. Rossi, B. Decchi, V. Groccia, R. Delia Volpe, R. Spidalieri,
extensive CNS path than the primary one, likely involving
Interactions between nociceptive and non-nociceptive afferent
pro-synapses onto additional central nuclei. This may involve a jections to cerebral cortex in humans, Neurosci. Lett. 248 (1998) serial cortico-cortical path or feedback loop, within the 155–158.
somatosensory cortex or involving loops to other brain [10] M.J. Rowe, A.B. Turman, G.M. Murray, H.Q. Zhang, Parallel organization of somatosensory cortical areas I and Ii for tactile
regions [2,6,10,11,13]. An alternative is that afferent input
processing, Clin. Exp. Pharmacol. Physiol. 23 (1996) 931–938.
may diverge at a supraspinal level so that these neural
[11] D.N. Rushton, J.C. Rothwell, M.D. Craggs, Gating of somatosensory
signals are processed in parallel, e.g., involving also the evoked potentials during different kinds of movement in man, Brain cerebellum [3]. The functional significance of this brain 104 (1981) 465–491.
circuitry for perception [9] now is worthy of exploration. [12] M. Schieppati, A. Nardone, Medium-latency stretch reflexes of foot and leg muscles analysed by cooling the lower limb in standing humans, J. Physiol. 503 (1997) 691–698.
[13] U. Tan, S. Caliskan, Modulation of the somatosensory evoked
Acknowledgements potentials by the input information originating from the
gastroc-nemius and sural nerves in the dog, Int. J. Neurosci. 38 (1988)
We thank Dr. John Misiaszek for his valuable com- 151–178.
ments. This study was supported by the Natural Science and Engineering Research Council of Canada to J.D.B and to A.J.N.
References