L
Journal of Experimental Marine Biology and Ecology 244 (2000) 161–180
www.elsevier.nl / locate / jembe
Bias associated with statolith-based methodologies for ageing
squid; a comparative study on illex illecebrosus
(Cephalopoda: Ommastrephidae)
a b ,* b c
´
A.F. Gonzalez , E.G. Dawe , P.C. Beck , J.A.A. Perez a
Instituto de Investigaciones Marinas(CSIC), Eduardo Cabello 6, 36208 Vigo, Spain
b
Science Branch, Department of Fisheries and Oceans, P.O. Box 5667, St. John’s, NF, Canada A1C 5X1
c
ˆ
FACIMAR-Faculdade de Ciencias do Mar, UNIVALI-Universidade do Vale do Itajai, Rua Uruguai, 458-Cx. Postal 360, CEP 88.302-202, Itajai-Santa Catarina, Brazil
Received 13 November 1997; received in revised form 2 September 1999; accepted 2 September 1999
Abstract
Estimates of ages for short-finned squid (Illex illecebrosus LeSueur) were derived from two different methods for preparing statoliths and enumerating daily increments. Each pair of statoliths was divided between two experienced agers. One (Ager B) ground the statoliths on one side in the frontal plane for examination by light microscopy with camera lucida. The other (Ager G) ground statoliths on two sides in the sagittal plane for examination by light microscopy with an image analysis system. Mean counts of increments did not differ between the two agers reflecting similar peak hatching periods and patterns of migration. Systematic differences were, however, evident in that counts by Ager G were larger in young squid and smaller in old squid than those by Ager B. Crossing of methods suggested that estimated age was affected by the method of preparation of statoliths, but bias between agers was primarily due to differences in methods of interpreting and enumerating increments. This bias greatly affected estimates of growth rates. Rates of growth of groups obtained by the two agers based on the estimated month of hatching were compared with those of individual gladii. Such comparisons failed to identify which method was the more reliable because of small sample sizes and poor fit of the growth model, as well as uncertainty regarding the effects of time of hatching on growth rate. This uncertainty was related to unknown error in the estimation, from statoliths, of age and time of hatching. Broad-scale collaborative studies are recommended, involving exchange of unprocessed and processed statoliths among agers, to
evaluate precision and maximize consistency among investigators. 2000 Elsevier Science B.V.
All rights reserved.
Keywords: Squid; Statolith; Ageing methodology; Gladius; Bias
*Corresponding author. Tel.:11-709-772-2076; fax:11-709-772-4105.
E-mail address: [email protected] (E.G. Dawe)
´
162 A.F. Gonzalez et al. / J. Exp. Mar. Biol. Ecol. 244 (2000) 161 –180
1. Introduction
The study of direct ageing methodology using increment-bearing hard structures is a new field in cephalopods (Jackson, 1994) relative to in fishes (Summerfelt and Hall, 1987; Stevenson and Campana, 1992). Daily increment formation in cephalopod statoliths has been validated for few species and it is of some concern that such studies have been extended to many species, without accompanying validation studies (Jackson, 1994). Even for those species for which daily statolith increment formation has been validated, nothing is known of the error associated with detecting and enumerating daily increments.
It is appropriate to select Illex illecebrosus as the study species for an investigation of error in age determination in cephalopods. This species was the subject of some of the earliest statolith-based ageing experiments (Lipinski, 1978; Hurley and Beck, 1979; Radtke, 1983; Morris and Aldrich, 1985). It is one of the few for which daily increment formation in statoliths has been validated (Jackson, 1994), for hatchlings (Balch et al., 1988) as well as for maturing squid (Dawe et al., 1985; Hurley et al., 1985). This species is also one of the few for which a gladius-based method of estimating growth rate has been applied (Perez, 1994; Perez et al. 1996). Statolith-based ageing methods have also been applied to other short-finned squid of the genus Illex (Rodhouse and Hatfield, 1990; Arkhipkin, 1993; Uozumi and Shiba, 1993; Arkhipkin and Laptikhovsky,
´
1994; Sanchez, 1995; Gonzalez et al. 1996).
Dawe and Beck (1997) noted that although general demographic features such as age structure and seasonal trends in growth were similar among Illex species, the accuracy of estimated absolute ages and growth rates within any study remain unknown. They stressed that differences in such population parameters among independent studies could be largely due to bias associated with differences in methods used for both preparing statoliths and enumerating increments. They recommended that ‘The possible effects of differences among methodologies should be investigated through comparative studies’. Independent studies on several other squid species (reviewed by Jackson, 1994) suggest that such methodological effects may be great. Only one limited study to date has directly compared two different methodologies by using matched statolith pairs (Lipinski and Durholtz, 1994). That study showed that there were great differences between a method based on light microscopy and one based on scanning electron
´
microscopy. Gonzalez et al. (1998) applied two relatively similar light microscopy methods involving image analysis to a common set of Illex coindetii statoliths. They found considerable differences in estimated age between a manual method, whereby the investigator identified increments on the monitor, and a semi-automatic method, which utilized image enhancement and editing of software-identified increments.
The purpose of this study is to investigate the possible existence of bias associated with two very different methods used for both preparing statoliths and enumerating increments. The approach taken is to divide each statolith pair between two independent agers, each experienced in his own unique method. We also investigate sources of bias between ager-specific methodologies, based on one ager’s analysis of the other ager’s statolith preparations. Effects of the different methods on estimated age, hatching time and growth-rate are examined. Growth rates from both statolith-based ageing methods are compared with those obtained independently from gladius analysis, toward inferring which ageing method is the more reliable.
2. Materials and methods
2.1. Sampling
Samples of whole squid were obtained from the Newfoundland inshore jig fishery at New Bonaventure on August 31 and at LaScie on September 21 and 23, 1994. Specimens were immediately frozen and subsequently thawed for examination. Sex was determined for each specimen and dorsal mantle length was measured to the nearest mm. Representative specimens of each sex were sub-sampled for age determination from each 5 mm mantle length group. The gladius was extracted from representative specimens.
2.2. Statolith methodology
Statoliths of each pair were divided between independent agers. In instances where one statolith of a pair was lost or destroyed in preparation, both statoliths were rejected. This resulted in a total of 128 statolith pairs available for this comparative study. One set of statoliths was analyzed by Ager B (PCB), according to methodology described by Dawe and Beck (1997), whereas the other set was analyzed by Ager G (AFG), according to methodology described in Macy (1995). A brief review of these different methodologies follows.
Ager B. This method involves initially mounting the statolith on a microscope slide, using Protexx, with the rostrum removed and the dorsal dome uppermost. Grinding the statolith then was on only one side, in the frontal plane. Ground surfaces prepared using this method were small in area, but problems of occulting crystals and numerous focal planes were reduced in comparison with grinding one side in the sagittal plane (Lipinski and Durholtz, 1994; Dawe and Beck, 1997).
Increments were enumerated using an optical microscope (2003 magnification), with the aid of a camera lucida. The drawing arm was used to produce a permanent record of increments from the focus to the lateral dome. It facilitates counting increments wherever on the ground surface they were most clearly visible. It was frequently necessary to estimate number of unclear increments at the outer edge of the ground surface based on the number of increments in an adjacent inner section of comparable width.
´
164 A.F. Gonzalez et al. / J. Exp. Mar. Biol. Ecol. 244 (2000) 161 –180
Crystalbond, with the anterior concave side uppermost. The statolith is ground first on the anterior surface, and then it is turned over and ground on the posterior surface. Then the statolith is again turned over so that the anterior surface is uppermost. This grinding of both surfaces in the sagittal plane results in the production of a relatively thin statolith section.
Increments were enumerated along the axis of maximum statolith growth using an optical microscope (4003 magnification) with an image analysis system (Macy, 1995). Counts were obtained semi-automatically in that increments detected automatically by computer software from an enhanced image were subjectively modified, by addition or deletion, by the ager. Increment counts in unclear regions near the outer margin of the ground surface were estimated by extrapolation from the adjacent area.
2.3. Gladius methodology
Gladii were extracted and preserved in 15% formalin. For comparison of individual gladius growth rates with statolith-derived group growth rates 19 gladii were sub-sequently selected from the three peak hatching months, as estimated by both agers. They were subsequently prepared and analyzed according to Bizikov (1991). Each gladius was measured for total length (GL) and marked at 10 mm intervals from the posterior (fins) to the anterior (head) end. The dorsal surface of the ostracum was then examined under a dissecting microscope at 20 to 303 magnification using a combina-tion of incident and transmitted light. Growth increments of the ostracum were counted in each 10 mm gladius length interval from the anterior toward the posterior end until increments were no longer visible (Perez et al., 1996). The mean spacing between growth increments (mean growth increment in mm) was calculated by dividing 10 mm by the number of growth increments counted in each gladius length interval.
2.4. Treatment of data
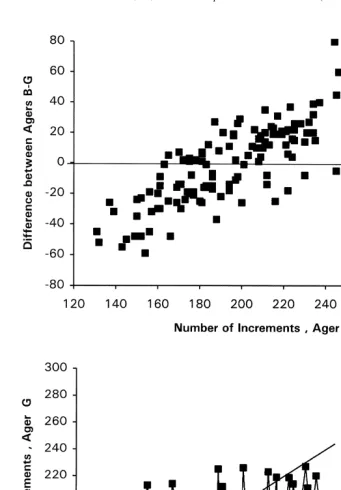
Age difference and age bias plots were generated to illustrate the possible existence of systematic age differences between the two agers. Campana et al. (1995) recommended using only age bias plots, with confidence intervals to describe bias. However, we included age difference plots (Campana et al., 1995) rather than confidence intervals to reflect variability because of the great range of estimated ages and few observations at many putative ages in our study.
To investigate the relative effects of method of preparation versus method of interpreting and enumerating increments, statoliths prepared by Ager G (for image analysis) were also examined by Ager B using his camera lucida method. The resultant increment counts are designated as those of Ager B(G). Ager B(G) increment counts were compared with those Ager G (from the same set of prepared statoliths) using age difference and age bias plots, as described above for Ager B versus Ager G comparisons.
be the dependent variable because mantle length is the more accurately measured and the true age is unknown (Lipinski and Durholtz, 1994). The data for increment count regressed on mantle length were then examined using a general linear model described as follows:
Yijk5m 1 a 1 b 1i j (abij)1b(ZijK)1eijk
where Yijk is the response variable (i.e. age), Zijk is the continuous covariate (i.e. mantle length), ai and bj are discrete or class variables (i.e. ager and sex respectively), and (abij) is an optional interaction term.
This analysis was conducted using the general linear models (GLM) procedure of SAS (SAS Institute Inc., North Carolina). The analysis initially tests for the most appropriate model, i.e. common slope (b) or multiple slope (abij or b ). It theni
progressively eliminates non-significant (P.0.05) terms from the model until a final model which includes only significant main effects and interactions is accepted.
These same increment count and mantle length data were also viewed by regressing mantle length on number of increments, by ager and sex. As noted above, number of increments is not an appropriate independent variable but it is of interest to view the relationships in this conventional form, without statistical comparison, because the regression slopes serve as a basis for comparing estimated growth rates, not only between the statolith-based methodologies used in this study but with other published estimates derived from this approach. This also facilitates comparison with independent gladius-based individual growth rates. The data were also further partitioned among estimated months of hatching and modelled separately for each of the three most common hatching months for comparative purposes.
3. Results and discussion
3.1. Comparison of independent age estimates
The nature of the difference between agers is shown by age difference and age bias plots (Fig. 1). Each of those plots clearly reveals a systematic bias between Ager B and Ager G. Ager G detected more increments in younger squid and fewer increments in older squid than did Ager B. One implication is that Ager G detected more increments in the inner portion of the ground statolith surface and fewer in the outer portion, relative to Ager B. Detection of more fine inner increments by Ager G than by Ager B would be consistent with the higher magnification used by Ager G with image analysis (400X) than by Ager B with the camera lucida (200X). Consistent age underestimation in larval fishes and discrepancies among investigators have been attributed to the presence of unresolvable increments around the nucleus, which become increasingly compressed with decreases in growth or development rate (Campana and Moksness, 1991).
3.2. Investigation of sources of bias in age estimation
´
166 A.F. Gonzalez et al. / J. Exp. Mar. Biol. Ecol. 244 (2000) 161 –180
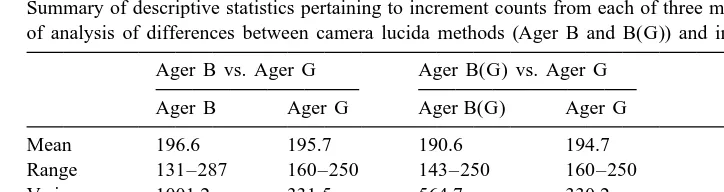
Table 1
Summary of descriptive statistics pertaining to increment counts from each of three methods as well as results of analysis of differences between camera lucida methods (Ager B and B(G)) and image analysis (Ager G)
Ager B vs. Ager G Ager B(G) vs. Ager G
preparations (t50.34, P.0.05, Table 1). However, both the mean number of increments and variance from the camera lucida method were lower when statoliths ground on two sides (Ager B(G)) were examined than when those ground on only one side (Ager B) were examined (Table 1). The mean count for statoliths ground on two sides was significantly lower from the camera lucida method (Ager B(G)) than from image analysis (Ager G) (t5 22.06, P,0.05, Table 1). The difference in the camera lucida counts between the two sets of statoliths was likely related to differences in unclear areas of the ground surface where it was necessary to estimate number of increments. With both preparations it was frequently necessary to extrapolate increment numbers near the outer edge. However, for the 2-sided preparations, it was also usually necessary to estimate unclear innermost increments, i.e. immediately adjacent to the nucleus, using the camera lucida method. This interpolation, based on the innermost clear increments may have resulted in an underestimate because increment widths decrease toward the nucleus. With the 2-sided sagittal plane preparations it was also occasionally necessary to estimate those increments obscured by ‘occulting crystals’ (Dawe et al., 1985; Dawe and Beck, 1997), within an area about 30–70 increments from the nucleus. However estimation in this area was unlikely to result in systematic underestimation.
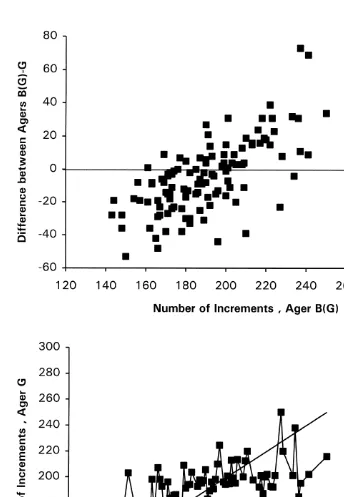
The nature of the bias between Ager G and Ager B(G) (Fig. 2) was similar to that between Ager G and Ager B (Fig. 1). This indicates that although estimated age is affected by method of preparation, systematic bias between agers was primarily due to methods used to interpret and enumerate increments.
3.3. Effects on population structure
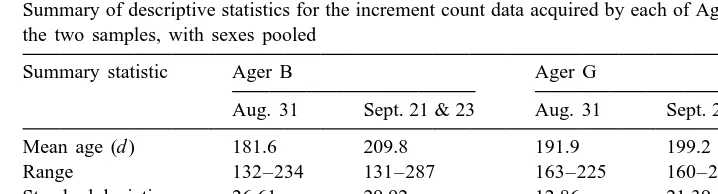
The distribution of increment numbers differed between agers primarily in the degree of variability. Counts by Ager B ranged more broadly than those derived by Ager G (Table 2, Fig. 3). The increase in mean estimated age between sampling occasions which were 21–23 days apart was approximately 28 days for Ager B and 7 days for Ager G. This small increase for Ager G implies recruitment of recently-hatched squid or emigration of early-hatched squid (or both) between sampling occasions, as also noted in a previous study which was based on Ager B’s method and much more extensive seasonal sampling than in the present study (Dawe and Beck, 1997).
´
168 A.F. Gonzalez et al. / J. Exp. Mar. Biol. Ecol. 244 (2000) 161 –180
Table 2
Summary of descriptive statistics for the increment count data acquired by each of Agers B and G, for each of the two samples, with sexes pooled
Summary statistic Ager B Ager G
Aug. 31 Sept. 21 & 23 Aug. 31 Sept. 21 & 23
Mean age (d ) 181.6 209.8 191.9 199.2
Range 132–234 131–287 163–225 160–250
Standard deviation 26.61 29.92 12.86 21.39
Median 179.5 211 194.5 200
Mode 181 222 198 200
N 60 68 60 68
group specimens into months of hatching. The distribution of specimens over hatching month indicated that hatching would have occurred within Dec.–May based on Ager B and within Jan.–Apr. based on Ager G (Fig. 4). The data from both agers indicated that most squid hatched during Feb.–Mar. However, the hatching month frequency for Ager B was negatively skewed with peak hatching during March whereas that for Ager G was positively skewed with peak hatching during February.
3.4. Effects on estimated size-at-age and growth
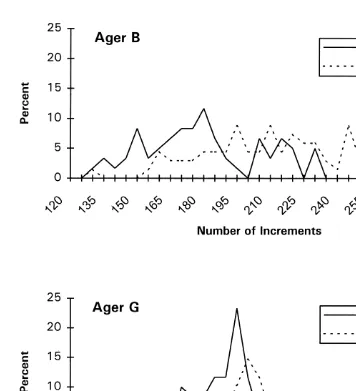
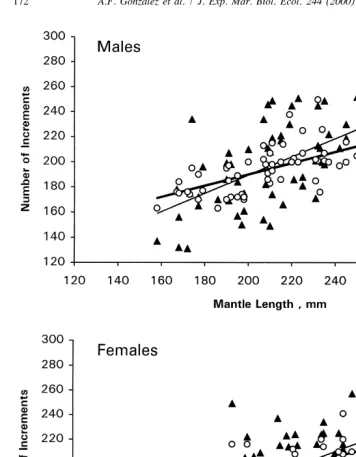
The regressions of number of increments on mantle length by ager and sex (Fig. 5) indicated that variability about the regression lines was greater for Ager B than for Ager
2
G. This was reflected by higher r values (Table 3), indicating better fit of the model for Ager G than for Ager B.
Analysis of the increment number on mantle length relationships (Table 3) showed that regression slopes, which ranged 0.45–0.73, were significantly affected by ager, but not by sex. Hence a multiple slope model was selected as the most appropriate, with slopes of 0.68 for Ager B and 0.44 for Ager G. The higher slope for Ager B than for Ager G reflects higher increment counts in old specimens and lower increment counts in young specimens for Ager B.
´
170 A.F. Gonzalez et al. / J. Exp. Mar. Biol. Ecol. 244 (2000) 161 –180
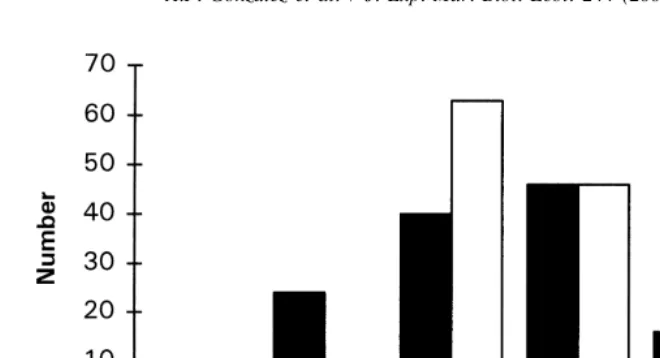
Fig. 3. Distribution of number of increments by sample for each ager; Sept. 21 and 23 are pooled to represent a common sample, for convenience.
season and across the size range. However differences in annual growth rate may also have contributed to these differences.
Fig. 4. Distribution of projected month of hatching for all specimens, by Ager.
effect of time of hatching is particularly important since growth performance has been found to improve considerably with month of hatching, not only for this species (Dawe and Beck, 1997), but for the two other Illex species as well (Rodhouse and Hatfield,
´
1990; Arkhipkin and Laptikhovsky, 1994; Sanchez, 1995).
Sample sizes were generally small, after grouping into hatching month by sex based on increment counts from each ager. For each of the ager-specific data sets by sex, for each of the three most common hatching months, sample size ranged 4–38. The fit of
2
the regression model was also variable (Table 4) and generally better for Ager G (r
2
ranging 0.26–0.68) than for Ager B (r ranging 0.05–0.36). In fact, only for
February-2
hatched males and females did r exceed 0.18 for Ager B (Table 4). Ager G regression slopes increased considerably with hatching month, especially for males, ranging 0.48–1.93 (Table 4, Fig. 7). Unfortunately, it is not possible to detect any such trend in regression slopes for Ager B, because of poor fits of the model (Table 4, Fig. 7).
The difference in slopes between January-hatched and March-hatched males of Ager G implies a four-fold difference in growth rate. An alternate explanation is that such differences among slopes may be due to ageing error. The hatching month assigned to any individual is simply a function of the number of increments counted. If the total number of increments for any squid of a given size is over-estimated, then the individual will be assigned to an early hatching month and it will be of relatively small size-at-age. Conversely, individuals for which ages are underestimated would be assigned to a late hatching month and they would be of relatively large size-at-age.
3.5. Comparison with gladius growth rates
´
172 A.F. Gonzalez et al. / J. Exp. Mar. Biol. Ecol. 244 (2000) 161 –180
Fig. 5. Plots of number of increments on mantle length with regression lines overlain by ager for each sex; dark triangles with fine line represent Ager B, whereas open circles with heavy line represent Ager G.
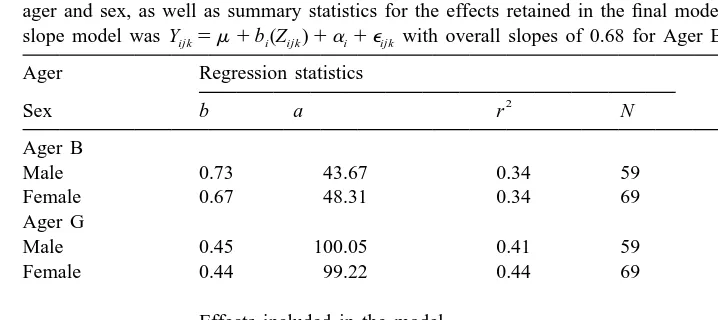
Table 3
Summary of statistical output of the analysis of the age on mantle length data, including regression statistics by ager and sex, as well as summary statistics for the effects retained in the final model. The resultant multiple slope model was Yijk5m 1b (Z )i ijk 1a 1 ei ijk with overall slopes of 0.68 for Ager B and 0.44 for Ager G
Source df Type III SS F Pr.F
Length 1 56998.0 128.46 0.0001
Ager 1 2429.7 5.58 0.0189
Length * Ager 1 2548.9 5.85 0.0162
Individual growth rates were not highly variable, ranging only 0.91–1.12 for the 19 gladii examined (Table 5). Although sample sizes of gladii were small when assigned to groups based on sex and hatching month, according to each ager, it appeared that individual growth rates were not greatly affected by estimated month of hatching. This suggests that the highly variable group growth rates of Ager G represent an artefact of ageing error which would not be reflected in gladius-based individual growth rates because early growth history cannot be reconstructed from the gladii of large squid. It also suggests that it is valid to compare individual gladius growth rates with group growth rates for all data pooled, by sex. In that comparison, Ager G group growth rates (0.91 and 0.99 mm / day) more closely approximate the gladius individual growth rates than do Ager B group growth rates (0.47 and 0.51 mm / day).
However, it is possible that there may be differences in size-at-age due to hatching month effects on early growth, but this remains unknown because gladius analysis cannot be used to independently estimate age. Perez and O’Dor, (1994) showed that ‘exponential’ growth of oceanic juveniles smaller than 30–40 mm GL varies con-siderably among individuals, perhaps due to feeding conditions.
´
174 A.F. Gonzalez et al. / J. Exp. Mar. Biol. Ecol. 244 (2000) 161 –180
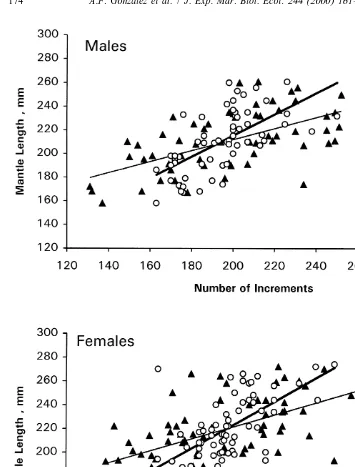
Fig. 6. Plots of mantle length on number of increments with regression lines overlain, by ager for each sex; dark triangles with fine line represent Ager B, whereas open circles with heavy line represent Ager G.
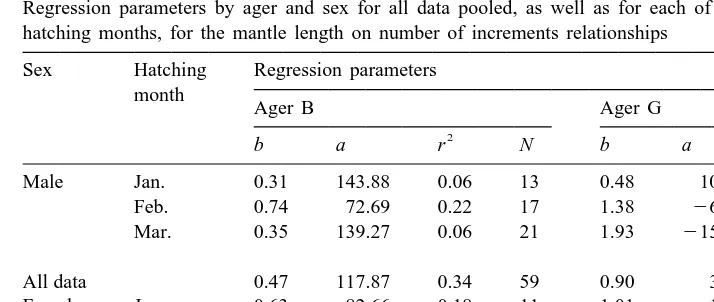
Table 4
Regression parameters by ager and sex for all data pooled, as well as for each of the three most common hatching months, for the mantle length on number of increments relationships
Sex Hatching Regression parameters month
Ager B Ager G
2 2
b a r N b a r N
Male Jan. 0.31 143.88 0.06 13 0.48 109.62 0.67 5
Feb. 0.74 72.69 0.22 17 1.38 262.79 0.46 25
Mar. 0.35 139.27 0.06 21 1.93 2151.99 0.68 24
All data 0.47 117.87 0.34 59 0.90 34.95 0.41 59
Female Jan. 0.63 82.66 0.18 11 1.01 18.20 0.61 4
Feb. 0.93 34.81 0.36 23 0.92 38.90 0.26 38
Mar. 0.41 135.23 0.05 25 1.84 2137.23 0.58 22
All data 0.51 119.72 0.34 69 0.99 25.08 0.44 69
It remains uncertain which of the two ageing methods compared in this study would provide the more reliable age estimates. This uncertainty is related to the lack of known-age specimens, or any other methods to validate increment counts, unknown effects of hatching time on early growth rates, and great variability among results of ageing studies published to date. It does appear, however, that overall growth rate is approximately 1 mm / day.
4. Summary and conclusions
The two independent statolith-based methods generally agreed with respect to such demographic features as age structure, peak hatching period, and migration. However, systematic bias between methods had a great effect on estimated growth rates. Crossing of methods indicated that age estimates were affected by method of statolith preparation, but bias was mostly attributable to differences between agers in method of interpreting and enumerating increments. Comparison of ager-specific growth rates with individual gladius growth rates was inconclusive in indicating which method was the more accurate because it was unclear whether apparent effects of time of hatching on statolith-based growth rates represented an artefact of ageing error. Overall, the consistent individual gladius growth rates (0.91–1.12 mm / day) agreed best with the overall growth rates of Ager G.
The considerable differences we found between methods are not surprising. Only one other study has compared statolith-based ageing methods by partitioning statolith pairs between two methods. Lipinski and Durholtz (1994) found significant differences in increment counts for Loligo vulgaris reynaudii between a light microscopy method and a scanning electron microscopy method, based on 37 pairs of statoliths partitioned
´
´
176
A
.F
.
Gonzalez
et
al
.
/
J.
Exp
.
Mar
.
Biol
.
Ecol
.
244
(2000
)
161
–
180
Table 5
Comparison of gladius-based individual growth rates for selected specimens by hatching month as estimated by each of Ager B and Ager G. Note that any individual gladius may be assigned to different hatching months by Agers B and G
Sex Hatching month Gladius growth rate (specimen)
Ager B Ager G
Female January 1.12 (246) 0.96 (245)
1.01(239)
preparations by a single ager. Application of those methods to known-age Sepioteuthis
lessoniana showed that semiautomatic counting, as used by Ager G in our study, was the
more accurate.
The much more extensive investigations to date on accuracy of ageing larval fish, based on daily growth increments in otoliths, indicate that underestimation of true age is common to most investigators (Geffen, 1982; Lough et al., 1982; Campana and Moksness, 1991; Campana et al., 1987). Campana and Moksness (1991) found that accuracy varied considerably among investigators who aged larval herring which were younger than about 65 days of age. They found that accuracy was affected by equipment used but there were no apparent differences between video systems and direct microscopy.
´
178 A.F. Gonzalez et al. / J. Exp. Mar. Biol. Ecol. 244 (2000) 161 –180
feature division of unprocessed statolith pairs between different methods, exchange of ground statolith mounts among agers, and blind repeat counting to assess precision. Comparison with gladius growth rates may also be insightful. This approach could result in recommendations regarding most suitable methods for mounting, grinding and analyzing statoliths of a given species toward maximizing precision and achieving consistency among investigators.
Acknowledgements
We thank J. Drew for processing squid samples and D. Stansbury for advice and assistance with statistical analysis. Comments provided by P. Pepin and K.S. Naidu, on an earlier version of this manuscript, were quite helpful. We also thank William K. Macy (G.S.O., Rhode Island, USA) for use of image analysis facilities. [AU]
References
Arkhipkin, A.I., 1993. Age, growth, stock-structure and migratory rate of pre-spawning short-finned squid Illex
argentinus based on statolith ageing investigations. Fish. Res. 16, 313–338.
Arkhipkin, A.I., Laptikhovsky, V., 1994. Seasonal and interannual variability in growth and maturation of winter-spawning Illex argentinus (Cephalopoda: Ommastrephidae) in the South Atlantic. Aquat. Living Resou. 7, 221–232.
Balch, N., Sirois, A.S., Hurley, G.V., 1988. Growth increments in statoliths from paralarvae of the ommastrephid squid Illex (Cephalopoda: Theuthoidea). Malacologia Vol. 29, 103–112.
Bizikov, V.A., 1991. A new method of squid age determination using the gladius. In: Jereb, P., Ragonese, S., von Boletesky, S. (Eds.), Squid Age Determination Using Statoliths: Proceedings of the International Workshop, Mazara del Vallo, Italy, 9–14 October 1989. N.T.R.-I.T.P.P. Special Publication No. 1, Istituto di Tecnologia della Pesca e del Pescato, Mazara del Vallo, Italy, pp. 39–51.
Campana, S.E., Annand, M.C., McMillan, J.I., 1995. Graphical and statistical methods for determining the consistency of age determination. Trans. Amer. Fish. Soc. 124, 131–138.
Campana, S.E., Gagne, J.A., Munro, J., 1987. Otolith microstructure of larval herring (Clupea harengus): image or reality? Can. J. Fish. Aquat. Sci. 44, 1922–1929.
Campana, S.E., Moksness, E., 1991. Accuracy and precision of age and hatch date estimates from otolith microstructure examination. ICES. J. Mar. Sci. 48, 303–316.
Dawe, E.G., Beck, P.C., 1997. Population structure, growth, and sexual maturation of short-finned squid(Illex
illecebrosus) at Newfoundland. Can. J. Fish. Aquat. Sci. 54, 137–146.
Dawe, E.G., O’Dor, R.K., Odense, P.H., Hurley, G.V., 1985. Validation and application of an ageing technique for short-finned squid (Illex illecebrosus). J. Northw. Atl. Fish. Sci. 6, 107–116.
Forsythe, J.W., 1993. A working hypothesis on how seasonal temperature change may impact the field growth of young cephalopods. In: Okutani, T., O’Dor, R.K., Kubodera, T. (Eds.), Recent Advances in Cephalopod Fisheries Biology: Contributed Papers to 1991 CIAC International Symposium and Proceedings of the Workshop on Age, Growth and Population Structure, Tokai University Press, Tokyo, Japan, pp. 591–606. Forsythe, J.W., Hanlon, R.T., 1988. Effect of temperature on laboratory growth, reproduction and life span of
Octopus bimaculoides. Marine Biology 98, 369–379.
Forsythe, J.W., Van Heukelem, W.F., 1987. Growth. In: Boyle, P.R. (Ed.), Comparative reviews, Cephalopod life cycles, Vol. II, Academic Press, London, pp. 135–156.
Geffen, A.J., 1982. Otolith ring deposition in relation to growth rate in herring (Clupea harengus) and turbot (Scophthalmus maximus) larvae. Mar. Biol. 71, 317–326.
´
Gonzalez, A.F., Castro, B.G., Guerra, A., 1996. Age and growth of the short-finned squid Illex coindetii in Galician waters (NW Spain) based on statolith analysis. ICES J. Mar. Sci. 53, 802–810.
´
Gonzalez, A.F., Macy, W.K., Guerra, A., 1998. Comparison of methods for squid age determination based on statolith growth increment analysis. ICES J. Mar. Sci. 55, 535–554.
Hurley, G.V., Beck, P.C., 1979. The observation of growth rings in statoliths from the ommastrephid squid,
Illex illecebrosus. Bull. Am. Malacol. Union Inc, 23–29.
Hurley, G.V., Odense, P.H., O’Dor, R.K., Dawe, E.G., 1985. Strontium labelling for verifying daily growth increments in the statoliths of the short-finned squid (Illex illecebrosus). Can. J. Fish. Aquat. Sci. 42, 380–383.
Jackson, G.D., 1994. Application and future potential of statolith increment analysis in squids and sepioids. Can. J. Fish. Aquat. Sci. 51, 2612–2625.
Jackson, G.D., Arkhipkin, A.I., Bizikov, V.A., Hanlon, R.T., 1993. Laboratory and field corroboration of age and growth from statolith and gladii of the loliginid squid Sepioteuthis lessoniana. In: Okutani, T., O’Dor, R.K., Kubodera, T. (Eds.), Recent Advances in Cephalopod Fisheries Biology: Contributed Papers to 1991 CIAC International Symposium and Proceedings of the Workshop on Age, Growth and Population Structure, Tokai University Press, Tokyo, Japan, pp. 591–606.
Jackson, G.D., Choat, J.H., 1992. Growth in tropical cephalopods: an analysis based on statolith micro-structure. Can. J. Fish. Aquat. Sci. 49, 218–228.
Lipinski, M.R., 1978. The age of the squid Illex illecebrosus (LeSueur, 1821) from their statoliths, ICNAF, Res. Doc. 78 / II / 15.
Lipinski, M.R., Durholtz, M.D., 1994. Problems associated with ageing squid from their statoliths: towards a more structured approach. Antarct. Sci. 612 (2), 215–222.
Lough, R.G., Pennington, M., Boltz, G.R., Rosenberg, A.A., 1982. Age and growth of larval Atlantic herring,
Clupea harengus, in the Gulf of Maine-Georges Bank region based on otolith growth increments. Fish.
Bull. 80, 187–200.
Macy, W.K., 1995. The application of digital image processing to the ageing of long-finned squid Loligo
pealei, using the statolith. In: Secor, D.H., Dean, J.M., Campana, S.E. (Eds.), Recent Developments in Fish Otolith Research. Belle W. Baruch Library in Marine Science, Vol. No. 19, University of South Carolina Press, Columbia, pp. 283–302.
Morris, C.C., Aldrich, F.A., 1985. Statolith length and increment number for age determination in squid, Illex
illecebrosus (LeSueur, 1821) (Cephalopoda: Ommastrephidae). NAFO Sci. Coun. Studies 9, 101–106.
O’Dor, R.K., Wells, M.J., 1987. Energy and nutrient flow. In: Boyle, P.R. (Ed.), Cepahlopod life cycles, Vol. II, Academic Press, London, pp. 109–134.
Perez, J.A.A., 1994. The early life history of the short-finned squid, Illex illecebrosus (Cephalopoda: Ommastrephidae), as reconstructed from the gladius structure, Ph.D. thesis, Dalhousie University, Halifax, N.S.
Perez, J.A.A., O’Dor, R.K., 1994. Critical transitions in gladius reconstructed early growth histories of the short-finned squid, Illex illecebrosus. ICES C.M.1994 / K:36, International Council for the Exploration of the Sea, Copenhagen, Denmark.
Perez, J.A.A., O’Dor, R.K., Beck, P., Dawe, E.G., 1996. Evaluation of gladius dorsal surface structure for age and growth studies of the short-finned squid, Illex illecebrosus (Teuthoidea: Ommastrephidae). Can. J. Fish. Aquat. Sci. 53, 2837–2846.
Radtke, R.L., 1983. Chemical and structural characteristics of statoliths from the short-finned squid, Illex
illecebrosus. Mar. Biol. 76, 47–54.
Rodhouse, P.G., Hatfield, E.M.C., 1990. Dynamics of growth and maturation in the cephalopod Illex
argentinus de Castellanos, 1960 (Teuthoidea: Ommastrephidae). Phil. Trans. R. Soc. Lond. B 329,
229–241. ´
´
180 A.F. Gonzalez et al. / J. Exp. Mar. Biol. Ecol. 244 (2000) 161 –180
Stevenson, D.K., Campana, S.E., 1992. Otolith microstructure examination and analysis. Can. Spec. Publ. Fish. Aquat. Sci. 117, 1–126.