On: 29 Sept em ber 2013, At : 20: 11 Publisher: Rout ledge
I nform a Lt d Regist ered in England and Wales Regist ered Num ber: 1072954 Regist ered office: Mort im er House, 37- 41 Mort im er St reet , London W1T 3JH, UK
Accounting and Business Research
Publicat ion det ails, including inst ruct ions f or aut hors and subscript ion inf ormat ion: ht t p: / / www. t andf online. com/ loi/ rabr20
Selection bias and the Big Four premium: New
evidence using Heckman and matching models
Mark A. Clat wort hy a , Gerald H. Makepeace b & Michael J. Peel ba
Cardif f Business School, Cardif f Universit y, Aberconway Building, Colum Drive, Cardif f , CF10 3EU, UK Phone: +44(0)2920 874000 E-mail:
b
Cardif f Business School Published online: 04 Jan 2011.
To cite this article: Mark A. Clat wort hy , Gerald H. Makepeace & Michael J. Peel (2009) Select ion bias and t he Big Four
premium: New evidence using Heckman and mat ching models, Account ing and Business Research, 39: 2, 139-166, DOI: 10. 1080/ 00014788. 2009. 9663354
To link to this article: ht t p: / / dx. doi. org/ 10. 1080/ 00014788. 2009. 9663354
PLEASE SCROLL DOWN FOR ARTI CLE
Taylor & Francis m akes every effort t o ensure t he accuracy of all t he inform at ion ( t he “ Cont ent ” ) cont ained in t he publicat ions on our plat form . How ever, Taylor & Francis, our agent s, and our licensors m ake no
represent at ions or warrant ies w hat soever as t o t he accuracy, com plet eness, or suit abilit y for any purpose of t he Cont ent . Any opinions and view s expressed in t his publicat ion are t he opinions and view s of t he aut hors, and are not t he view s of or endorsed by Taylor & Francis. The accuracy of t he Cont ent should not be relied upon and should be independent ly verified w it h prim ary sources of inform at ion. Taylor and Francis shall not be liable for any losses, act ions, claim s, proceedings, dem ands, cost s, expenses, dam ages, and ot her liabilit ies w hat soever or how soever caused arising direct ly or indirect ly in connect ion w it h, in relat ion t o or arising out of t he use of t he Cont ent .
This art icle m ay be used for research, t eaching, and privat e st udy purposes. Any subst ant ial or syst em at ic reproduct ion, redist ribut ion, reselling, loan, sub- licensing, syst em at ic supply, or dist ribut ion in any
1. Introduction and background
In recent years, the competitiveness of the market for audit services has been the subject of consider-able attention from the accounting profession, reg-ulators and academic researchers. Among the main issues of concern is whether Big Four auditors command a premium when setting fees for statuto-ry corporate audit services and, if so, whether the premium is symptomatic of a lack of competition in the audit market, or results from a higher quali-ty product in competitive markets. In the UK, the (then) Department for Trade and Industry and the Financial Reporting Council (Oxera, 2006) esti-mated the Big Four premium at 18%; they con-cluded that it results from higher concentration and while auditor reputation is important to compa-nies, some large UK firms have no effective choice of auditor due to significant barriers to entry. Furthermore, since the seminal contribution of Simunic (1980), a large number of studies, from a
variety of markets and countries, find a premium using ordinary least squares (OLS) regression for large (Big Eight, Big Six and Big Four) auditors, for companies of various sizes (e.g. Pong and Whittington, 1994; Seetharaman et al., 2002; McMeeking et al., 2007; Clatworthy and Peel, 2007). A survey of the international empirical evi-dence (Moizer, 1997: 61) reports that ‘the results point to a top tier fee premium of between 16 to 37%’; meanwhile, in a meta-analysis of 147 pub-lished audit fee studies, Hay et al. (2006: 176) find that ‘the results on audit quality strongly support the observation that the Big 8/6/5/4 is associated with higher fees.’
Notwithstanding these findings, recent research has turned its attention to the important issue of the non-random selection of auditors and its impact on observed large auditor premiums. Some studies re-port that the premium paid to large auditors is larg-er than implied by OLS estimates when the Heckman model is employed to control for selec-tion bias. In a study of UK listed companies, Ireland and Lennox (2002: 89) conclude that ‘the large audit fee premium is more than twice as large when one controls for selection bias (53.4% com-pared to 19.2%)’. Moreover, based on a sample of UK companies over the period 1985 to 2002, McMeeking et al. (2006) find that the large auditor premium increases when selection bias is con-trolled for. Not all research using the correction for selection bias has produced the same results, how-ever. In a recent examination of the pricing of audit services in UK local authorities, Giroux and
Selection bias and the Big Four premium:
new evidence using Heckman and matching
models
Mark A. Clatworthy, Gerald H. Makepeace and Michael J. Peel*
Abstract—Many prior studies have found that large auditors charge significantly higher fees for statutory audit services, potentially resulting from higher audit quality and/or a lack of competition in the audit market. However, recent research using a Heckman two-step procedure attributes the large auditor premium to auditor selection bias. In this paper we examine the limitations of the Heckman model and estimate the large auditor (Big Four) premium using decomposition and matching methods on a large sample of UK private companies. Our analysis suggests that Heckman two-step estimates are highly sensitive to changes in sample and model specification, particularly the presence of a valid identifying variable. In contrast, the propensity score and portfolio matching methods we em-ploy point to a persistent large auditor premium, consistent with the majority of previous studies. Conclusions of the premium vanishing when selection bias is controlled for therefore appear premature. Since the Heckman model is increasingly used in auditing and other areas of accounting research, our discussion and findings are likely to be of more general interest.
Keywords: audit fees; Big Four premium; matching estimators; propensity score matching; selection bias; two-step models
*Mark Clatworthy, Gerald Makepeace and Michael Peel are at Cardiff Business School. They are grateful for helpful com-ments provided by two anonymous reviewers, Roy Chandler, Mahmoud Ezzamel and Wally Smieliauskas and by seminar participants at Cardiff University, City University, the University of Edinburgh, the University of Exeter, the University of Nottingham, the University of Strathclyde, the 2007 ESRC Seminar in Accounting, Finance and Economics in London and the 2007 EAA Annual Congress in Lisbon. All remaining errors are the authors’ own.
Correspondence should be addressed to: Mark Clatworthy, Cardiff Business School, Cardiff University, Aberconway Building, Colum Drive, Cardiff, CF10 3EU, UK. Tel.: +44(0)2920 874000. E-mail: [email protected].
This paper was accepted for publication in December 2008.
Jones (2007) report that the selection bias correc-tion makes little difference to inferences from OLS regressions. Furthermore, in a study of UK private companies, Chaney et al. (2004) fail to find a large auditor premium after they control for potential self-selection. Using OLS regression, they find a significant positive coefficient on a large auditor (Big Five) binary variable, but no premium when a two-step Heckman procedure to control for po-tential self-selection of auditors is used. Indeed, they conclude (2004: 67) that ‘if big 5 auditees had chosen non-big 5 auditors, their audit fees would have been higher.’ Similar findings were reported by the same authors for a sample of US listed firms (Chaney et al., 2005). These findings represent a very important development in the literature since they imply that many previous studies may have erroneously reported large auditor premiums – de-spite recent evidence (e.g. Blokdijk et al., 2006) that the Big Four provide higher quality audits.
The purpose of this paper is to present new evi-dence on the Big Four auditor premium and the ef-fects of auditor selection for a large sample (36,674) of independent private UK firms by em-ploying two-stage estimators and new decomposi-tion and matching methods. Although the Heckman estimator represents an innovative correction for selection bias, it requires a valid additional identi-fying variable (instrument) for reliable implemen-tation of the method; however, such variables are often extremely difficult to obtain in practice.1
Since previous studies using the Heckman estima-tor do not focus on this important issue, this paper reports the sensitivity of estimates to the inclu-sion/exclusion of such an instrument. Furthermore, the Heckman estimator has been employed uncriti-cally in the accounting literature to date, but analy-ses in other social science research suggest that it is highly sensitive to model specification, in contrast to OLS single-stage estimates (e.g. Hartman, 1991; Stolzenberg and Relles, 1997). This is particularly important because the Heckman model is increas-ingly used as a ‘robustness test’ for selection bias in accounting research in general and in the auditing literature in particular. If the model is not properly identified, this may lead to Heckman results lack-ing robustness due to severe collinearity problems (Little and Rubin, 1987; Puhani, 2000). Our analy-sis therefore focuses on these issues by illustrating the effects and sensitivity of the Heckman model to specification and sample variations and to the valid identification of the two-stage equations. An inde-pendent contemporaneous working paper by Francis and Lennox (2008) also examines the sen-sitivity of the Heckman model in estimating the large auditor premium for UK private firms. Although there is naturally some overlap between the two studies (and their results are of relevance to the current paper, so are discussed where
appropri-ate), there are some important differences. In con-trast to the present paper, the major aim of Francis and Lennox (2008) is to replicate the findings of Chaney et al. (2004) for a more recent time period, using the same models and sampling design as Chaney et al. (2004). The present paper does not aim to reproduce the results of Chaney et al. (2004), since it is based on a much larger cross sec-tional (rather than panel-based) sample of UK pri-vate firms and our models include additional important variables in order to obtain a more reli-able and representative estimate of the Big Four premium. Importantly, our analysis also involves decomposition and matching methods not em-ployed by Francis and Lennox (2008).
A further objective of the paper is to examine the significant methodological issue of how to estimate causal treatment effects in accounting and auditing research (the appointment of a Big Four auditor in our case) using OLS, selection and matching mod-els. We conduct a comprehensive analysis of fee differences between Big Four and non-Big Four auditees using maximum likelihood (ML) and for-mal decomposition measures for selection effects not previously employed in the accounting and au-diting literature. An increasingly popular approach adopted in the applied econometrics and finance literature involves matching procedures, particular-ly propensity score matching methods (e.g. Black and Smith, 2004; Simonsen and Skipper, 2006; Li and Prabhala, 2007), although these have yet to be employed in auditing research. Using these meth-ods, we present new evidence on the large auditor premium using closely matched samples (in respect of size, risk and complexity) of companies audited by Big Four and non-Big Four auditors. In summa-ry, our paper extends extant research by identifying potential weaknesses of the Heckman model and presenting alternative procedures to estimate the Big Four premium.
Our work contributes to the empirical literature on selection bias and the Big Four premium by using the largest sample of UK firms yet studied. The richness of our data set and large sample size allow us to subject this important issue to consid-erable scrutiny.2Our results suggest that two-step
1For instance, Neumayer (2003: 655) notes ‘The problem is that such an exclusionary variable is frequently impossible to find’; moreover, Bryson et al. (2002: 9) state that ‘the identifi-cation of a suitable instrument is often a significant practical obstacle to successful implementation.’
2At 36,674 observations, our sample is substantially larger than the largest (6,198 observations) in the meta-analysis of over 140 audit fee studies by Hay et al. (2006). Moreover, our dataset includes a more comprehensive set of variables than prior studies of selection bias and private UK company audit fees. In particular, the model reported by Chaney et al. (2004) excludes the number of subsidiaries and a second corporate size variable (sales), both of which have been found important in previous research.
corrections for selection bias in audit fee models are very sensitive to model specification (includ-ing the absence of an identify(includ-ing variable), and to the sample used – findings consistent with empiri-cal results in applications of two-step models in other fields (e.g. Winship and Mare, 1992; Stolzenberg and Relles, 1997; Leung and Yu, 2000). Using more consistent propensity score and pre-processed portfolio matching approaches, we conclude that the Big Four premium is still present after controlling for observable audit client charac-teristics and that models attributing the premium to unobservable characteristics should be treated with a high degree of caution. The Heckman pro-cedure is becoming more widely used in account-ing research such as studies of accruals quality (Doyle et al., 2007) and effects of disclosure on stock returns (Tucker, 2007). Accordingly, our re-sults and methods are also likely to be of more general interest to accounting and business re-searchers. The remainder of the paper is organised as follows. In the next section, we outline general modelling issues and assumptions; Section 3 de-scribes our variables and data, while our empirical results based on single stage, two-step and match-ing estimators follow in Section 4. The paper con-cludes in Section 5 with a summary, implications and suggestions for future research.
2. Modelling issues and the Big Four
premium
2.1. Evidence on the premium in prior literature
To date, the auditing literature has advanced sev-eral non-independent reasons for large auditors charging higher fees, including the Big Four (for-merly Big Eight, Big Six and Big 5) being associ-ated with established reputations, higher quality audits, higher training costs, higher potential loss-es in the event of shareholder litigation (‘deep pockets’) and the occupation of a position of oli-gopoly in many audit markets (Moizer, 1997). Craswell et al. (1995) note that in competitive markets, the large auditor premium represents a re-turn to Big Four investments in brand name repu-tation for higher quality audits. In the market for the largest multinational companies, however, smaller auditors, due to their lack of technical re-sources and geographical coverage, are unable to compete; hence such auditees are limited in choice to Big Four auditors only. For example, the Oxera report (2006: i) concludes there are significant bar-riers to entry in the sub-market for large UK quot-ed companies, ‘including the high cost of entry, a long payback period for any potential investment, and significant business risks when competing against the incumbents (Big Four) in the market’.
Testing whether or not the auditee market is competitive (i.e. amongst the Big Four) for the
largest companies, or subject to cartel pricing be-haviour, is clearly difficult, since no realistic coun-terfactuals exist – with, for example, Big Four auditors accounting for 97.4% of the audits of the FTSE 350 in 2005 (Oxera, 2006). In the current paper we study UK private companies, where the market is a priori competitive in that Big Four concentration is relatively low (8.3% of audits in our sample) and where both Big Four and non-Big Four auditors are represented across a wide range of auditee size. In such a market any observed pre-mium is more likely to be related to perceived or actual audit quality differentials than to a lack of competition.3
In our modelling of audit fees, we therefore as-sume a competitive market using the seminal audit fee framework of Simunic (1980) and developed by Pong and Whittington (1994). Simunic (1980) hypothesises that audit fees vary in association with audit production functions, loss exposure and audit quality (modelled with reference to auditee size, complexity, risk and auditor quality). Pong and Whittington (1994) posit that supply is related to auditors’ cost functions and hence largely asso-ciated with the quantity of work/effort. Because of professional and statutory prescriptions for mini-mum audit standards, Pong and Whittington (1994) argue that the demand for audit is relative-ly inelastic. Furthermore, as noted by Simunic (1980: 170), in terms of product differentiation, the audit market is hedonic, i.e. differentiated audit products (quality) are not directly observed and ‘the principal differentiation characteristic of the service is likely to be the identity of the supplier … it is the Big Eight firms which enjoy visibility and brand name recognition among buyers.’
The UK private company audit market is an in-teresting context in which to test for the presence of a large auditor premium. In addition to the more competitive nature of the supply side of the audit market, there are economic arguments both for and against the prediction that a Big Four premium will be observed. As argued by Chaney et al. (2004), lower agency costs for private firms (which are more closely held), potentially less re-liance on financial statements by outsiders and lower litigation risk for auditors (compared to list-ed firms) would point to lower demand for high quality audit services, and hence to no expectation of a premium. By contrast, owners of private firms may seek to signal credibility of their financial
3Several studies indicate that a premium may be warranted as a result of differential audit quality. For example, Blokdijk et al. (2006) find that the quality of audits by the (then) Big Five is higher, even though the total effort exerted is similar to smaller auditors. Francis et al. (1999) report that Big Six audi-tors constrain income-increasing discretionary accruals more than smaller auditors, while Lennox (1999) finds that large au-ditors’ reports are more accurate than those of smaller auditors.
statements should they plan to sell their stake and the absence of market values may make informa-tion provided by the financial reporting process more important (e.g. for managerial performance measures). Collis et al. (2004) find increased de-mand for audit services in general (rather than be-tween types of auditor) from firms wishing to maintain good relationships with lenders; it is pos-sible that such findings may extend to firms wish-ing to appoint higher quality auditors to testify to the truth and fairness of their financial statements. In addition, there is evidence that newly listed firms attract cheaper debt capital if they appoint a large auditor (Pittman and Fortin, 2004), suggest-ing that higher audit fees may eventually be recov-ered through the payment of lower rates of interest.
2.2. Statistical specifications and assumptions
In this section, we describe the models and as-sumptions that provide the basis for our empirical analysis. Although our focus is on the Big Four premium, the discussion is applicable to other areas of accounting and business research where selection bias is a potential problem. At various points, we refer readers to the Appendix for a more formal exposition of the issues in this section.
OLS and Oaxaca-Blinder decomposition
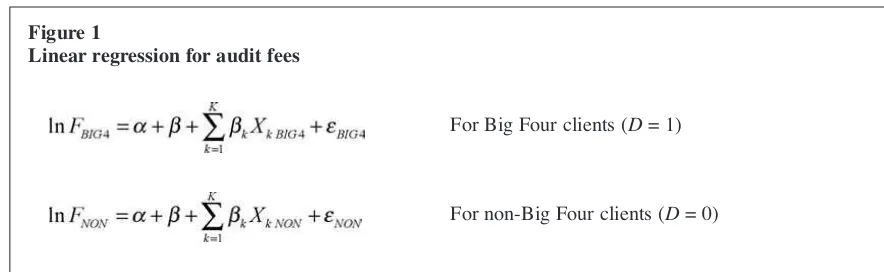
We start by dividing companies into those with a Big Four auditor and those without. This division is indexed below by BIG4and NON and represent-ed by a dummy variable (D) taking the value of one if the auditee appoints a Big Four auditor and zero otherwise. The literature typically assumes audit fees (F), expressed in natural log form (lnF), depend on K variables (Xkk= 1,..,K) – principally
auditee size, complexity and risk measures – em-ploying a linear regression of the form shown in Figure 1, where the error term (ε) reflects unob-servable random determinants of the fees paid to auditors.
Audit fees may vary between these groups be-cause observable characteristics (X) are different and/or because the impact of these characteristics on audit fees (β ≠ 0, αk ≠ βk) is different. For
instance, as Pong and Whittington (1994) and Chaney et al. (2004) note, it is likely that Big Four auditors are better equipped to audit larger, more complex clients, although such comparative ad-vantages may be offset in part by higher fixed costs associated with the training of audit staff.
Initially we assume for our single stage conven-tional estimates that any unobservable auditee characteristics are the same for D = 1 and D= 0, so the errors have the same distribution for each type of auditor. A problem arises since we cannot directly compare the fees paid under each regime because we only observe a company as a client of either a Big Four or a non-Big Four auditor, but not both, i.e. we do not observe the counterfactual outcome.4 This problem can be overcome by
assuming that the values of the regressors are unimportant in respect of computing the counter-factuals; however, if there are large and significant differences in the values of the regressors for Big Four and non-Big Four auditees, then it may be unreasonable to extrapolate between them.5
If the OLS estimates of the parameters in (1) and (2) are (a, ak) for the non-Big Four auditees
and (a, b, bk) for the Big Four auditees, then the predicted log of audit fees for a Big Four auditee, firm i, in each audit regime are:
(the counterfactual value) and
(the actual predicted value). The Big Four premium
Figure 1
Linear regression for audit fees
For Big Four clients (D= 1) (1)
For non-Big Four clients (D= 0) (2)
4Another potential concern is the use of linear functions. It may be possible for the same non-linear audit fee equation to apply to both types of auditee so that any observed Big Four premium might be entirely ‘explained’ by auditees’ different characteristics. A premium can still be predicted if linear ap-proximations are estimated at markedly different points on the curve.
5For example, at the limit, it would appear inappropriate to compare the audit fees paid by large and small auditees if all large auditees employed Big Four auditors while all small au-ditees employed non-Big Four auditors.
冬冬
is then the difference:
(most previous studies test for a premium using a binary variable in a single regression, so the pre-mium is constant at b). In practice we compute these statistics for two ‘typical’ (average) auditees: the first has the values for the regressors equal to the mean values for the Big Four auditees (–––––XkBIG4)
and the other the mean values for the non-Big Four auditees (X–––––kNON).6This gives two estimates (P) of
the Big Four premium, shown in Figure 2.
PBIG4represents the predicted fees paid by a typ-ical Big Four auditee to a Big Four auditor minus the predicted log of fees paid by the same auditee to a non-Big Four auditor; whereas PNON repre-sents the difference between predicted fees for a typical non-Big Four auditee paid to a Big Four auditor and the predicted fees paid to a non-Big Four auditor. Although not typically used in audit-ing research, these statistics are widely used else-where as part of an Oaxaca-Blinder (OB) decomposition analysis (see the Appendix, Oaxaca (1973), Blinder (1973) and Greene (2003: 53) for further details).
Recent developments in the auditing literature, however, point out that conventional OLS esti-mates of the Big Four premium are potentially bi-ased since auditors are not appointed randomly by their clients and because auditor choice may be systematically related to auditees’ unobservable characteristics (e.g. insiders’ knowledge of the riskiness of future cash flows). Ireland and Lennox (2002: 75) note ‘although the standard OLS audit fee models control for observable differences, characteristics that are not observable to the aca-demic researcher may affect both fees and auditor choice and thereby cause bias.’ However, it is not entirely clear from previous research what such unobservable characteristics represent or how im-portant they are in systematically influencing audi-tor selection and audit fees. Titman and Trueman (1986) and Datar et al. (1991) each develop mod-els predicting that auditor quality is a function of firm-specific risk, of which firm insiders are better
informed than outsiders. But both models make competing predictions about the nature of the rela-tionship between firm-specific risk and auditor quality: Datar et al. (1991) predict that entrepre-neurs of risky firms choose higher quality auditors, whereas Titman and Trueman (1986) predict the opposite.
Selection models
Selection bias arises if the unobservable charac-teristics of Big Four and non-Big Four auditees are systematically different from each other. Suppose that εNONand εBIG4in equations (1) and (2) above
are drawn from the same distribution but that Big Four auditees and non-Big Four auditees only have positive and negative errors respectively.7
Estimating fee equations with standard single-stage OLS omits the conditional means (by assuming E(εBIG4) = E(εNON) = 0) and leads to inconsistent
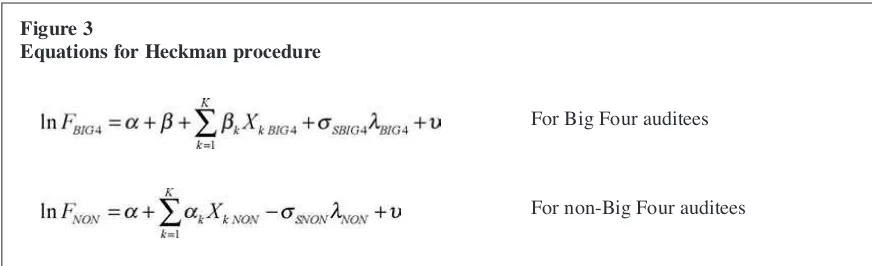
estimates if these terms are correlated with the re-gressors. The Heckman two-step procedure pro-vides an estimate of the mean of the conditional error known as the Inverse Mills Ratio (IMR) or the selection term λ, which augments the regres-sors in equations (1) and (2) above. The procedure involves estimating a probit model of auditor choice as the first stage; this model yields esti-mates of selection terms λBIG4and λNONwhich are
then included in the audit fee equations in the sec-ond stage. OLS applied to the augmented equa-tions yields consistent coefficient estimates and standard hypothesis tests can be applied with modified formulae for the standard errors. The Heckman procedure thus estimates the equations shown in Figure 3.
The Appendix provides a more formal descrip-tion of the model and the derivadescrip-tion of the selec-tion terms. The probit and audit fee equaselec-tions in
Figure 2
Estimates of the Big Four premium
(3)
(4)
6This choice ensures that the errors play no role as the means of the predicted errors are zero and would seem reason-able on the basis that the mean represents the expected value of the characteristics of a Big Four auditee.
7For example, if the positive error measures the unobserved value to the auditee of appointing a Big Four auditor, then Big Four auditees will value Big Four auditors more than non-Big Four auditors and therefore pay higher fees.
冬
冬
the Heckman model can also be estimated simulta-neously by maximum likelihood (ML), which leads to more efficient estimates if the model is correctly specified. Accordingly, we report both conventional Heckman two-step and ML estimates in our empirical analysis.
Although the Heckman procedure has become increasingly popular in accounting research and in the finance literature (e.g. Li and Prabhala, 2007), its robustness has been questioned under certain conditions. For example, Giles (2003: 1299) notes ‘Heckman’s sample selectivity correction method-ology offers a way of improving on the estimates obtained with non-random samples. While there is improvement in general in this regard, there are situations in which the correction for sample selec-tivity actually aggravates the problem.’
It is commonplace to assume joint normality of the distribution of the errors in the selection and outcome equations and that any systematic unob-servable variables are normally distributed (an untestable assumption). Joint normality has the surprising and unfortunate implication that collinearity between the selection term and the other regressors in the second stage equation is often severe, leading to serious model instability (e.g. Leung and Yu, 2000). In addition, it is com-mon for researchers to identify the second stage equation via the non-linearity of the selection term only. However, recent econometric analyses of this issue suggest that to adequately identify the model it should contain a valid instrument, i.e. a regres-sor which determines the choice of auditor but has no significant effect on determining audit fees (Little, 1985; and Puhani, 2000). But collinearity may cause problems even when an instrument (also known as an exclusion or identifying vari-able) is employed, leading to unstable estimates of treatment effects (Stolzenberg and Relles, 1997; Leung and Yu, 2000; Li and Prabhala, 2007). Against this background, it is perhaps unsurprising
that, as noted above, empirical results in auditing research using the Heckman model have, to date, been mixed.8
In the absence of satisfactory instruments, the selection effect is best identified by extreme obser-vations of the selection term λ, i.e. those compa-nies with an estimated probability of choosing a Big Four auditor close to 1. These Big Four audi-tees (usually because of their large size and com-plexity) effectively have no surrogate non-Big Four counterfactuals – that is, there is no ‘common support’ – the common support region being where Big Four clients have non-Big Four counterparts with similar characteristics. Following Black and Smith (2004), we therefore assess the robustness of the Heckman results by estimating models using samples with different values of the selection term.
Matching estimators
The problems of model sensitivity, lack of ro-bustness, linear functional form assumptions and the need for adequate counterfactuals motivate the use of matching methods. These methods are gain-ing in popularity in the applied econometrics liter-ature (e.g. Bryson et al., 2002; Black and Smith, 2004; Simonsen and Skipper, 2006) and are based on matching the observable characteristics of members in the treatment group (i.e. Big Four au-ditees in our case) to members (counterfactuals) in the untreated group (non-Big Four auditees). Matching analyses are based on two important sumptions: (1) the conditional independence as-sumption (CIA) and (2) common support. The former requires the value of audit fees to be inde-pendent of auditor type given the values of some observable variables, whereas the latter involves comparable observations existing in both groups. Both assumptions are discussed at greater length in the Appendix.
A limitation of matching methods is that they cannot accommodate any systematic effects of un-observable auditee characteristics that have a joint impact upon auditor selection and audit fees (al-though as discussed above, it is not obvious what these systematic effects might be or what their directional influence is). Whereas the Heckman
Figure 3
Equations for Heckman procedure
For Big Four auditees (5)
For non-Big Four auditees (6)
8Though it is, of course, plausible that the variation in these findings is attributable to differences in the underlying eco-nomic situations (e.g. private limited versus public quoted company markets).
approach allows such unobservable factors to in-fluence auditor choice systematically, it is often sensitive to specification and collinearity, as dis-cussed above. Although they cannot deal directly with unobservables, matching estimators do not rely on linear extrapolation (outside the common support region) or functional form assumptions; nor do they require an exclusion variable or im-pose joint normality assumptions. As noted by Simonsen and Skipper (2006), matching methods are based on matching on observable characteris-tics of members in the treatment group (Big Four auditees in our research) to members (counterfac-tuals) in the untreated group (non-Big Four audi-tees) and hence ‘balancing the bias arising from self-selection … Matching allows for heteroge-neous treatment effects, is not subject to paramet-ric assumptions and does not per se assume separability of observables and unobservables’ (ibid.: 920).
When applying matching methods, there are var-ious estimators to choose from, reflecting a trade-off in respect of the number of variables used to match on, the closeness with which the variables are matched (particularly continuous variables), and the sample size. This is referred to as the ‘curse of dimensionality’ (Ho et al., 2007) since close matching on more than a few variables (di-mensions) might result in matched samples that are too small for any meaningful analysis.
The first matching method we use – propensity score matching – has recently been employed in applied econometrics research (e.g. Black and Smith, 2004; Simonsen and Skipper, 2006), but not in the auditing literature to date. The method (see Appendix for more details) is implemented as follows. First the selection equation is estimated using a parametric estimator of the auditor selec-tion equaselec-tion (in our case a probit model) and the probabilities (propensity scores) of choosing a Big Four auditor are obtained for all sample firms. Each Big Four auditee is then matched to a non-Big Four auditee with a similar propensity score and differences in audit fees compared across the two matched samples. As noted by Black and Smith (2004: 110), the logic underpinning this method is that ‘subgroups with values of X [ex-planatory variables] that imply the same probabil-ity of treatment can be combined because they will always appear in the treatment and (matched) comparison groups in the same proportion. As a result, any differences between subgroups with different X but the same propensity score balance out when constructing the estimates.’ Hence, an important practical advantage of propensity score matching is that subgroups are matched on one variable, obviating the need for very large samples when subgroups are to be matched according to several characteristics. Moreover, propensity score
matching does not make the same functional form assumptions as linear regression and non-linear re-lationships (of which there is some evidence in the literature – e.g. Peel and Roberts, 2003; Chaney et al., 2005) can be allowed for.
The second matching approach we take is an in-termediate (semi-parametric) one which combines matching with the standard OLS regression used in the majority of prior studies. This approach in-volves matching observations according to impor-tant actual client characteristics prior to a standard parametric analysis, in line with the methods advo-cated by Ho et al. (2007), who highlight the poten-tially serious pitfalls of drawing inferences from sensitive statistical models. Initially we preprocess our data, then estimate the standard audit-fee model with a binary Big Four indicator variable. Preprocessing involves matching Big Four and non-Big Four auditees only on key attributes (well-tested measures of auditee size, complexity and risk) thereby ensuring a sufficient number of matched observations to conduct standard OLS re-gression techniques to control for any remaining confounding factors. We initially sort our full sam-ple into quantiles based on the key attributes of sales (40 quantiles), the ratio of exports to sales (11 quantiles), return on total assets (40 quantiles) and the number of subsidiaries (10 quantiles). We then match each Big Four client to a non-Big Four client jointly sharing membership of each respec-tive quantile for size, risk and complexity. It is important to note that this is a simultaneous re-quirement, i.e. matched auditees have similar size
and risk and complexity characteristics and is therefore a stricter set of criteria than propensity score matching, since the latter is a composite (al-beit conditional) score.
Since this process results in a large number of potential matched combinations, we perform this procedure 2,000 times. Each time, we estimate an OLS regression and for each iteration, we capture the coefficient for the binary Big Four indicator variable (representing the premium charged to similar Big Four and non-Big Four auditees) and report the results for the distribution of this coeffi-cient. As stated by Ho et al. (2007: 3) this pre-pro-cessing approach combines the merits of both non-parametric matching with conventional para-metric estimators: ‘In a sense our recommenda-tions already constitute best practice since matching alone is not a method of estimation and always requires some technique to compute esti-mates … we simply point out that, except in the extraordinary case where matching is exact, para-metric procedures have the potential to greatly im-prove causal inferences even after matching.’ In summary, while the Heckman model presents a potential solution to the important problem of se-lection bias, it may produce imprecise results.
Matching techniques are becoming increasingly popular, since as noted by Li and Prabhala, (2007: 51), ‘They represent an attractive means of infer-ence because they are simple to implement and yield readily interpretable estimates of ‘‘treatment effects ’’’. However, they are based on different as-sumptions to the Heckman model, principally be-cause they assume that any unobservables are unimportant (Li and Prabhala, 2007). If unobserv-able client characteristics determine both auditor choice and audit fees, matching estimators pro-duce potentially biased results. Since the theoreti-cal research into the determinants of auditor choice is inconclusive and the nature and role of unob-servables are unclear, however, matching methods seem an appropriate means to assess the robust-ness of the Big Four premium in recent auditing research.9The next section outlines the variables
and data used in our empirical analysis.
3. Variables and data
3.1. Variables
Our main empirical model of audit fees takes the standard linear form as in Figure 4.
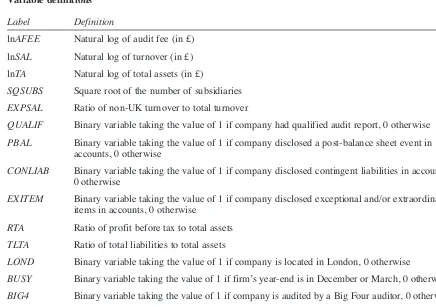
The variables used in the model are described in Table 1 and have been widely employed in prior research (e.g. Simunic, 1980; Pong and
Whittington, 1994; Chan et al., 1993; Ezzamel et al. 1996; Chaney et al., 2004; McMeeking et al., 2006; Clatworthy and Peel, 2007).10
Since corporate size (serving as a proxy for audit effort) has been found to be the key driver of external audit fees in previous research, we em-ploy both total assets (£) and turnover (£) as auditee size measures in our research. Pong and Whittington (1994: 1075) note that audits have two broad dimensions: ‘an audit of transactions and verification of assets. The former will be relat-ed to turnover and the latter to total assets.’
Table 1
Variable definitions
Label Definition
lnAFEE Natural log of audit fee (in £)
lnSAL Natural log of turnover (in £)
lnTA Natural log of total assets (in £)
SQSUBS Square root of the number of subsidiaries
EXPSAL Ratio of non-UK turnover to total turnover
QUALIF Binary variable taking the value of 1 if company had qualified audit report, 0 otherwise
PBAL Binary variable taking the value of 1 if company disclosed a post-balance sheet event in accounts, 0 otherwise
CONLIAB Binary variable taking the value of 1 if company disclosed contingent liabilities in accounts, 0 otherwise
EXITEM Binary variable taking the value of 1 if company disclosed exceptional and/or extraordinary items in accounts, 0 otherwise
RTA Ratio of profit before tax to total assets
TLTA Ratio of total liabilities to total assets
LOND Binary variable taking the value of 1 if company is located in London, 0 otherwise
BUSY Binary variable taking the value of 1 if firm’s year-end is in December or March, 0 otherwise
BIG4 Binary variable taking the value of 1 if company is audited by a Big Four auditor, 0 otherwise
CHTA Absolute value of change in total assets from year t-1 to year t
9Since prior research on this specific issue is relatively rare and has produced inconsistent results, further research into the identification and examination of such unobservable charac-teristics seems warranted.
10Naturally, the binary variable BIG4is omitted where the equations are estimated separately. As noted by an anonymous referee, a potentially important variable not included in our analysis is non-audit (consultancy) fees. This variable has been found to be significantly related to audit fees in a num-ber of studies of listed companies; however, since private companies are not required to disclose their non-audit fees, the data are not available for most private companies (i.e. other than for those that voluntarily disclose them). This is a poten-tial limitation of our research, since the distinction between the two types of fees is not always clear – though previous Heckman (two-step) research into UK private firms also omits non-audit fees, so our results are comparable in this respect.
Following previous studies, we specify the rela-tionship between audit fees (lnAFEE) and the size measures for turnover (lnSAL) and total assets (lnTA) in natural logarithmic form to capture po-tential economies of scale in the audit. In order to control for audit complexity, we include a variable labelled SQSUBS, defined as the square root of the number of subsidiaries (e.g. Francis and Simon, 1987), and EXPSAL – the ratio of non-UK turnover to total turnover (e.g. Beatty, 1993: Chaney et al., 2004), both of which we expect to be positively related to audit fees.
To capture auditee risk characteristics, we em-ploy the gearing ratio of total liabilities to total as-sets (TLTA) and the ratio of net profit before tax to total assets (RTA), which we expect to be positive-ly and negativepositive-ly related to audit fees, respective-ly (e.g. Chan et al., 1993; Firth, 1997). Following previous research (e.g. Chaney et al., 2004; Clatworthy and Peel, 2007) we employ three addi-tional binary variables to capture incremental risk/complexity in the audit. These are whether (coded 1) or not (coded 0) the audit client received a qualified audit report (QUALIF), reported excep-tional and/or extraordinary items (EXITEM), dis-closed a post-balance sheet event (PBAL) or a contingent liability (CONLIAB). All these vari-ables are expected to be positively related to audit fees (ibid.).11Finally, we include binary variables
for whether (coded 1) or not (coded 0) companies are audited by a Big Four auditor (BIG4), whether the audit client’s year-end falls in December or March (BUSY) and whether the company is locat-ed in London (LOND). The latter two variables are expected to be positively related to audit fees since companies audited during the ‘busy’ period may be charged higher fees due to the higher opportu-nity cost of audit resources (e.g. McMeeking et al., 2006) while companies located in London are expected to pay higher audit fees reflecting cost of living differentials (Chaney et al., 2004; Clatworthy and Peel, 2007).
Other than in respect of corporate size and com-plexity, the literature on the choice of variables in the auditor selection model is less developed and prior studies are usually based on including a sub-group of variables from the audit fee equation in the selection model (Chaney et al., 2004, 2005; Hamilton et al., 2005, but cf. Ireland and Lennox, 2002). If one assumes that firms choose auditor
type by comparing their predicted costs (fees), the choice of auditor type depends on all the factors affecting the fees charged by either type of auditor. We therefore included all variables from the fee equations in the auditor choice model. When all or a subset of the regressors from the fees equation is used, identification relies on the non-linearity of the selection term but this non-linearity may not be sufficient to produce convincing estimates. It is important therefore to include an identification variable that is significantly associated with audi-tor choice (in the probit model), but not with audit fees (in the fees equation). Such variables are ex-tremely hard to obtain in practice (see, e.g. Puhani, 2000). We considered several plausible instru-ments12and found only one – the change in the
ab-solute value of total assets (CHTA) between the current and preceding year – which was statistical-ly significant (with the expected sign) in the probit selection model, but statistically insignificant when included in the OLS audit fee models.13
Furthermore it is not formally a ‘weak’ instrument since it has an F-statistic of 11.21 for the null that it is insignificant in the regression of auditor type (D) on all the regressors. This exceeds the critical value of 8.96 for the validity of a single instrument given by Stock et al. (2002) and the informal value of 10 that is widely used and advocated by Stock and Watson (2003: 350).
The motivation for CHTAbeing included in the selection model is that companies involved in large investments/acquisition or divestments/sale of assets, may require the expertise of a Big Four auditor due to the additional complexity of the audit. In addition, Keasey and Watson (1991) note that the absolute change in firm size (total assets) may, from an agency perspective, act as a proxy for contractual changes at the firm level, which
Figure 4
Empirical model of audit fees
lnAFEE = α0+β1lnSAL+β2lnTA+β3SQSUBS+β4EXPSAL+β5QUALIF+β6PBAL+β7CONLIAB (7)
+β8EXITEM+β9RTA+β10TLTA+β11LOND+β12BUSY+β13BIG4+ε
11Because company records on the database we use (FAME) only indicate whether or not either of these events occurred, we are unable to refine PBALor CONLIAB to take account of the types of events or the nature of liabilities. Hence, we assess their average impact. We were also unable to ascertain the na-ture of the qualification and hence through QUALIF, we again measure the average impact of a qualified audit report.
12These included changes in sales, change in equity, change in total assets and various transformations of these variables.
13The t-values for the CHTAcoefficients when included in models 1, 2 and 3 in Table 3 below were, respectively: 0.05, 1.32 and 0.18.
could prompt a change in the demand for auditing services. Hence, large auditors may be associated with reducing agency costs (e.g. Ireland and Lennox, 2002) in companies with large asset variations. Although it has desirable theoretical qualities, it is also employed for pragmatic rea-sons, since it formally fulfils its main purpose of properly identifying the audit fee equations. Our empirical model of auditor selection is shown in Figure 5.
Following previous studies (e.g. Chaney et al., 2004; Hamilton et al., 2005), we expect the vari-ables reflecting auditee size (lnSALand lnTA) and complexity (SQSUBS and EXPSAL) to be positive-ly associated with the choice of a Big Four auditor in the probit model, in consequence of their hy-pothesised capacity to provide more efficient au-dits and to reduce agency costs (ibid.). In line with prior research (e.g. Ireland and Lennox, 2002; Chaney et al., 2004, 2005), we also expect our au-ditee risk variables (QUALIF, PBAL, CONLIAB,
EXITEM, RTAand TLTA) to be positively associat-ed with the selection of a Big Four auditor.14As
noted by Hamilton et al. (2005: 9), ‘The greater the client’s risk, the higher the propensity for the im-pairment of agency relationships. To mitigate the associated agency costs, higher quality auditors, surrogated by big 4, are more likely to be selected to signal the credibility of reporting.’ Furthermore, Datar et al. (1991) predict, and Copley and Douthett (2002) find, a positive relationship be-tween auditee risk and the appointment of a high-er quality auditor.
For the final two variables (LOND and BUSY), we have no strong prior expectations about their influence on auditor choice, although the univari-ate results of extant studies (as in the current study) have consistently reported (for both private and quoted audit clients) that a significantly high-er proportion of Big Four auditors conduct their audits during the busy period, while a significant-ly higher proportion of non-Big Four auditors are appointed to companies located in London (e.g. Ireland and Lennox, 2002; Chaney et al., 2004).
3.2. Data
The source of our data is the Bureau Van Dijk FAME DVD-ROM UK database. Financial data (annual accounts) and non-financial data (e.g. company location, auditor and audit qualification)
are available as individual records for each compa-ny on the database. Companies were included if they met the following criteria: their primary activ-ities (according to FAME primary SIC codes) were outside the financial sector; they were private lim-ited companies; they were ‘live’ companies (i.e. had not ceased trading, failed or entered into vol-untary liquidation); their audited accounts were available on FAME; they had full data available, including total assets and sales (minimum £1,000), audit fee (minimum £100), and a disclosed profit/loss figure. In order to avoid the potential confounding influences of including both holding companies and their subsidiaries in the regression model (e.g. Ezzamel et al., 1996; Peel and Roberts, 2003), our sample only includes independent com-panies (i.e. those not held as a subsidiary of anoth-er company). In line with previous studies (e.g. Firth, 1997), financial companies were excluded due to the different composition of their financial statements and only live companies were selected to avoid the confounding influence of including non-live auditees. In addition, and in line with pre-vious research, 11 companies with joint auditors (none of which were Big Four auditors) were ex-cluded from the analysis to comply with the bina-ry nature of the probit model. Following these restrictions, we obtained the necessary data for a sample of 36,674 private companies from FAME for the latest financial statements available (pre-dominantly for the calendar year 2003).15It is very
important to note (since it has significant effects on both sample size and data accuracy) that the FAME default setting for downloading data is £000s, with data being rounded to the nearest £1,000; for example an audit fee of £1,550 would be rounded to £2,000 and one of £400 to zero (i.e.
Figure 5
Empirical model of auditor selection
BIG4 = δ0+δ1lnSAL+δ2lnTA+δ3SQSUBS+δ4EXPSAL+δ5QUALIF+δ6PBAL+δ7CONLIAB (8)
+δ8EXITEM+δ9RTA+δ10TLTA+δ11LOND+δ12BUSY+δ13CHTA+ε
14As noted by an anonymous reviewer, it is possible that if large auditors do not favour small companies due to lower re-turn relative to the risk involved, small firms will have to pay more to retain a large auditor. This does not, however, pre-clude small companies paying such a premium if they believe the quality of audit to be higher for the reasons discussed above.
15A possible limitation of our work is that we employ a cross-sectional, rather than a panel-based sample. Prior re-search by Chaney et al. (2004) suggests that private company audit fee models do not vary much over time. Their sample covers a five-year period and there is little variation in their annual estimates; however, cf. McMeeking et al. (2006), who do find inter-temporal variation for listed companies.
a missing value). Data can, however, be down-loaded (as in the current study) in £ and hence nei-ther data accuracy nor observations are lost using this option. The sampling consequences of this are not trivial, since downloading in £ captures a large number of smaller firms. For instance, Chaney et al. (2004), whose sample excludes many small companies due to the imprecision associated with downloading in £000, report Big Four concentra-tion of 50% compared to 8% in our sample.
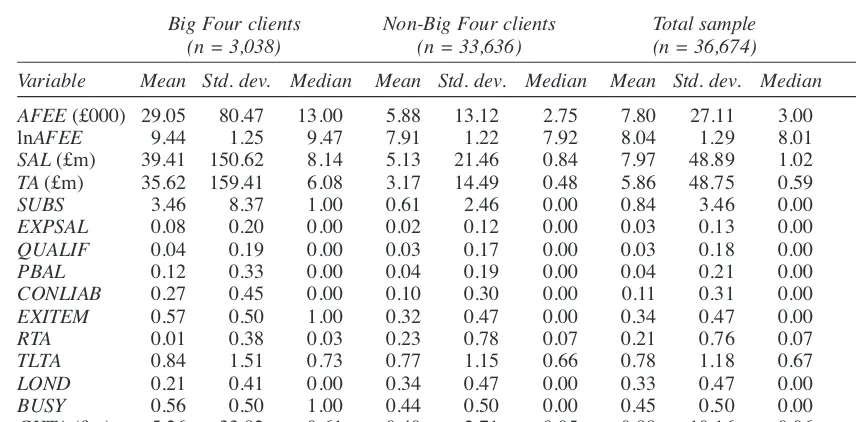
Descriptive statistics are presented in Table 2. The average audit fee (AFEE) for the whole sam-ple (n= 36,674) amounted to £7.80k, with compa-nies having mean sales (SAL) and total assets (TA) of £7.97m and £5.86m respectively. Sales range from a minimum of £1k to a maximum of £4,979m and total assets from £1k to £5,234m. Table 2 also shows that, other than audit qualifications (QUALIF), all variables differ significantly be-tween the Big Four (n = 3,038) and the non-Big Four (n = 33,636) sub-samples. Consistent with prior expectations, Big Four clients are significant-ly larger (as measured by both SALand TA), have more subsidiaries (SUBS), have a higher propor-tion of foreign to total sales (EXPSAL) and report more post balance sheet events (PBAL), contingent liabilities (CONLIAB) and exceptional items (EXITEM). In addition, Big Four clients are less profitable (RTA) more highly geared (TLTA), less
likely to be located in London (LOND), more like-ly to be audited during the busy period (BUSY), with a significantly higher absolute change in the value of total assets (CHTA). Due to the large num-ber of small auditees represented in the non-Big Four sample, the differences in size between Big Four (average sales and total assets of £39.41m and £35.62m) and non-Big Four auditees (average sales and total assets of £5.13m and £3.17m) are substantial.
4. Empirical results
We commence our analysis with standard single-stage OLS regression under the assumption of no selection bias. We then report our comparative analysis employing the two-step Heckman proce-dure, together with associated robustness tests. Finally, we present the results of the matching pro-cedures.
4.1. Single stage results
Model 1 in Table 3 shows the OLS estimates for the standard pooled audit fee specification, which is employed in many previous studies. All explana-tory variables take their expected signs and other than the busy period variable (BUSY), which is sta-tistically significant at the 0.10 level (p= 0.079), all are highly significant (p< 0.0001 in all cases).
Table 2
Descriptive statistics
Big Four clients Non-Big Four clients Total sample
(n = 3,038) (n = 33,636) (n = 36,674)
Variable Mean Std. dev. Median Mean Std. dev. Median Mean Std. dev. Median Sig.
AFEE(£000) 29.05 80.47 13.00 5.88 13.12 2.75 7.80 27.11 3.00 ‡§ lnAFEE 9.44 1.25 9.47 7.91 1.22 7.92 8.04 1.29 8.01 ‡§
SAL(£m) 39.41 150.62 8.14 5.13 21.46 0.84 7.97 48.89 1.02 ‡§
TA(£m) 35.62 159.41 6.08 3.17 14.49 0.48 5.86 48.75 0.59 ‡§
SUBS 3.46 8.37 1.00 0.61 2.46 0.00 0.84 3.46 0.00 ‡§
EXPSAL 0.08 0.20 0.00 0.02 0.12 0.00 0.03 0.13 0.00 ‡§
QUALIF 0.04 0.19 0.00 0.03 0.17 0.00 0.03 0.18 0.00
PBAL 0.12 0.33 0.00 0.04 0.19 0.00 0.04 0.21 0.00 ψ
CONLIAB 0.27 0.45 0.00 0.10 0.30 0.00 0.11 0.31 0.00 ψ
EXITEM 0.57 0.50 1.00 0.32 0.47 0.00 0.34 0.47 0.00 ψ
RTA 0.01 0.38 0.03 0.23 0.78 0.07 0.21 0.76 0.07 ‡§
TLTA 0.84 1.51 0.73 0.77 1.15 0.66 0.78 1.18 0.67 ‡§
LOND 0.21 0.41 0.00 0.34 0.47 0.00 0.33 0.47 0.00 ψ
BUSY 0.56 0.50 1.00 0.44 0.50 0.00 0.45 0.50 0.00 ψ
CHTA(£m) 5.26 33.82 0.61 0.49 2.71 0.05 0.88 10.16 0.06 ‡§
Notes:
Variable definitions are provided in Table 1.
‡ and § indicate means and distributions are significantly different between Big Four and non-Big Four clients at the 0.01 level in t-tests and Mann-Whitney tests respectively.
ψindicates significant difference between Big Four and non-Big Four clients at the 0.01 level in a chi-squared test.
150
A
CCO
U
N
T
IN
G
A
N
D
BU
S
IN
E
S
S
RE
S
E
A
RCH
Table 3
Regression results
OLS single stage models MLE two-step models Heckman two-step models
Model 1 Model 2 Model 3 Model 4a Model 5a Model 6a Model 4b Model 5b Model 6b (Pooled (Big Four (Non-Big (Probit (Big Four (Non-Big (Probit (Big Four (Non-Big
fee) fee) Four fee) choice) fee) Four fee) choice) fee) Four fee)
lnSAL 0.284 0.285 0.286 –0.004 0.285 0.286 –0.005 0.285 0.285
(87.31)** (25.08)** (83.84)** (0.48) (30.93)** (96.44)** (0.50) (29.51)** (92.71)**
lnTA 0.122 0.120 0.120 0.246 0.149 0.113 0.246 0.211 0.101
(36.28)** (10.30)** (33.54)** (23.25)** (8.00)** (34.86)** (23.20)** (5.41)** (25.46)**
SQSUBS 0.258 0.201 0.281 0.087 0.209 0.268 0.088 0.227 0.247
(44.70)** (19.07)** (40.10)** (6.98)** (19.81)** (46.05)** (7.03)** (15.28)** (34.78)**
EXPSAL 0.367 0.627 0.293 0.607 0.688 0.253 0.602 0.822 0.191
(13.15)** (10.91)** (9.41)** (9.84)** (11.34)** (8.98)** (9.77)** (8.36)** (6.17)**
QUALIF 0.115 0.141 0.111 –0.146 0.126 0.118 –0.146 0.094 0.128
(6.18)** (2.56)* (5.58)** (2.61)** (2.30)* (6.06)** (2.61)** (1.57) (6.36)**
PBAL 0.119 0.179 0.098 0.169 0.196 0.084 0.169 0.233 0.063
(7.74)** (5.65)** (5.62)** (4.23)** (5.85)** (4.69)** (4.23)** (5.62)** (3.34)**
CONLIAB 0.095 0.064 0.099 0.014 0.064 0.096 0.013 0.066 0.091
(8.93)** (2.64)** (8.47)** (0.48) (2.57)* (7.68)** (0.45) (2.45)* (7.09)**
EXITEM 0.131 0.126 0.130 –0.081 0.118 0.133 –0.080 0.100 0.137
(17.04)** (5.57)** (15.88)** (3.38)** (5.06)** (16.14)** (3.35)** (3.78)** (15.99)**
TLTA 0.026 –0.009 0.029 0.076 –0.004 0.025 0.076 0.007 0.019
(6.43)** (1.31) (6.24)** (9.07)** (0.48) (8.04)** (8.98)** (0.59) (5.38)**
RTA –0.033 –0.111 –0.031 –0.231 –0.139 –0.031 –0.230 –0.199 –0.032
(7.14)** (3.28)** (6.65)** (8.12)** (3.87)** (6.82)** (8.10)** (4.02)** (6.54)**
LOND 0.208 0.338 0.200 –0.306 0.306 0.210 –0.305 0.237 0.226
(29.69)** (12.38)** (27.63)** (12.15)** (9.93)** (29.10)** (12.11)** (4.72)** (27.93)**
BUSY 0.011 0.010 0.010 0.153 0.026 0.004 0.152 0.0601 –0.005
V
ol
. 39 N
o. 2. 2009
151
Table 3
Regression results (continued)
OLS single stage models MLE two-step models Heckman two-step models
Model 1 Model 2 Model 3 Model 4a Model 5a Model 6a Model 4b Model 5b Model 6b (Pooled (Big Four (Non-Big (Probit (Big Four (Non-Big (Probit (Big Four (Non-Big
fee) fee) Four fee) choice) fee) Four fee) choice) fee) Four fee)
CONSTANT 2.299 2.638 2.302 –4.886 1.967 2.378 –4.870 0.511 2.499
(88.49)** (23.07)** (83.80)** (46.58)** (5.14)** (87.60)** (46.62)** (0.58) (69.11)**
BIG4 0.270
(22.96)**
CHTA 0.007 0.007
(4.17)** (4.27)**
IMR (λ) 0.142 –0.199 0.446 –0.509
(1.80) (9.56)** (2.42)** (8.39)**
N 36,674 3,038 33,636 36,674 3,038 33,636 36,674 3,038 33,636
Adj. R2 0.78 0.80 0.75 – – – – 0.80 0.75
Notes: This table reports regression estimates where the dependent variable is lnAFEE for all models, except Models 4a and 4b where the binary dependent variable is coded 1 if the firm is audited by a Big Four firm, 0 otherwise. Variable definitions are provided in Table 1. Absolute t-statistics are reported in parentheses, except for Models 4b–6b, where z-statistics are in parentheses; t-statistics for OLS models use robust standard errors and corrected standard errors for the Heckman two-step mod-els. * and ** indicate statistical significance at 0.05 and 0.01 levels respectively.
In particular, we note that the BIG4 coefficient (0.270) implies that, on average, the audit fees of a non-Big Four auditee would increase by 31% if it were to employ a Big Four auditor.16Also
note-worthy is that the model explains a relatively high proportion (R2of 78%) of the variation in the audit
fees of UK private companies, comparing favourably with that (57%) reported by Chaney et al. (2004) for their sample of UK private firms.
Models 2 and 3 in Table 3 report OLS estimates for separate audit fee equations for the Big Four and non-Big Four auditee samples. In Model 1, the Big Four equation only differs by a constant from the non-Big Four equation. In common with Chaney et al. (2004) a joint F-test rejected the null hypothesis (F= 13.43; p= 0.000) that the coeffi-cients in the Models 2 and 3 were the same, imply-ing that the fee-settimply-ing process differs between the two auditor types. The main focus of our empirical analysis is therefore Models 2 and 3 in Table 3 (i.e. those which allow the slope coefficients of the ex-planatory variables to differ for the Big Four and non-Big Four models).
Table 3 shows that for the non-Big Four specifi-cation (Model 3) all explanatory variables exhibit their expected signs and, other than for BUSY, which loses statistical significance (p= 0.131), all variables are highly significant (p < 0.0001 in all cases). For the Big Four specification (Model 3), in addition to BUSY, the sign on the gearing coef-ficient (TLTA) is negative, but statistically insignif-icant – a finding in common with Chaney et al. (2004) for their Big Four equation; furthermore, the intercept in Model 2 is larger than in Model 3 – a result also reported by Chaney et al. (2004) and attributed to Big Four auditors recovering higher expenditure on training and facilities.
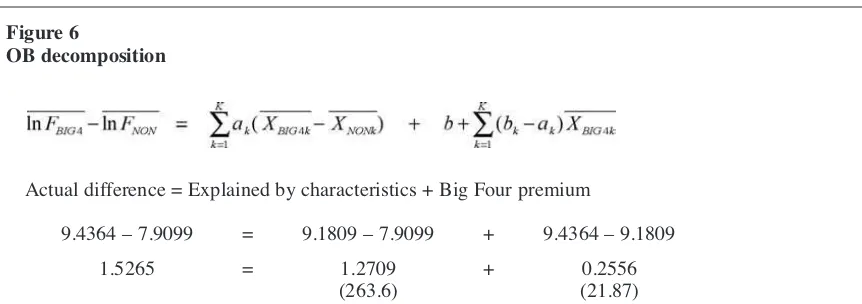
To examine the premium in more detail, we con-duct the Oaxaca-Blinder decomposition (discussed above) on our estimates for Models 2 and 3. The OB decomposition is based on measuring the pre-mium (using the characteristics of the average Big Four auditee) as in Figure 6.
Greene (2003: 54) provides the formulae for the
estimated standard errors of each term in the de-composition and we report the t-values based on this method in parentheses under the estimates. There is a large and significant (p= 0.000) differ-ence in the means of the audit fees paid by compa-nies audited by Big Four and non-Big Four auditors (1.5265) using the parameters from Models 2 and 3. Most of this is accounted for by differences in their respective client characteristics (1.2709 or 83%). However, there is, on average, a significant (p = 0.000) Big Four premium of 0.2556 (29.1%), which is close to that (31.0%) es-timated in the pooled OLS equation (Model 1) and in line with findings in prior research (e.g. Moizer, 1997). On average, Big Four auditees paid audit fees of £12,537 (e9.4364), but would have paid
£9,710 if they were charged according to the non-Big Four parameters (Model 3) – a reduction of 23%.17 Hence, the Oaxaca-Blinder results, based
on Models 2 and 3 are consistent with the presence of a Big Four audit premium. The next section presents our two-stage results where we analyse the extent to which these findings are affected by selection bias.
4.2. Heckman two-step regressions
Table 3 reports the two-step results with maxi-mum likelihood estimates (MLE) and standard Heckman two-step estimates. Models 4a and 4b show the probit selection model estimates for the choice of a Big Four auditor, while Models 5a (5b) and 6a (6b) report the MLE (standard Heckman) audit fee regression estimates for the Big Four and non-Big Four auditees, including the additional parameter λ(for the IMR estimated from the coef-ficients in Model 4) to control for selection bias. The MLE and standard Heckman two-step probit selection models (4a and 4b) are very similar, and in both models, all explanatory variables other
Figure 6
OB decomposition
(9)
Actual difference = Explained by characteristics + Big Four premium
9.4364 – 7.9099 = 9.1809 – 7.9099 + 9.4364 – 9.1809 (10)
1.5265 = 1.2709 + 0.2556
(263.6) (21.87)
16We use the standard transformation ex– 1 (where x= the
coefficient or mean log difference) to compute percentages. 17The alternative decomposition using the characteristics of non-Big Four clients also implied a statistically significant premium (at p= 0.000) of 31%.
than CONLIAB and lnSALare significantly associ-ated with auditor choice at the 0.01 level. In partic-ular, the coefficient on the identifying variable (CHTA) exhibits its expected sign and is highly statistically significant (p= 0.000).18Also
consis-tent with expectations and prior research, Models 4a and 4b show that larger (lnTA), more complex (SQSUBS; EXPSAL) and riskier (RTA; TLTA) com-panies are more likely to appoint a Big Four audi-tor. Companies receiving audit qualifications (QUALIF) are more likely to employ a non-Big Four auditor, in contrast to companies reporting a post-balance sheet event (PBAL) and auditees based in London, which are less likely to select a Big Four auditor, although likely to do so if their year ends fall in the busy period (BUSY).19
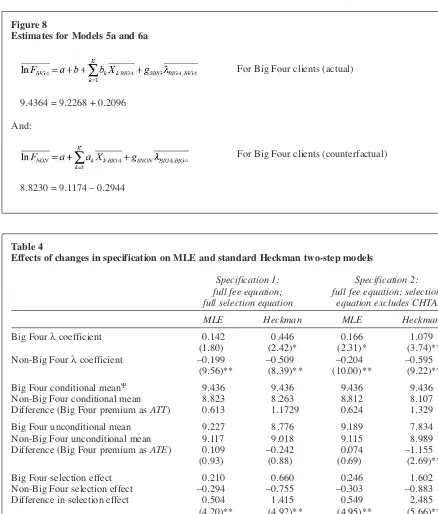
The audit fee equations (Models 5a, 6a, 5b and 6b) contain the same pattern of significance levels as the single stage estimates in Models 2 and 3. The MLE estimates in Table 3 show that the λ
coefficient is negative but highly significant (p= 0.000) for the non-Big Four equation (Model 6a), but positive and only significant at the 0.10 level (p= 0.071) in the Big Four equation (Model 5a). The positive MLE estimate of 0.142 (Model 5a) for the covariance σSBIG4and the negative
esti-mate of –0.199 (Model 6a) for σSNONimply that an
increase in the value for the unobservable error in the auditor selection equation (εSEL) is associated
with an increase in the value of the unobservable component of Big Four fees (εBIG4) and a decrease
in the value of unobservable component of non-Big Four fees (εNON), although the former estimate
is insignificant at the 0.05 level. These results imply that the effect of unobservable auditee char-acteristics is to cause private companies to choose the most expensive auditor and directly contradict the results of Chaney et al. (2004). The results also imply non-Big Four auditees value each type of auditor differently from Big Four auditees: not only are they willing to pay more for non-Big Four auditors; they also place a lower value on the serv-ices of a Big Four auditor.20
The selection estimates of the Big Four premium are also dependent on the estimator used. As the results in Models 5b and 6b show, the standard
Heckman two-step approach amplifies the MLE estimates. Although the λ coefficients have the same signs as their MLE counterparts, and are both significant at the 0.05 level in both equations, they are implausibly large (in absolute terms) at 0.446 for the Big Four and –0.509 for the non-Big Four auditees; thus the λ coefficient in the Big Four equation more than doubles (compared to the MLE). Further indications of model instability are provided by the insignificance of the intercept and
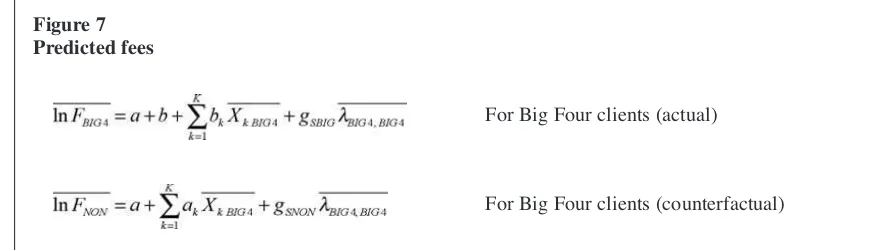
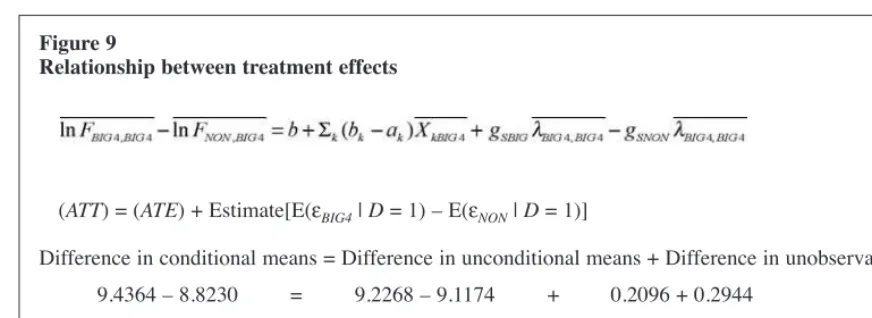
QUALIF in the Big Four Heckman model (5b). It has been acknowledged in prior research (Stolzenberg and Relles, 1997) that interpreting the magnitude of the λcoefficient is difficult due to the abstract nature of the variable itself. Extending the logic of our earlier decomposition to the Heckman results is informative in this context since it allows an assessment of the effects of the coefficient. To calculate the impact of selection bias on the Big Four premium by decomposing the observable and unobservable effects, we concen-trate on the Big Four premium measured at the sample means of the Big Four auditees, i.e. the av-erage effect of the treatment on the treated (ATT). Predicted fees paid by a Big Four client at the sam-ple means are shown in Figure 7.
Figure 7 Predicted fees
For Big Four clients (actual) (11)
For Big Four clients (counterfactual) (12)
18 The statistical insignificance of lnSAL in the auditor choice equation is not related to collinearity with CHTA. When CHTAwas removed from Model 4, lnSALremained statistical-ly insignificant. In addition, when lnSALwas removed from Model 4, CHTAremained positive and statistically significant. 19The Wald statistic of 2668.40 (p< 0.0001) for Model 4b indicates the selection equation is well determined; the McFadden’s R2 is 0.204 and the model correctly classifies (cut-off point of 0.083 – representing the prior probability of selection into the Big Four) 77.52% and 70.81% of the Big Four and non-Big Four auditees respectively.
20Although a priori these findings may appear counterintu-itive and may relate, as discussed below, to the lack of robust-ness of Heckman procedures in audit fee studies, they are not entirely implausible. As discussed earlier, there are numerous explanations (e.g. audit quality effects) for firms paying high-er fees for Big Four audits; similarly, survey-based research by Marriott et al. (2007) finds that very small UK companies pre-fer non-Big Four auditors due to the more personal services and stronger relationships offered by smaller auditors. A fur-ther possibility is that the potential financial gains arising from switching auditor may not justify the associated costs.
Figure 8
Estimates for Models 5a and 6a
For Big Four clients (actual) (13)
9.4364 = 9.2268 + 0.2096
And:
For Big Four clients (counterfactual) (14)
8.8230 = 9.1174 – 0.2944
Table 4
Effects of changes in specification on MLE and standard Heckman two-step models
Specification 1: Specification 2:
full fee equation; full fee equation; selection full selection equation equation excludes CHTA
MLE Heckman MLE Heckman
Big Four λcoefficient 0.142 0.446 0.166 1.079
(1.80) (2.42)* (2.31)* (3.74)** Non-Big Four λcoefficient –0.199 –0.509 –0.204 –0.595
(9.56)** (8.39)** (10.00)** (9.22)**
Big Four conditional meanΨ 9.436 9.436 9.436 9.436 Non-Big Four conditional mean 8.823 8.263 8.812 8.107 Difference (Big Four premium as ATT) 0.613 1.1729 0.624 1.329
Big Four unconditional mean 9.227 8.776 9.189 7.834 Non-Big Four unconditional mean 9.117 9.018 9.115 8.989 Difference (Big Four premium as ATE) 0.109 –0.242 0.074 –1.155 (0.93) (0.88) (0.69) (2.69)**
Big Four selection effect 0.210 0.660 0.246 1.602 Non-Big Four selection effect –0.294 –0.755 –0.303 –0.883 Difference in selection effect 0.504 1.415 0.549 2.485 (4.20)** (4.92)** (4.95)** (5.66)**
Big Four R2(dep. var. = λ)§ 0.986 0.986 0.992 0.992 Non-Big Four R2(dep. var. = λ)§ 0.854 0.858 0.868 0.874
Notes:
The table reports maximum likelihood (MLE) and standard Heckman estimates for three specifications of the two-step correction model. Specification 1 corresponds to the MLE and Heckman models reported in Table 3. Absolute t-values are reported in parentheses.
**, * represent statistical significance at the 0.01 and 0.05 level, respectively.
ΨThe conditional mean is the predicted mean of audit fees conditional on the auditee choosing a Big Four or
non-Big Four auditor, allowing for auditees’ unobservable characteristics. The unconditional mean is the pre-dicted mean of audit fees excluding the selection effects. The difference between the conditional and uncondi-tional means is the selection effect.
§reports the R2for a regression of the selection term on the remaining variables in the audit fee (second stage) equation.