Design of a Flexible Sketch-based Network Traffic
Monitoring System
Theophilus Wellem
∗‡, Yu-Kuen Lai
†, and Chao-Yuan Huang
† ∗Department of Electronic Engineering,†Department of Electrical EngineeringChung Yuan Christian University, Zhongli 32023, Taiwan Email:{g10202604, ylai, g10279008}@cycu.edu.tw
‡Department of Informatics
Satya Wacana Christian University, Salatiga 50711, Indonesia Email: [email protected]
Abstract—Sketch-based data streaming algorithms have been
used in high-speed network monitoring applications to obtain accurate estimates of traffic flow metrics. Because sketch data structure is implemented by using limited fast memory (SRAM) resource, as the number of measurement tasks grows, sketch-based monitoring requires implementation changes or hardware upgrade which is not flexible. This paper presents a scheme for collecting network traffic flow-level data on high-speed network. The purpose is to enable sketch-based algorithms making statis-tics measurements in various network monitoring applications in a flexible manner. The flow collection infrastructure utilizes two tables to store flow keys and counters. Sketch-based monitoring applications then can use these tables to select flow keys and counters for updating their sketch data structure. Trace-driven tests are conducted for superspreader detection application. The results show that the proposed scheme can support flexible selection of flow keys and counters for network monitoring appli-cations. The superspreader detection can achieve high detection accuracy and low fan-out estimation error.
Index Terms—Traffic monitoring; Sketch; Hash table;
Super-spreader; NetFPGA-10G;
I. INTRODUCTION
Network traffic flow monitoring is important for network management and security. Flow metrics, for example, entropy of source/destination IP addresses and ports, flow size dis-tribution, heavy hitters, heavy changers, and superspreaders, are used as the building blocks of many network security applications. These metrics can be obtained using a generic flow monitoring tool such as NetFlow [1]. However, because NetFlow uses packet sampling, it is not accurate for fine-grained flow monitoring [2], [3]. This has led to many research on the application of sketch-based data streaming algorithms for measuring these flow metrics [4]–[7]. Sketch-based data streaming algorithms employ sketch data structure to sum-marize network traffic into a compact representation without packet sampling, using only small amount of memory space. To achieve wire speed update of the sketch data structure, it is implemented by using fast memory in the network device line card.
Sketch-based data streaming algorithms are efficient and have provable memory-accuracy tradeoffs for flow monitor-ing. However, the sketch-based methods are too application-specific and lack of generality to be implemented as primitive
operations on network devices [8], [9]. The challenge to adopt the sketch-based algorithms on network device is that each measurement task (metric in interest) requires its own sketch data structure, as shown in Fig. 1. Direct implementation of sketch data structure in hardware (data plane) is not flexible. As the number measurement tasks increases, sketch-based monitoring requires implementation change or upgrade in the data plane to support the new task in interest [10].
In this work, we propose a scheme to collect network traffic flows without packet sampling. The goal is to provide a flexible selection of flow keys and counters for sketch-based monitoring applications to update their data structure. Instead of implementing the sketch data structure directly in hardware, the proposed system’s data plane utilizes two tables,
flow counter and flow key tables, to collect network traffic flows. One table is used to store the flow’s packet and byte counts and the other table keeps the flow’s 5-tuple (source IP address, destination IP address, source port, destination port, and protocol number) key. The flow counter table is implemented using a hash table with linear probing, and 5-universal hash function is utilized to achieve an average constant number of probes per flow insertion and lookup operations [11]. The probing mechanism makes use the four-word burst architecture of QDRII SRAM. The flow key table is implemented as a FIFO in DRAM.
The remainder of this paper is organized as follows. In Section II, the system architecture is described. The moni-toring application used to evaluate the system, superspreader detection and its algorithm, are outlined in Section III. Section IV presents the evaluation and experiment results. Finally, Section V concludes this paper.
II. SYSTEMARCHITECTURE
...
Query/Estimate
Update Monitoring App. 1
(Entropy estimation)
Monitoring App. 2 (Superspreader
Fig. 1. Sketch-based traffic monitoring is too application-specific. Each mon-itoring application/measurement task requires its own sketch data structures in data plane. (Flow monitoring and statistics functions)
Query/Estimate
Update
Data plane
Fig. 2. System architecture.
probability [11]. The 32-bit flow ID is then hashed again using a 5-universal hash function to obtain a 32-bit hash value. The lower 19-bit of this hash value is the memory (SRAM) address where the flow’s packet and byte counts are stored. The system utilizes two tables. Theflow countertable stores the flow’s 16-bit ID, packet count, and byte count. The 5-tuple flow key is stored in the flow key table, which is implemented using a FIFO in DRAM.
During an observation interval, when a flow entry is created, its 16-bit ID and counters are stored in the flow counter table. The 16-bit ID is obtained from hashing the 32-bit flow ID (the result from TabChar hash) using a 2-universal hash function. A Bloom filter is used to check whether the 5-tuple flow key already exists in the flow key table. If the flow does not exist, then the 5-tuple is added to the flow key table. At the end of observation interval, both of the tables are moved to the host CPU and can be utilized as required by the monitoring applications. The modules presented in the upper part of Fig. 2 is implemented in software on multi-core CPU for parallel
Hash Module
5-tuple R/W Control
Logic
Fig. 3. Hardware modules for flow processing.
s1
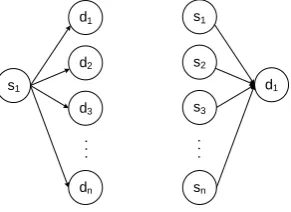
Fig. 4. Fan-out of hosts1 (source) and fan-in of hostd1(destination).
processing of sketches, while the bottom part is implemented in FPGA hardware. The hardware development platform used for implementation is NetFPGA-10G [12]. which contains a Virtex-5 XC5VTX240T FPGA, four 10GbE SFP+ interfaces, three banks of 9MB QDRII SRAM with a total capacity of 27MB, and four 72MB RLDRAM II memories. The main hardware modules for flow processing inside the system is shown in Fig. 3.
III. MONITORINGAPP: SUPERSPREADER DETECTION
Detecting sources (hosts) that have communication with a large number of distinct destinations above a predefined threshold in a measurement interval is important for network anomaly detection. These hosts are known as superspreaders [13] or super sources [7]. For example, an abrupt increase in the number of connections from a particular source to many distinct destinations can be an indication of port scan attack. Conversely, detecting destinations (hosts) that contacted by a large number of distinct sources (super destinations) is useful for detecting the victims of DDoS attack. Fig. 4 illustrates the fan-out of hosts1 and fan-in of host d1.
memory space to store the host’s source IP address and its fan-out counter because the number of distinct sources is large. As an example, in a 60 seconds interval for CAIDA trace [14], there are about 450k distinct source IP address. Assuming that the system stores all sources and their 32-bit fan-out counters, the memory space required is about 3.4 MB. Therefore, fan-out estimation using bitmap and sketch-based algorithms are commonly used [7], [15], [16].
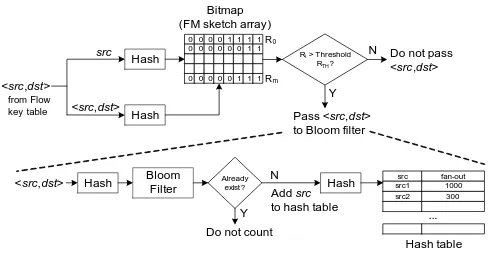
We use the scheme (FM-BF-HT) from our previous work in [17], which combines an FM sketch [18], a Bloom filter, and a hash table for superspreader detection. The main idea of this scheme is to filter out the sources with low fan-out first, and then count only the fan-out of remaining sources (i.e., the potential superspreaders). Therefore, this scheme requires less memory space while maintaining acceptable detection and fan-out estimation accuracy. The scheme of FM-BF-HT is shown in Fig. 5. The superspreader detection is executed for each measurement interval. At the beginning of measurement interval, the Bloom filter, bitmap array, and hash table entries are initially set to zero. The bitmap data structure is utilized to filter out those sources with low fan-out, while the Bloom filter is used to identify a new source-destination IP pair. The hash table maintains the fan-out count of all sources that pass the filtering process. For each source-destination pair read from the flow key table, the bitmap data structure is updated. When a source-destination IP pair ⟨s, d⟩ is processed, it is hashed to the bitmap column, while the source IP sis hashed to the bitmap row. The bitmap is an m×narray of FM sketches. For each row (i.e., source hashed to that row, assuming no collision), the estimate number of distinct destinations can be determined using bni =
(
1
ϕ )
2Ri, i = 1, 2, . . . , m., where
ϕ= 0.77351.Ri is the position of LSB ’0’ for rowi. During
the bitmap update process, when a sourcesis hashed to row i, the corresponding Ri value is compared to a predefined
threshold, RT H. If it is less than RT H then sis filtered out,
else the source-destination IP pair ⟨s, d⟩ is checked to the Bloom filter. If the⟨s, d⟩pair does not exist, it will be added to the Bloom filter. The pair’s sources is then hashed to the hash table and its fan-out counter is updated. No collision resolution is implemented for the hash table. Finally, at the end of measurement interval, the values from hash table are used to report the superspreaders and their corresponding fan-outs.
There are four parameters that can be set in this scheme: (a) number of rows m in the bitmap (number of columns n is fixed to 32), (b) thresholdRT H which determine whether a
source should pass. IfR value of a row is greater thanRT H,
then the source-destination IP pair ⟨s, d⟩ is checked to the Bloom filter, (c) Bloom filter size, and (d) hash table size. The Bloom filter size affects the number of sources added to the hash table.
IV. EVALUATION
Trace-driven tests using CAIDA traces are conducted to evaluate the system. The traces are collected over a 10Gbps
Hash
Hash
Bitmap (FM sketch array)
<src,dst>
src
0 0 0 0 1 1 1 1 0 0 0 0 0 0 1 1
0 0 0 0 0 1 1 1
<src,dst>
R0
Rm
Ri> Threshold RTH?
from Flow key table
Y
N Do not pass <src,dst>
Pass <src,dst> to Bloom filter
<src,dst> Hash Bloom Filter
Already exist?
Y
Do not count N Add src to hash table
Hash
src2 300 src fan-out src1 1000
...
Hash table
Fig. 5. FM-BF-HT scheme for superspreader detection.
Ethernet link of a Tier1 ISP. It comprises of 30 million packets and 1.4 million distinct 5-tuple flows, with a duration of 60 seconds. The number of source-destination pairs and distinct source IP addresses in the trace are 1 million and 450k, respectively. The observation interval is set to 15 seconds in the experiments. In this interval, the number of distinct 5-tuple flows is ranged from 445k to 510k and the number of distinct source-destination IP pairs is about 360-410k.
For superspreader detection, source-destination IP pairs data from the flow key table are used. In all experiments, the superspreader is defined as a source whose fan-out exceeds 200. False negative ratio (FNR) and false positive ratio (FPR) are used to measure the superspreader identification accuracy, while the fan-out estimation accuracy is obtained from scatter plots. The FNR is the number of unidentified superspreaders divided by the number of actual superspreaders, while the FPR is number of non-superspreaders that are incorrectly identified as superspreaders divided by the number of actual superspreaders. The number of actual superspreaders in all four intervals are 80, 82, 78, and 76 source IPs, respectively. Table I shows the results for FPR, FNR, and average fan-out estimation error. The FNR is due to the FM sketch filtering, while the FPR is caused by hash collisions since no collision resolution is implemented for the hash table. The bitmap and Bloom filter sizes are 64 KB and 256 KB, respectively, while the hash table has 512K buckets with total memory size of 4096 KB. The accuracy of fan-out estimation is shown in Fig. 6. The closer the points to the diagonal line, the more accurate the estimation is. From the experiment results, we can conclude that the identification accuracy is high. As an example, in interval 1, there is only one of 80 superspreaders that cannot be identified, and no non-superspreader sources are incorrectly identified as superspreaders (FPR=0). Fig. 7 shows the comparison of exact fan-out and fan-out estimation results for top 10 superspreaders.
V. CONCLUSION ANDFUTUREWORK
TABLE I
FPR, FNR,AND FAN-OUT ESTIMATION RESULTS.
Interval FPR FNR Avg. fan-out est. error
1 0 0.01 4.09%
2 0 0.02 3.89%
3 0 0.05 4.35%
4 0.01 0.02 3.53%
Superspreader detection - FM-BF-HT
200
Fig. 6. Exact vs. estimated fan-out.
Top 10 Superspreader
Fig. 7. Exact vs. estimated fan-out of top 10 superspreaders.
perform various measurement tasks. Superspreader detection application is utilized to evaluate the system using real traffic traces. The experiment results show that it can achieve high detection accuracy and low fan-out estimation error. For future work, we will evaluate more applications and extend the hardware design to achieve higher performance.
ACKNOWLEDGMENT
This research was funded in part by the National Science Council, Taiwan, under contract number: MOST
104-2221-E-033-007 and MOST 103-2221-E-033-030.
REFERENCES
[1] “Cisco NetFlow http://www.cisco.com.”
[2] J. Mai, C.-N. Chuah, A. Sridharan, T. Ye, and H. Zang, “Is sampled data sufficient for anomaly detection?” in Proceedings of the 6th ACM SIGCOMM Conference on Internet Measurement, ser. IMC ’06. New York, NY, USA: ACM, 2006, pp. 165–176. [Online]. Available: http://doi.acm.org/10.1145/1177080.1177102
[3] D. Brauckhoff, B. Tellenbach, A. Wagner, M. May, and
A. Lakhina, “Impact of packet sampling on anomaly detection
metrics,” in Proceedings of the 6th ACM SIGCOMM
Conference on Internet Measurement, ser. IMC ’06. New York, NY, USA: ACM, 2006, pp. 159–164. [Online]. Available: http://doi.acm.org/10.1145/1177080.1177101
[4] A. Lall, V. Sekar, M. Ogihara, J. Xu, and H. Zhang, “Data streaming algorithms for estimating entropy of network traffic,” SIGMETRICS Perform. Eval. Rev., vol. 34, no. 1, pp. 145–156, 2006.
[5] A. Kumar, M. Sung, J. J. Xu, and J. Wang, “Data streaming algorithms for efficient and accurate estimation of flow size distribution,” in Proceedings of the Joint International Conference on Measurement and Modeling of Computer Systems, ser. SIGMETRICS ’04/Performance
’04. New York, NY, USA: ACM, 2004, pp. 177–188. [Online].
Available: http://doi.acm.org/10.1145/1005686.1005709
[6] B. Krishnamurthy, S. Sen, Y. Zhang, and Y. Chen, “Sketch-based change detection: Methods, evaluation, and applications,” inProceedings of the 3rd ACM SIGCOMM Conference on Internet Measurement, IMC ’03. ACM, October 2003, pp. 234–247.
[7] Q. Zhao, A. Kumar, and J. Xu, “Joint data streaming and sampling tech-niques for detection of super sources and destinations,” inProceedings of the 5th ACM SIGCOMM Conference on Internet Measurement, ser. IMC ’05. Berkeley, CA, USA: USENIX Association, 2005, pp. 77–90. [8] M. Yu, L. Jose, and R. Miao, “Software defined traffic measurement with OpenSketch,” inProceedings of the 10th USENIX Conference on Net-worked Systems Design and Implementation, ser. NSDI’13. Berkeley, CA, USA: USENIX Association, 2013, pp. 29–42.
[9] V. Sekar, M. K. Reiter, and H. Zhang, “Revisiting the case for a minimalist approach for network flow monitoring,” inProceedings of the 10th ACM SIGCOMM Conference on Internet Measurement, ser.
IMC ’10. New York, NY, USA: ACM, 2010, pp. 328–341.
[10] Z. Liu, G. Vorsanger, V. Braverman, and V. Sekar, “Enabling a ”RISC” Approach for Software-Defined Monitoring Using Universal Streaming,” inProceedings of the 14th ACM Workshop on Hot Topics in Networks,
ser. HotNets-XIV. New York, NY, USA: ACM, 2015, pp. 21:1–21:7.
[Online]. Available: http://doi.acm.org/10.1145/2834050.2834098 [11] M. Thorup and Y. Zhang, “Tabulation based 5-universal hashing and
linear probing,” in Proceedings of the 12th Workshop on Algorithm Engineering and Experiments ALENEX, 2010, pp. 62–76.
[12] “NetFPGA project site. http://netfpga.org.”
[13] S. Venkataraman, D. Song, P. B. Gibbons, and A. Blum, “New streaming algorithms for fast detection of superspreaders,” inin Proceedings of Network and Distributed System Security Symposium (NDSS), 2005, pp. 149–166.
[14] “CAIDA UCSD Anonymized Internet Traces,” 2012.
[15] M. Yoon and S. Chen, “Real-time detection of invisible spreaders,” in IEEE Global Telecommunications Conference, 2008. IEEE GLOBECOM 2008, 2008, pp. 1–5.
[16] ——, “Detecting Stealthy Spreaders by Random Aging Streaming Filters,”IEICE TRANSACTIONS on Communications, vol. E94-B, no. 8, pp. 2274–2281, Aug. 2011.
[17] T. Wellem, G.-W. Li, and Y.-K. Lai, “Superspreader Detection System on NetFPGA Platform,” inProceedings of the Tenth ACM/IEEE Symposium on Architectures for Networking and Communications Systems, ser.
ANCS ’14. New York, NY, USA: ACM, 2014, pp. 247–248.