Energy poverty reduction by fuel switching. Impact evaluation
of the LPG conversion program in Indonesia
$
Roos Kities Andadari
a, Peter Mulder
b,n, Piet Rietveld
b aSatya Wacana Christian University, Indonesia bVU University Amsterdam, The Netherlands
H I G H L I G H T S
Impact evaluation of a government program to substitute LPG for kerosene in Indonesia. The program caused a large scale shift from kerosene to LPG.
Contradicting the energy-ladder model, the program led to increased stacking of fuels.
The program did not substantially reduce overall energy poverty, but alleviated extreme energy-poverty. Medium and higher income households in suburban areas benefitted most from the LPG program.
a r t i c l e i n f o
Article history: Received 13 August 2013 Received in revised form 8 November 2013 Accepted 10 November 2013 Available online 4 December 2013
Keywords: Clean cooking fuels LPG
Fuel switching Impact evaluation Energy poverty
a b s t r a c t
In low- and middle-income countries, Liquefied Petroleum Gas (LPG) can be an attractive alternative to the widespread use of traditional kerosene. Not only is LPG a relatively clean, safe and cost-effective fuel for households, its large-scale adoption also reduces the heavy burden of kerosene consumption subsidies on government budgets. Against this background, we evaluate the impact of a large government program to substitute LPG for kerosene in Indonesia. Using a household survey across urban, suburban and rural regions wefind that this program was very effective in causing a large scale shift from kerosene to LPG. This shift was positively influenced by level of education, household size and household income. Contradicting the energy-ladder model, the LPG program, reinforced by an increase in the price of kerosene, led to increased stacking of fuels, including increasing consumption of both electricity and traditional biomass. In addition, our analysis shows that the LPG program failed to substantially reduce the overall number of energy-poor people, but it has been effective in alleviating extreme energy-poverty. Finally, wefind that medium and higher income households in suburban areas benefitted most from the LPG program.
&2013 Elsevier Ltd. All rights reserved.
1. Introduction
Household access to efficient and clean energy carriers is vital to alleviate poverty, because these energy carriers provide services that, inter alia, satisfy basic human needs (e.g. cooking and heating), improve productivity (e.g. through mechanical power for pumping, transport or communication) and facilitate schooling (e.g. through illumination for reading at night or reduction of time spent on collecting fuelwood). In short, lack of access to efficient
and clean energy carriers such as electricity and LPG can be defined as energy poverty (IEA, 2010; Modi et al., 2006; Sagar, 2005). Against this background, we evaluate the impact of a government subsidy program to substitute Liquefied Petroleum Gas (LPG) for kerosene in Indonesia.
In 2007 the government of Indonesia introduced a massive energy program to encourage kerosene users to switch to LPG, for a variety of reasons (Budya and Arofat, 2011). In contrast to traditional kerosene, LPG is a relatively clean, safe and cost-effective fuel that avoids the severe threats that widespread consumption of kerosene poses to human health (Lam et al., 2012). Moreover, with the LPG conversion program (hereafter shortly: LPG program) the Indonesian government aimed to increase energy diversification and energy efficiency, and, more importantly, reduce kerosene consumption subsidies. As regards the latter, in many low- and middle-income countries kerosene Contents lists available atScienceDirect
journal homepage:www.elsevier.com/locate/enpol
Energy Policy
0301-4215/$ - see front matter&2013 Elsevier Ltd. All rights reserved. http://dx.doi.org/10.1016/j.enpol.2013.11.021
☆
Roos Kities Andadari and Peter Mulder would like to dedicate this article to the memory of Piet Rietveld, who unexpectedly passed away at November 1, 2013, just beforefinishing the revision of this article. Also, we would like to thank two anonymous referees for their valuable comments. The usual disclaimer applies.
n
subsidies pose a heavy burden on the government budget, while they are often ineffective in reaching their social policy goals (e.g. Rao, 2012). In Indonesia, fuel subsidies ranged up to 18% of total government expenditures in 2008, equivalent to 3.7% of GDP; subsidies for kerosene use by households made up for about 50% of these costs, while the implied price disparity between industry and household prices increasingly triggered unintended use in the form of industry mixing or smuggling abroad (Budya and Arofat, 2011). For this reason, also international financial donors like the International Monetary Fund (IMF) generally oppose these kerosene subsidies and put pressure on national governments in low- and middle-income countries to abandon them. Being a co-product from oil and gas exploration, LPG is then an attractive alternative. In Indonesia this was further motivated by the fact that LPG had the most readily implemented infrastructure compared to other alternatives such as natural gas and electricity (Budya and Arofat, 2011). By the end of 2009, the program had been imple-mented in 15 provinces throughout Indonesia, with more than 44 million LPG conversion packages– consisting of an LPG stove, a small (3 kg) LPG cylinder, a first gas-fill, and accessories (hose, regulator)–have been distributed.
In the literature household energy choices have often been analyzed and understood from the perspective of the energy-ladder model. This model emphasizes the role of income and relative fuel prices in determining fuel choices (Leach, 1992; Barnes et al., 2005;Barnes and Floor, 1999). More specifically, it envisions a three-stage fuel switching process. Thefirst stage is marked by universal reliance of household on biomass. In the second stage, households move to ‘transition’ fuels such as kerosene, coal, and charcoal in response to higher incomes and factors such as deforestation and urbanization. In the third phase, households switch from biomass to LPG, natural gas, or electricity. The idea of an energy-demand ladder, however, has also been criticized, because of the widespread use of multiple fuels for a particular purpose (such as cooking). Increasing evidence from a growing number of countries indeed shows that households consume a portfolio of energy sources spanning different points of the energy ladder. Rather than moving away from previously used fuels when adopting a new fuel, households in low- and middle-income countries often tend to stack fuels (Barnes and Qian, 1992;Hosier and Dowd, 1987; Hosier and Kipondya, 1993; Heltberg 2004, 2005; Masera et al., 2000). The widespread practice of fuel stacking suggests that the household propensity to choose a particular energy carrier is guided by a combination of household attributes, incentives, and constraints–including the nature of appliances used, prices of complementary equipment such as stoves or canisters, household size, educational status and occupation of household members, convenience, safety, speed of cooking, cultural factors, startup costs, availability and various location characteristics (Barnes et al., 2005; Beyene and Koch, 2013; Gebreegziabher et al., 2012; D'Sa and Narashimha Murty, 2004; Edwards and Langpap, 2005; Kowsari and Zerriffi, 2011; Kroon et al., 2013; Miah et al., 2009; Wijayatunga and Attalage, 2002). In Indonesia, a study on determinants of household demand for kerosene indeed found that household income, family size, kerosene prices, LPG prices, and household taste significantly influence kerosene usage (Putriyani and Oswari, 2005).
Nevertheless, to strengthen evidence-based policies that encou-rage the use of clean cooking fuels in developing countries, a better understanding on the use of incentives to switch fuels is required (Foell et al., 2011). As convincingly argued by Foell et al. (2011), specific research needs include the impacts of energy poverty alleviation programs on human welfare, by means of improved data collection and analysis on specific projects. This study aims to contribute to this area of research. Using a recent household survey among 550 households, we evaluate the LPG program by the
Indonesian government with a focus on its impact on energy poverty and fuel stacking. To the best of our knowledge, this is thefirst study evaluating the impact of an LPG conversion program on changes in energy poverty. We do so by developing energy poverty lines and then calculate the percentage of households below these energy poverty lines, before and after the implementa-tion of the program. Moreover, followingPachauri et al. (2004)and Pachauri and Spreng (2004), in defining energy poverty we not only take into account expenditure on energy, but also look at the relative quality of fuels and ease of access. We think considering access is an important complement to a consumption-based mea-sure of energy poverty, because what distinguishes a poor house-hold from a wealthy one is also the wider range of choices as in which fuels to use (more efficient, more convenient, and less polluting) and which equipment and appliances to buy. Tradition-ally, in many low- and middle-income countries accessibility of LPG is higher in urban than in rural areas, but the LPG program in Indonesia explicitly attempted to change this. Unlike most house-hold energy studies that consider LPG (e.g.Barnes et al., 2005;Farsi, et al., 2007;Sathaye and Tyler, 1991) we therefore not only cover urban areas but also suburban and rural areas. Finally, we provide an econometric analysis of determinants of fuel choice, and expli-citly analyze the impact of the LPG program on fuel stacking.1
The structure of the paper is as follows.Section 2describes our data and presents key descriptive statistics of the household survey we use.Section 3analyses the impact of the LPG program on the household energy consumption pattern, both in terms of energy use and energy expenditure. In Section 4 we provide evidence of the impact of the LPG program on energy poverty. Section 5concludes.
2. Data and descriptive statistics
The national household energy consumption pattern in Indo-nesia, before the implementation of the LPG program, is summar-ized in Table 1.2 First of all, the table con
firms the well-known pattern that poorer households spend a higher percentage of their income on energy. As regards the energy mix, the table shows the well-known dominance of traditional biomass consumption, espe-cially for poorer households: it accounts on average for about one-third of the total household energy consumption, while this percentage increases to about 60% for the poorest households. The reverse is true for electricity: it also accounts on average for about one-third of the total household energy consumption, but with increasing percentages for richer households. In contrast, LPG consumption is still very limited: on average less than 3% of total household energy consumption, with consumption almost entirely restricted to the richest households.
Before the LPG conversion program was applied, kerosene consumption was in the range of 12 million kilo-liters every year. At that time, the amount of subsidy reached around USD 8 billion. This figure changed over time in accordance with changing international crude oil prices, with a peak of more than USD 14 billion in 2008 (Budya and Arofat, 2011). Without subsidy, kero-sene production cost is around Rp 6.700/liter; whereas the price of kerosene with a subsidy used to be Rp 2.500/liter. In contrast, LPG production cost for the equivalent to one liter of kerosene without subsidy is Rp 4.200/liter; whereas the price of LPG with subsidy is again Rp 2.500/liter. In other words, per liter kerosene subsidies are Rp 1.700 higher than LPG subsidies.
1These elements also set our study apart from previous evaluations of the same LPG program byAmirruddin (2009)andLatifah (2010).
2
For our evaluation of the LPG program we make in this paper use of an energy survey questionnaire among family heads or key family members. The survey has been conducted in five sub-districts in Central Java. Two rural sub-sub-districts have been taken from Semarang Regency, two suburban sub-districts have been taken from the border of Salatiga Town, and one urban sub-district in Salatiga Town. About 550 households are taken from thesefive sub-districts. A description of thesefive sub-districts is shown in Table 2. Note that the differences between rural and urban areas in this study are relatively small compared with other parts of Java. First, Salatiga is a relatively small city of about 150,000 and the other municipalities considered are rather close to this city, i.e., within commuting distance.3
The LPG conversion program began in 2007; the Semarang area was completed in 2008; the Salatiga conversion occurred in 2007/8. The surveys were conducted from early November 2009 to the end of January 2010. Throughout this article we use the term‘before implementation of the conversion program’to describe the situa-tion before 2008 while the term ‘after implementation of the conversion program’refers to the situation in the period end 2009/ beginning 2010.
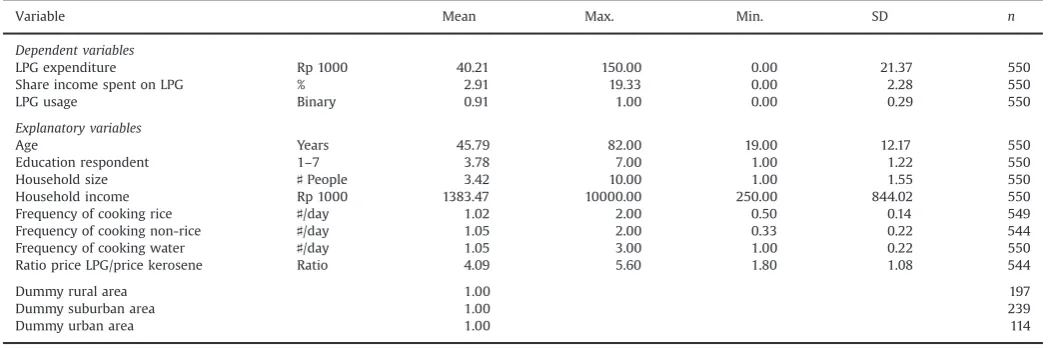
Table 3presents some key descriptive statistics of the data from the surveys we use. As regards to the use of LPG, the respondents in our sample spend on average about Rp 40.000 for LPG
Table 1
Household energy expenditure pattern in Indonesia before the implementation of the LPG program, 2007. Source: Consumption Expenditure of Residents of Indonesia.
Expenditure class (Rp/capita/month) Energy (%) Electricity (%) LPG (%) Kerosene (%) Charcoal (%) Fuelwood, waste (%)
Tot Ene Tot Ene Tot Ene Tot Ene Tot Ene Tot Ene
less than 100,000 27.9 100 5.8 20.6 0.0 0.0 5.9 21.2 0.1 0.4 16.1 57.8
100,000–149,999 25.3 100 6.4 25.3 0.0 0.2 5.2 20.6 0.2 0.6 13.5 53.2
150,000–199999 22.0 100 6.3 28.5 0.1 0.5 5.5 25.0 0.2 0.8 10.0 45.3
200,000–299,999 18.6 100 6.0 32.3 0.2 1.1 5.5 29.7 0.1 0.7 6.7 36.2
300,000–499,999 14.6 100 5.4 37.4 0.5 3.4 4.9 33.5 0.1 0.8 3.6 25.0
500,000–749,999 10.0 100 4.4 43.5 0.7 7.2 3.2 32.3 0.1 0.7 1.6 16.4
750,000–999,999 7.8 100 3.7 48.1 0.8 9.8 2.4 31.0 0.1 0.8 0.8 10.2
1000,000 and over 3.4 100 1.8 54.9 0.5 13.4 0.8 23.0 0.0 0.9 0.3 7.8
average 14.6 100 5.1 34.9 0.4 2.8 4.3 29.6 0.1 0.7 4.7 31.9
Tot¼Total energy expenditure as percentage of total (non-food) expenditure; and Ene¼Expenditure on energy type as percentage of total energy expenditure.
Table 2
Description of research areas.
Source: Kabupaten Semarang dalam Angka 2009; Salatiga dalam angka 2009.
Type of sub-district Name of sub-district District Distance to Salatiga center (km)
Rural Pabelan Semarang Regency 7
Rural Getasan Semarang Regency 9
Suburban Tingkir Salatiga City 3
Suburban Argomulyo Salatiga City 2
Urban Sidomukti Salatiga City 0.5
Table 3
Descriptive statistics.
Variable Mean Max. Min. SD n
Dependent variables
LPG expenditure Rp 1000 40.21 150.00 0.00 21.37 550
Share income spent on LPG % 2.91 19.33 0.00 2.28 550
LPG usage Binary 0.91 1.00 0.00 0.29 550
Explanatory variables
Age Years 45.79 82.00 19.00 12.17 550
Education respondent 1–7 3.78 7.00 1.00 1.22 550
Household size ♯People 3.42 10.00 1.00 1.55 550
Household income Rp 1000 1383.47 10000.00 250.00 844.02 550
Frequency of cooking rice ♯/day 1.02 2.00 0.50 0.14 549
Frequency of cooking non-rice ♯/day 1.05 2.00 0.33 0.22 544
Frequency of cooking water ♯/day 1.05 3.00 1.00 0.22 550
Ratio price LPG/price kerosene Ratio 4.09 5.60 1.80 1.08 544
Dummy rural area 1.00 197
Dummy suburban area 1.00 239
Dummy urban area 1.00 114
3
Obviously, the classification in term of urban/rural is relative. This division, however, can be generalized for the Java area, but cannot be easily used to
(footnote continued)
consumption, which on an average is equivalent to 3% of total expenditure. This is substantially higher than the national average of 0.4% (seeTable 1), obviously because of the implementation of the LPG program in the area of our survey. The LPG/kerosene price ratio refers to the situation after implementation of the conversion program. Most of the respondents in our sample (about 67%) are female, due to the fact that, especially in rural areas, women are best informed about domestic use of energy. In suburban areas, the distribution of respondents between women and men is almost equal. The average age of respondents is 45 years old, with only marginal differences between the sub-districts. Most of the respondents (about 86%) are married. The average number of household members is 3.4 people while the education level of the respondents is relatively low. The average monthly income per household is Rp 1.38 million. This amount is higher than the minimum wage in this area of about Rp 800,000.4
Our survey is admittedly limited in scope, given the fact that it includes a very small number of households relative to the total population of Indonesia. On one hand, this implies that the survey does not adequately represent the condition of the entire island of Java, let alone the whole of Indonesia. On the other hand, the survey focused predominantly on the income groups that were target of the LPG conversion program. Also, it covers the area where the LPG conversion program began in 2007, and evaluated its impact a few years later. Finally, the survey has been repre-sentative in that it included a town in Central Java (Salatiga) close to the provincial capital, and covered both the area in town and outside the town.
3. The LPG program and energy use patterns
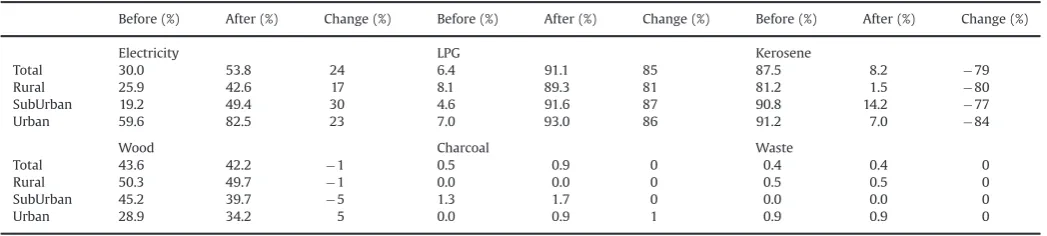
Since this paper looks at the impact of an LPG program, we focus our analysis on energy use for cooking. To cook, some households in our sample use a single energy source, but most use a combination of two or more types of energy. The pattern of energy use for cooking among the households in our sample is summarized inTable 4. The numbers denote the percentage of total households using a specific energy source (i.e. numbers are binary), before and after the introduction of the LPG program.
From the table it can be seen that before the LPG conversion program was implemented, the vast majority of households (about 87.5%) relied on kerosene for domestic cooking, either as single source or in combination with other types of energy. Underlying data show that in rural areas, people mostly used kerosene in combination with another type of energy; whereas in sub(urban)
areas more people relied on kerosene as their single source for cooking. Moreover, a small percentage of the households (7.1%) used fuelwood as their single energy source for cooking, and, as expected, its proportion is relatively high in rural areas. After kerosene, fuelwood appeared to be the second-most used source of energy for cooking (43.6%), followed by electricity (30%). Before the introduction of the LPG program, only 6.4% of the households used LPG for cooking.
After the introduction of LPG, the vast majority of people switched to LPG as a source for domestic cooking; the percentage of households using LPG increased from 6.4% to 91.1% as a result of the LPG program. In urban areas even 93% of the households use LPG after the conversion program, against 7% before the program. In rural areas the numbers are only slightly lower, with more than 89% of the households using LPG after the program was intro-duced. Thus, our data show that the LPG program was highly successful in causing a large scale shift from kerosene to LPG. This
finding confirms previous evidence of the successfulness of the program presented byBudya and Arofat (2011). It is to be noted, that these numbers include both households that use LPG as their single source of energy for cooking, and households that use LPG in combination with other types of energy. In urban and suburban areas the number of respondents who use LPG as their single source of energy for cooking is considerably higher than in rural areas. Obviously, this is due to the fact that in rural areas people have easier access to the alternative source of (cheap) biomass.
From Table 4 it can also be seen that the LPG program had almost no impact on the number of households using traditional energy sources (wood, charcoal, and waste) for cooking. In other words, although in our survey area LPG clearly acts as a substitute for kerosene, it appears to be rather a complement than a substitute to traditional energy sources.5 This
finding contradicts earlier results presented byOuedragogo (2006), whofinds that in Burkina Faso's capital fuelwood is a typical transition good, of which consumption will decrease in response to increased LPG consumption. However, it confirms the finding of Kebede et al. (2002) that the demand for traditional fuels will increase with income, given the budget elasticities. In any case, thisfinding again lends evidence to the view that households tend to stack fuel, rather than to switch fuels in the linear mode of the energy ladder model. Interestingly,Table 4also shows that the implementation of the LPG program led to a considerable increase in the share of households using electricity for cooking. Possibly, this side effect of the program is due to an income effect, caused by decreasing effective energy costs when switching from kerosene to LPG, but a
Table 4
Types of energy used for cooking, before and after LPG Program. Percentage of households using a fuel type.
Before (%) After (%) Change (%) Before (%) After (%) Change (%) Before (%) After (%) Change (%)
Electricity LPG Kerosene
Total 30.0 53.8 24 6.4 91.1 85 87.5 8.2 79
Rural 25.9 42.6 17 8.1 89.3 81 81.2 1.5 80
SubUrban 19.2 49.4 30 4.6 91.6 87 90.8 14.2 77
Urban 59.6 82.5 23 7.0 93.0 86 91.2 7.0 84
Wood Charcoal Waste
Total 43.6 42.2 1 0.5 0.9 0 0.4 0.4 0
Rural 50.3 49.7 1 0.0 0.0 0 0.5 0.5 0
SubUrban 45.2 39.7 5 1.3 1.7 0 0.0 0.0 0
Urban 28.9 34.2 5 0.0 0.9 1 0.9 0.9 0
4In comparison: the average household size in Indonesia is 4.51 persons; the average household expenditure is in 1000 Rp 921 for all households, while it is 1227 and 705 for households in urban and rural areas, respectively (source: The Indonesia Family Life Survey (IFLS)).
more probable cause may be the substantial kerosene price increase implemented during this period.6
It is to be noted that the conversion from kerosene to LPG is a process. Kerosene was not completely withdrawn by the time the survey was taken. It could still be purchased by people, but only in certain places and at an increased price. In rural areas accessibility has been relatively low due to infrastructure limitations. During thefirst phase of the program (May–December 2007) the prices of both kerosene and LPG rose, due to supply shortages. In the case of LPG these shortages were caused by distribution problems and temporarily, while kerosene supply was intentionally reduced as part of the LPG program. As a result, the price of kerosene increased with 150–200% in this period (Budya and Arofat, 2011). In order to gain more insight in the impact of the LPG program on the stacking of fuels by households we developed per house-holdna fuel stacking indexSn, defined as
if energy typeiis consumed), otherwiseEi¼0. We multiplyEiwith
1/6 because we distinguish six types of energy in our survey (Electricity, LPG, kerosene, charcoal, fuelwood, and waste). Conse-quently, in case of no fuel stacking (i.e. a household consumes one fuel type) the indexSnfor householdnis 1/6. In case of maximum stacking (i.e. a household consumes the full portfolio of 6 energy sources), the indexSnfor householdnis 1. Next, we calculated the index before and after the LPG program was introduced. The results are summarized inTable 5, by showing the average value of the index Sn across all households (Total), and across all households in a respective area (rural, suburban, and urban).
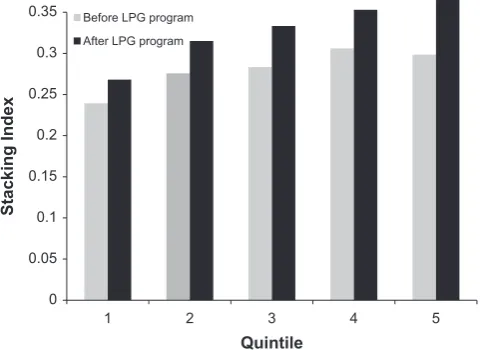
The table shows that the LPG program clearly contributed to the use of multiple fuels by households. Moreover,Table 5shows that the increase in fuel stacking as a result of the LPG program is particularly strong in suburban areas, while the degree of stacking is highest in urban areas. This is not surprising as in (sub)urban areas households have easier access to multiple fuels than in rural areas, and on average are also wealthier. As regards the latter, In Fig. 1we relate the degree of fuel stacking to household income.
From thefigure it can be seen that the fuel stacking index rises overall by income quintile, especially after the LPG program has been implemented. Moreover, the figure reveals that the LPG program contributed most to an increasing use of multiple fuels in the highest quintile. Interestingly, the latter supports the evidence reported in the literature that households consume a portfolio of energy sources spanning different points of the energy ladder in response to rising income (Masera et al., 2000).
To have a better understanding of the actual fuel stacking behavior of households, we analyze inTable 6the combination of the three main energy types for cooking (LPG, kerosene and wood) as used among households, before and after the LPG program.
Again, the numbers denote the percentage of total households. FromTable 6it can be seen that the percentage of households that exclusively rely on kerosene for cooking dropped from 32% to virtually 0% as a result of the LPG program. In contrast, the number of households that only use LPG for cooking increased from about 2% to 20%. The LPG program, however, had virtually no impact on the number of households that only use fuelwood for cooking. Similarly, if we look at the distribution of households using various combinations of these fuels, we find a sharp decrease in the percentage of households that use kerosene in combination with other fuels, while the opposite is true for LPG, and with no effect on the wood in the energy mix.
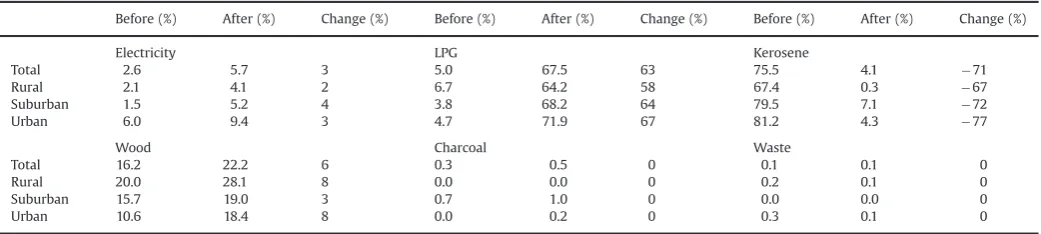
Next, to better understand the impact of the LPG program on the energy expenditure patterns of households, we present in Table 7the energy expenditure shares per energy source, before and after the LPG program was introduced. The results mirror those of Table 4 in that they clearly show a large shift from expenditure on kerosene to LPG, due to the LPG program. More-over the numbers reveal that households spend relatively more on kerosene before the LPG program than on LPG after the LPG program, supporting the notion that LPG is the more cost-effective fuel for cooking. Also, in line with results presented inTable 4, it can be seen that after the LPG program the expenditure shares of electricity increased considerably, while they remained almost constant for the traditional energy types charcoal and waste. In contrast, while we found no impact of the LPG program on the number of households using fuelwood for cooking (Table 4), the LPG program led households to spend relatively more on fuel-wood. Most users of wood (67%) do not spend money for the wood because they get it from their own garden, which means that nearly 1/3 of the household buy wood for domestic energy purposes. Background data reveal that these households faced increasing market prices of fuelwood.
In total, the average monthly expenditures for cooking energy after the introduction of the LPG program have decreased by 14.5% (from Rp 77.423 to 67.598, i.e. a decrease with 9.834).7The highest Tabel 5
Impact of LPG program on Stacking Index.
Mean Before After Change (%)
Total 0.28 0.33 17
Fig. 1.Fuel staking index across the household income distribution.
6After conversion, the LPG price to be paid by consumers varies between Rp13,000 and Rp15,000 per 3 kg canister. In contrast, the price of kerosene after implementation of the conversion program conversion ranged between Rp 6000 and Rp 9500 per liter.
expenditure decrease is enjoyed by households in suburban areas, while rural households experienced the lowest decrease. The latter is due to the aforementioned fact that households in rural districts have a relatively high tendency to combine LPG use with fuelwood for cooking. We return to this issue in more detail inSection 4. Finally, the combined results presented inTables 4,6and7imply that the observed increased fuel stacking as a result of the LPG program is at least to a considerable degree explained from the increasing use of electricity for cooking, after the LPG program was introduced.
Most users of LPG (90%) began using LPG in the year of 2006/ 2007, a period in which the conversion program was implemented in Salatiga and Semarang District. Those who started using LPG before 2006 (9%) usually used a 12 kg or 6 kg LPG canister. As noted before, the LPG program included the introduction of small 3 kg cylinders, which are adopted by most new LPG users, while also some existing LPG users (3.2%) switched towards the 3 kg LPG canister. The average monthly expenditures for LPG use (Rp 44,000) equals the consumption of an average three small (3 kg) LPG canisters. These small cylinders are intensively distributed all over our survey area, including rural areas. According to govern-ment regulation, LPG is distributed to consumers via designated LPG intermediaries. However, in areas with high density of population and infrastructure, in practice many actors perform as intermediaries between LPG producers and consumers. For example, 3 kg LPG units are sold in many small stalls located near the consumers and many of these sellers are even willing to take up LPG to the consumers' house. Because of the implied severe competition among these actual LPG intermediaries, prices do not vary much among the various districts. As a result there is not much difference in LPG expenditures among the three sub-districts (although it is slightly lower in rural areas).
Several factors are considered to influence households in using LPG for domestic cooking. They include personal characteristics of the respondent and its spouse (age and education), characteristics of the household (size, structure, and income), cooking behavior,
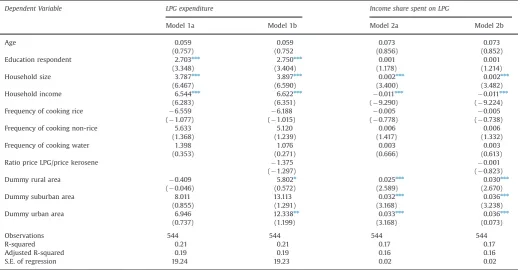
access to and relative price of LPG, and the type of district. To identify their relative importance, we designed various OLS regression models to explain absolute and relative monthly house-hold expenditures for buying LPG, as well as the income share spent on LPG. The regression results are presented inTable 8.
From regression model 1 inTable 8it can be seen that absolute LPG expenditure is positively influenced by the level of education of the respondent (measured with a dummy for having at least a high school degree), size of the household, and household income.8 In
addition, model 1b shows that a higher relative LPG price (as compared to kerosene) negatively impacts the absolute expenditure on LPG, although the effect is statistically not significant. If we use the same model structure to explain the income share spent on LPG (model 2), we find that the results are dominated by a negative income effect: households with higher incomes spent a smaller share of their income on LPG, which is of course what we would expect for a non-luxury good. The role of education and household size is similar to model 1, but their magnitude is now considerably lower. These results largely confirm earlierfindings in the literature (see e.g. Heltberg, 2004,Farsi et al., 2007, Rao and Reddy, 2007; Viswanathan and Kavi Kumar, 2005).
Next, using the same explanatory variables, we applied a logit regression model structure in order to explain whether or not households use LPG. In addition, we use the same structure to gain insight in the use of LPG as compared to the main competing fuels. We do so by identifying the determinants of the decision by house-holds to use more LPG than kerosene, or more LPG than wood. The regression results of these models are presented inTable 9.
From regression model 3 in Table 9it can be seen that the decision whether or not to adopt LPG is positively influenced by education level and a decreasing price ratio LPG/kerosene, while
Table 7
Change in cooking energy expenditure share, due to LPG Program.
Before (%) After (%) Change (%) Before (%) After (%) Change (%) Before (%) After (%) Change (%)
Electricity LPG Kerosene
Total 2.6 5.7 3 5.0 67.5 63 75.5 4.1 71
Rural 2.1 4.1 2 6.7 64.2 58 67.4 0.3 67
Suburban 1.5 5.2 4 3.8 68.2 64 79.5 7.1 72
Urban 6.0 9.4 3 4.7 71.9 67 81.2 4.3 77
Wood Charcoal Waste
Total 16.2 22.2 6 0.3 0.5 0 0.1 0.1 0
Rural 20.0 28.1 8 0.0 0.0 0 0.2 0.1 0
Suburban 15.7 19.0 3 0.7 1.0 0 0.0 0.0 0
Urban 10.6 18.4 8 0.0 0.2 0 0.3 0.1 0
Table 6
Types of energy used for cooking, before and after LPG program. Percentage of households.
Before (%) After (%) Change (%) Before (%) After (%) Change (%) Before (%) After (%) Change (%)
LPG only Kerosene only Wood only
Total 2.2 19.5 17 32.0 0.4 32 6.5 6.5% 0
Rural 3.6 20.8% 17 27.4 0.0 27 10.7 9.6 1%
suburban 2.1 24.3 22 38.9 0.8 38 5.4 4.6 1
Urban 0.0 7.0 7 25.4 0.0 25 1.8 5.3 4
LPGþother Keroseneþother Woodþother
Total 4.2 71.6 67 55.5 7.8 48 37.1 35.6 1
Rural 4.6 68.5 64 53.8 1.5 52 39.6 40.1 1
Suburban 2.5 67.4 65 51.9 13.4 38 39.7 35.1 5
Urban 7.0 86.0 79 65.8 7.0 59 27.2 28.9 2
Table 8
OLS Regression results; after LPG program.
Dependent Variable LPG expenditure Income share spent on LPG
Model 1a Model 1b Model 2a Model 2b
Age 0.059 0.059 0.073 0.073
(0.757) (0.752 (0.856) (0.852)
Education respondent 2.703nnn
2.750nnn
0.001 0.001
(3.348) (3.404) (1.178) (1.214)
Household size 3.787nnn
3.897nnn
0.002nnn
0.002nnn
(6.467) (6.590) (3.400) (3.482)
Household income 6.544nnn
6.622nnn
0.011nnn
0.011nnn
(6.283) (6.351) ( 9.290) ( 9.224)
Frequency of cooking rice 6.559 6.188 0.005 0.005
( 1.077) ( 1.015) ( 0.778) ( 0.738)
Frequency of cooking non-rice 5.633 5.120 0.006 0.006
(1.368) (1.239) (1.417) (1.332)
Frequency of cooking water 1.398 1.076 0.003 0.003
(0.353) (0.271) (0.666) (0.613)
Ratio price LPG/price kerosene 1.375 0.001
( 1.297) ( 0.823)
Dummy rural area 0.409 5.802n
0.025nnn
0.030nnn
( 0.046) (0.572) (2.589) (2.670)
Dummy suburban area 8.011 13.113 0.032nnn
0.036nnn
(0.855) (1.291) (3.168) (3.238)
Dummy urban area 6.946 12.338nn
0.033nnn
0.036nnn
(0.737) (1.199) (3.168) (0.073)
Observations 544 544 544 544
R-squared 0.21 0.21 0.17 0.17
Adjusted R-squared 0.19 0.19 0.16 0.16
S.E. of regression 19.24 19.23 0.02 0.02
Note:t-values in parenthesis.
n
Significance 1%.
nn
Significance 5%.
nnn
Significance 10%.
Table 9
Logit regression results; after LPG program.
Dependent variable LPG usage LPG4KERO LPG4WOOD
Model 3a Model 3b Model 4a Model 4b Model 5a Model 5b
Age 0.010 0.010 0.010 0.011n
0.002 0.002
( 1.281) ( 1.285) ( 1.588) ( 1.645) (0.389) (0.383)
Education respondent 0.144n
0.144n
0.080 0.079 0.199nnn
0.198nnn
(1.761) (1.761) (1.164) (1.134) (3.281) (3.258)
Household size 0.012 0.011 0.004 0.009 0.056 0.060
(0.228) (0.190) (0.082) ( 0.190) ( 1.347) ( 1.434)
Household income 0.183 0.179 0.168 0.149 0.220 0.213
(0.811) (0.797) (1.079) (0.962) (1.487) (1.449)
Frequency of cooking rice 0.826n
0.833n
0.771n
0.839nn
0.804n
0.818n
( 1.697) ( 1.710) ( 1.773) ( 1.963) ( 1.820) ( 1.834)
Frequency of cooking non-rice 0.663n
0.680n
0.224 0.298 0.719nn
0.746nn
(1.892) (1.952) (0.607) (0.801) (2.461) (2.551)
Frequency of cooking water 0.143 0.211 0.274 0.284
(0.451) (0.685) (0.760) (0.785)
Ratio price LPG/price kerosene 0.039n
0.208nnn
0.073
( 0.574) ( 2.800) (0.866)
Dummy rural area 1.091 0.917n
1.603nn
0.682nnn
0.465 0.794
(1.330) (1.081) (2.141) (0.846) ( 0.574) ( 0.886)
Dummy suburban area 1.259 1.112nnn
1.381n
0.617nnn
0.278 0.552
(1.485) (1.334) (1.775) (0.775) ( 0.330) ( 0.617)
Dummy urban area 1.264 1.111nnn
1.469n
0.675 0.269 0.553
(1.464) (1.303) (1.874) (0.831) ( 0.325) ( 0.619)
Observations 544 544 544 544 544 544
Observations with Dep¼0 49 49 73 73 118 118
Observations with Dep¼1 495 495 471 471 426 426
S.E. of regression 0.28 0.28 0.34 0.34 0.40 0.40
Note:z-values in parenthesis; significance.
Quasi-complete separation: Frequency of cooking water perfectly predicts binary response success.
n
Significance 1%.
nn
Significance 5%.
nnn
this decision is negatively influenced by the frequency of cooking rice. These results are very similar to the OLS regression models presented inTable 8, which is reassuring. The notable difference between model 1 and model 3 is that household size and house-hold income explain a considerable part of the expenditure on LPG (model 1), but do not play a statistically significant role in the adoption decision (model 3). This suggests that the observed large-scale substitution of LPG for kerosene, as induced by the LPG program, has been largely independent of household char-acteristics, while after adoption household characteristics appear to be a main driver of frequency of use.
The negative impacts of a higher frequency of cooking rice on the decision to adopt LPG in model 3 is a result that returns in the succeeding models that look at the choice of LPG over competing fuels. This rather robustfinding can be explained from the fact that households with access to electricity primarily use an electrical rice cooker for cooking rice. Besides being more practical, the use of electricity for cooking rice is relatively cheap (average electricity expenses for cooking rice are less than Rp 2.000, per day). This observation corresponds with the relative increase in electricity expenditure after the LPG program was implemented (see Table 7).9 In addition, the results of model 4 show that, apart
from these cooking preferences, the trade-off between kerosene and LPG consumption is largely determined by the price ratio LPG/ kerosene, which confirms the success of the LPG program to promote LPG as the better alternative to kerosene. Finally, model 5 clearly reveals that the choice of LPG over wood is positively influenced by the education level, in addition the aforementioned role of cooking rice.
We conclude this section by analyzing reasons to (not) adopt LPG, based on respondent's answers to specific survey questions. The results of this analysis are shown inFig. 2. Thefigure shows the main reasons for (not) using LPG, expressed as an average score across respondents, on a scale from 1 to 5. It reveals that cleanness, saving time of cooking (fast), cost-effectiveness, easi-ness, healthiness and other practical reasons are key drivers of the adoption decision. On the other hand, key barriers to LPG adoption among households appear to be technological unfamiliarity (fear for explosion), its relative user price (it is considered expensive, even though in reality it is relatively cheap), relative high upfront costs (size of canister too big), taste and preferences, and cooking
habits (needs to be watched). These findings underscore the conclusion ofBudya and Arofat (2011)that reducing the number of LPG accidents continues to be a major challenge of the LPG program. It appears that these accidents are increasing over time, and have been mainly caused by lack of understanding in using the equipment, illegal manufacturing and distribution practices and unsafe environmental conditions (Budya and Arofat, 2011). Never-theless, given the number of LPG conversion packages distributed, the number of accidents is relatively very small, but their impact on public opinion is considerable because of media coverage (Budya and Arofat, 2011); which is exactly what we see in our survey.
4. Energy poverty
In this section we assess to what extent the LPG conversion program by the Indonesian government has had an impact on energy poverty. We do so by looking at the percentage of population that falls below certain so-called energy poverty lines, before and after the LPG program was introduced.
Various approaches exist to measure energy poverty (e.g. Barnes et al., 2011; Kemmler and Spreng, 2007; Pachauri et al., 2004; Pachauri and Spreng, 2004, 2011; Pereira et al., 2011). In developing our energy poverty lines we apply and compare three approaches to energy poverty. Thefirst approach defines energy poverty in terms of the percentage of income spent on energy consumption. The obvious underlying idea is that poor people spend a relatively high share of their income on energy–Table 1 in Section 2 illustrates that this is also true in Indonesia. The second approach translates the monetary expenditure on energy consumption into an amount of useful energy. The underlying notion here is that energy services (such as cooking) can be derived from a variety of energy carriers, with poor households often using energy carriers with a relative low fuel efficiency (for example, animal dung, fuelwood or charcoal instead of electricity or LPG). The third approach starts with the notion of fuel efficiency but goes one step further by also taking into account the fact that the various energy types differ in terms of ease of access. Here the underlying observation is that poor households tend to have a relatively small range of choice as regards which energy types to use.
Using only energy expenditures to measure energy poverty (the first approach) would easily underestimate the extent of energy poverty, since it ignores the fact that the same amount of money can be spent on efficient as well as inferior energy carriers. The second approach corrects household energy expenditures for the relative quality of the energy mix consumed. Based on
Fig. 2.Main reasons for (not) adopting LPG by households.
9
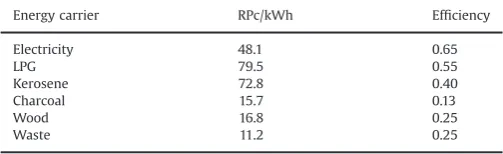
the so-called energy access-consumption matrix, as developed by Pachauri et al. (2004)andPachauri and Spreng (2004), and used by Vermaak et al. (2009), we do so by converting household energy expenditures into useful energy consumption levels, using per energy carrier a price-to-kWh conversion factor and an efficiency factor.10 Consequently, this ‘useful energy’ approach
takes into account the fact that poor people often need to spend a higher share of their income to buy the same amount of useful energy as more wealthy households. The third approach offers the most comprehensive way to identify energy poverty since it weighs the useful energy consumption levels, derived by the second approach, with the accessibility of the energy carriers used by a household–the greater the accessibility of the energy source, the higher the weighting it receives.11 This methodology is
summarized inTable 10.
Accessibility can be measured in various ways. We start by classifying the different energy carriers in three groups: traditional energy sources (waste, fuelwood, and charcoal), transitional energy sources (kerosene) and modern energy sources (LPG and electricity). Traditional energy carriers always receive a weighting of one, to define the baseline. Subsequently, we apply two weighting schemes. Thefirst one focuses on revealed preferences and is derived from the percentages of households actually using an energy source for cooking, based on counting the number of households exclusively using a specific energy source. These counts are normalized to one, with households using traditional fuels as reference, and differentiated between before and after the LPG program.12The second weighting scheme uses the following
ex ante weights: 1 for traditional fuels, 2 for traditional fuels plus kerosene and 3 for all of those plus LPG. This approach expresses the freedom a user enjoys: the more choice she has, the better the situation in which the userfinds herself.Table A2in the Appendix details the values of the weighting schemes.
To evaluate the impact of the LPG conversion program on changes in energy poverty we use these methodologies to calcu-late the percentage of households below three energy poverty
lines, before and after the implementation of the program. These energy poverty lines are defined as follows: (i) extreme poor
corresponds with energy needs of the poorest; (ii)medium poor
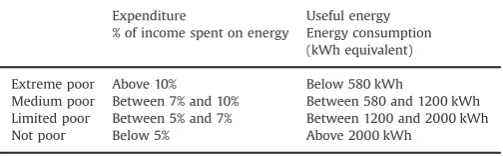
corresponds with satisfying basic household energy needs; and (iii)limited poorcorresponds with satisfying modern household energy needs. In the first approach of our methodology (see Table 10) these thresholds are expressed in terms of percentage of income spent on energy consumption. In the other approaches these thresholds are expressed in terms of energy units (kWh). The energy expenditure threshold values we use are consistent with the general literature in that a household is considered energy poor if it spends more than 10% of its income on energy needs, while households that are able to meet modern energy needs usually spend less than 5% of their income on energy consumption. To determine the threshold values in energy terms we use pre-existing energy consumption levels. The energy consumption threshold at the level of the extreme poor is 580 kWh, which corresponds to about 50 kg of oil equivalent (Modi et al., 2006)–households below this level are not able to cook with modern cooking fuels and lack a bare minimum of electric lighting to read, or for other household and productive activities after sunset. The medium and limited poor energy consumption thresholds we use are 1200 and 2000 kWh, respec-tively, and represent the IEA's minimum level of energy access required for households to satisfy basic needs and modern needs, respectively.Table 11summarizes the threshold values. The key results of our energy poverty analysis are presented inTables 12 and13.
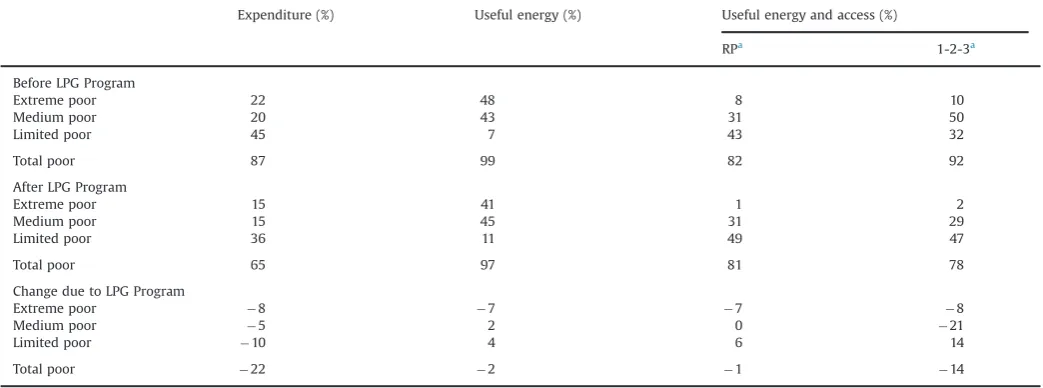
Table 12shows the incidence of energy poverty in our research area, before and after the LPG conversion program, using the three measures of energy consumption described before. Also it can be seen that the second,‘Useful Energy’, approach classifies consider-ably more people below the respective poverty lines than the expenditure approach. In fact, taking into account the quality of the fuel mix implies that virtually all people (99%) in our research area can be considered to be‘energy-poor’. This result confirms that using standard energy expenditures to measure energy poverty indeed easily underestimates the extent of energy pov-erty, because it does not acknowledge the relatively poor quality of the actual energy mix used by the majority of the people. If we also account for the accessibility of the various fuels, energy poverty incidence rates drop to 80–92%, depending on the accessibility weighting scheme. This drop in energy poverty incidence is due to the fact that people have fairly easy access to a range of fuels, especially traditional biomass. This means that,
Table 10
Methodology for calculating energy poverty.
Measures Calculation of energy consumption
1. Expenditure Expenditure on energy
2. Useful energy Expenditure on energyPrice-to-kWh conversion factorefficiency factor
3. Useful energy and access Expenditure on energyPrice-to-kWh conversion factorefficiency factoraccess factor
Table 11
Definition of threshold values energy poverty.
Expenditure Useful energy
% of income spent on energy Energy consumption (kWh equivalent)
Extreme poor Above 10% Below 580 kWh
Medium poor Between 7% and 10% Between 580 and 1200 kWh
Limited poor Between 5% and 7% Between 1200 and 2000 kWh
Not poor Below 5% Above 2000 kWh
10
SeeTable A1in Appendix for the list of conversion and efficiency factors. Using conversion factors derived byWinkler (2006), this methodology has also been applied to South African Income and Expenditure data byVermaak et al (2009), who conducted considerable sensitivity analysis on which fuels should be allocated per category. We use his weighting scheme.
11It is to be noted that energy accessibility not only depends on the prices of the various energy carriers. It also depends on the price of complementary equipment and appliances (including stoves, canisters, etc.) and, of course,first and foremost on the very supply of the energy carriers–note that in low- and middle-income countries supply of LPG is often restricted to urban areas (e.g.Gupta and Köhlin 2006).
12
to a certain extent, ease of access can compensate for low fuel efficiency.
The result inTable 12also reveals that the LPG program led to a considerable reduction of energy poverty when measured in terms of expenditure: after the program was implemented, expenditure-based energy poverty incidence decreased with 22 percentage-points, from 87% to 65%. However, once we control our measure of energy poverty for the quality of the fuel mix and accessibility to energy sources, it becomes clear that the LPG program has not been very effective in reducing energy poverty. Table 12 shows that when we account for fuel efficiency, we only find a 2% reduction in the number of energy-poor people due to the LPG program. When we additionally control for the accessibility of energy sources (‘Useful Energy & Access’) using the Revealed Preference (RP) weighting scheme for accessibility, we find a comparably small reduction of 1% in poverty incidence after the LPG program was implemented. When we use the 1-2-3 weighting scheme for accessibility, we see that in comparison with the RP weighting scheme energy poverty incidence is higher before the program while lower after the program. Hence, relative to the RP
accessibility weighting scheme the 1-2-3 weighting scheme amplifies the impact of the LPG program, leading to a reduction of energy poverty incidence of 14%. This of course is still less than the expenditure approach, confirming the conclusions above, but it is also considerably more than the 1–2% that wefind when using the other‘Useful Energy’approaches.
Table 12also shows that it is the medium poor for which the 1-2-3 weighting scheme has the biggest impact in terms of energy poverty reduction, as compared to the other approaches. This can be explained from the fact that, given the relatively frequent occurrence of mixed use of traditional and modern energy sources among this group, they benefitted most from increased access to a modern fuel like LPG, while still having access to traditional fuels like wood and (to a lesser content) kerosene. Furthermore, Table 12 shows that for the group of ‘limited poor’households, the LPG program led to an increase in energy poverty incidence, across all approaches that account for the quality of the fuel mix. This counterintuitive result is most likely to be explained from the fact that the LPG program led to a considerable increase in fuel stacking, as reported before. This stacking of fuel includes a
Table 12
(Change in) total percentage of households below different poverty lines.
Expenditure (%) Useful energy (%) Useful energy and access (%)
RPa
1-2-3a
Before LPG Program
Extreme poor 22 48 8 10
Medium poor 20 43 31 50
Limited poor 45 7 43 32
Total poor 87 99 82 92
After LPG Program
Extreme poor 15 41 1 2
Medium poor 15 45 31 29
Limited poor 36 11 49 47
Total poor 65 97 81 78
Change due to LPG Program
Extreme poor 8 7 7 8
Medium poor 5 2 0 21
Limited poor 10 4 6 14
Total poor 22 2 1 14
aRP
¼Revealed preferences; 1-2-3¼modern, transitional and traditional fuels receive a weight of, respectively 1, 2, and 3.
Table 13
Percentage of households below different poverty lines, before and after LPG Program.
Expenditure kWh useful kWh useful and access
Revealed Preference 1-2-3
Before (%) After (%) Change (%) Before (%) After (%) Change (%) Before (%) After (%) Change (%) Before (%) After (%) Change (%)
Rural Extreme poor 14 7 7 62 45 17 12 3 9 2 2 0
Medium poor 11 16 6 35 51 16 45 37 8 40 19 21
Limited poor 19 18 2 0 0 0 35 51 16 50 53 3
Total poor 44 41 3 97 96 1 92 91 1 92 74 18
Suburban Extreme poor 29 20 9 53 43 10 4 2 2 2 1 1
Medium poor 25 15 10 35 40 5 12 28 16 42 33 9
Limited poor 28 19 9 11 14 3 44 49 5 44 44 0
Total poor 82 54 28 99 97 2 60 79 19 88 78 10
Urban Extreme poor 25 18 7 58 43 15 9 4 5 11 4% -8
Medium poor 18 14 4 33 44 11 26 25 1 46 25 21
Limited poor 25 30 4 5 9 4 45 49 4 31 47 17
reduced but persistent use of kerosene and increased consumption of fuelwood (Tables 4and7). As noted before, in the period after the LPG program was introduced, market prices of both kerosene and fuelwood have increased.
At the same time, it is to be noted that, despite the limited impact of the LPG program on total energy poverty reduction, the program has been rather effective in alleviating extreme energy poverty. Across all measures of energy poverty, the LPG program reduced the percentage of people in the‘extreme poor’group, i.e. people living under the lowest energy-poverty line. It is this group that used to rely most heavily on kerosene. Since LPG has a higher energy quality than kerosene, and, as shown in the previous section, the LPG program has been very effective in causing a large scale shift away from kerosene to LPG, energy poverty reduction has been relatively successful among the poorest households.
Finally,Table 12shows that, except for the expenditure-based approach, the decrease in the number of people below the lowest energy-poverty line contributes to an increasing number of medium and limited energy-poor people, as people move up on the energy ladder. This effect is not captured by the expenditure-based approach, because its exclusive focus on monetary expen-ditures implies that it only captures the absolute transfer of government subsidies involved with the LPG program to house-holds, independent of their position on the energy ladder. As a result, it overstates the impact of the LPG program on real poverty incidence and highlights that the expenditure-based approach does not adequately capture the dynamics of household behavior in response to government intervention. More in general, these
findings confirm that the correlation between general monetary
poverty and energy poverty is not always high. Some households are poor in monetary terms but do have access to adequate sources and amounts of energy to meet minimum needs; con-versely, some households that are rich in monetary terms do not have access to modern energy (Pachauri and Spreng, 2011).
Next, we present in Table 13 a break-down of our results, by differentiating the presented aggregatefindings into results for the rural, suburban and urban areas, respectively.Table 13leads to a couple of interesting conclusions. First, measured in terms of expenditures, energy poverty incidence is highest in suburban areas, but when we account for quality and accessibility of energy sources the most deprived areas in terms of energy poverty are rural. If we take into account the quality of the fuel mix but not its accessibility, wefind almost no cross-area variation in total energy poverty rates as well as high levels of extreme energy-poverty incidence (i.e. people below the lowest energy-poverty line). These results confirm once more that across the various areas households consume a mix of energy sources, that is fairly comparable in terms of quality but differ greatly in terms of accessibility, with rural areas being most disadvantaged in terms of access to a range of fuels.
Second, Table 13 shows that the reduction in energy poverty measured by the expenditure-based approach is mainly realized in suburban areas, where the LPG program induced a 28 percentage-point decrease in energy poverty. At the same time, it can be seen that the marginal reduction in energy poverty incidence under the ‘Useful Energy’and‘Useful Energy & Access’(revealed preference weighting) approach, as presented inTable 12, is mainly driven by increasing energy poverty incidence among the medium and limited poor households in suburban areas. This means that it is
particular in suburban areas that the dynamics of household behavior render the expenditure-based approach too optimistic in its evaluation of the LPG program, because of its ignorance of accessibility and fuel quality aspects. In addition, it can be seen that the differences between the two accessibility weighting schemes are largest among extreme and medium poor households. Because these groups predominantly live in, respectively rural and suburban areas, the differences between the two weighting schemes geogra-phically mainly appear here. FromTable 13it can be seen that this effect is especially strong in suburban areas ( 10% versus þ19%).
Moreover,Table 13reveals that the limited overall impact of the LPG program on reducing energy poverty under the‘Useful Energy’ approach can be found across all areas. Nevertheless, as noted before, once we control for the quality of the fuel mix (‘Useful Energy’) the LPG program has been very effective in alleviating extreme energy poverty.Table 13shows that this effect has been particular strong in rural areas. Again, from the table it can be seen that these people gradually move up the energy ladder, thereby increasing the number of people in ‘medium’ and (to a lesser extent)‘limited’energy-poverty classes.
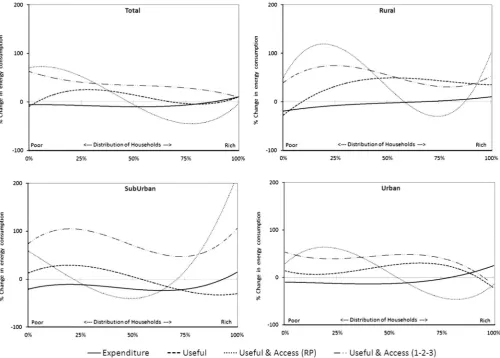
Wefinish this section by looking into the impact of the LPG program on energy consumption across the entire income dis-tribution of households–using the various measures of poverty across the various area types. The results of this analysis are presented inFig. 3. Thefigure displays estimated trend lines of the relation between (on the vertical axis) the percentage change in energy consumption as a result of the LPG program, and (on the horizontal axis) the household income ranked from low to high.13
Thefigure leads to a couple of interesting observations. First, it can be seen that for most households the percentage change of energy consumption is negative in terms of expenditure (first approach) and positive in terms of kilowatt hour (the other three approaches). In terms of expenditure a negative change of energy consumption is defined as a lower share of income spent on energy, while in terms of kWh a positive change of energy consumption means that households have more possibilities to satisfy their basic and modern needs. Hence, thisfirstfinding from thefigure confirms the overall positive impact of the LPG program. Second, when we look in more detail to the percentage change of energy expenditure, we see that in general (‘Total’) the medium income households benefitted most, and this result is mainly driven by decreasing energy expenditures in suburban areas (confirming the results presented inTable 13). Third, in terms of ‘Useful Energy’the benefits are highest for the medium and higher incomes in rural areas, and the poorer households in suburban areas. It is here that the improved quality of the fuel mix pays off most, because these households used to be particularly dependent of kerosene consumption. Finally, when we also take into account the accessibility of fuels (‘Useful Energy & Access’), we see that higher income households in suburban areas benefitted dispro-portionally strong from the LPG program.
5. Conclusions
We evaluated the impact of a massive energy program to sub-stitute Liquefied Petroleum Gas (LPG) for kerosene in Indonesia, based on a household survey across urban, suburban and rural regions. We found that the LPG program has successfully encouraged people to switch from kerosene dependence to LPG, confirming previous evidence presented byBudya and Arofat (2011). Also, we show that
the LPG program, reinforced by an increase in the price of kerosene, contributed to a small increase in the consumption of electricity and biomass and an increased stacking of fuels. As regards the latter, the use of multiple fuels particularly increased in (sub)urban areas, and among higher income households. It appears that fuel stacking is largely driven by increases in the prices of fuel wood and kerosene, which coincide with the implementation of the LPG program in Indonesia. In general, the use of LPG has been positively influenced by the level of education, household size and household income, and exhibits considerable regional variation.
A previous evaluation of the LPG program byBudya and Arofat (2011) showed that, in spite of increased fuel prices (which initially led to increased inflation and mass protest by the population), the LPG program generated considerable benefits to the government (kerosene subsidy savings), the business commu-nity (new jobs), the environment (lower greenhouse gas emis-sions) and end users. As regards government savings, the large scale shift from subsidized kerosene to subsidized LPG led to a gross subsidy saving of almost USD 3 billion by May 2010. After accounting for LPG conversion costs of almost USD 1.2 billion USD, net savings for the Indonesian government were about USD 1.8 billion by May 2010 (Budya and Arofat, 2011). Hence, the LPG program substantially reduced the burden on the government budget and thus certainly has not been a shift from one expensive energy policy program to another. As regards benefits to end users, Budya and Arofat (2011) presented survey evidence that the majority of consumers were positive about the use of LPG, particular in terms of safety, relative costs, ease of use, and expectations about future availability.
Unlike their analysis, we examined in particular to what extent the LPG conversion program by the Indonesian government has had an impact on energy poverty. We defined energy poverty not only in terms of income spent on energy consumption, but also controlled for the quality of the energy mix and the degree of accessibility to energy sources. In conclusion, we found that, measured in terms of expendi-tures, energy poverty incidence is highest in suburban areas, but when we account for quality and accessibility of energy sources the most deprived areas in terms of energy poverty are rural. Also our analysis
Table A2
Access factors.
Fuels Revealed preferences 1-2-3
HH using an energy source for cooking
HH using an energy source for cooking
Price to kWh conversion factors (i) and efficiency conversion factors.
Energy carrier RPc/kWh Efficiency
Currency conversion: 1 RAS Rand¼1.12 Rp
shows that the LPG program failed to substantially reduce the overall number of energy-poor people, but it has been effective in alleviating extreme energy poverty, i.e. the percentage of people living under the lowest energy-poverty line. Finally, we found that medium and high income households in suburban areas benefitted most from the LPG program.
These conclusions support the notion that successful diffusion of clean cooking technologies depends critically on the local context (Foell et al., 2011). Moreover, our analyses suggest that long-term promotion of the advantages and proper usage of LPG is an important ingredient of effective energy policies, given the fact that even in the case of a successful fuel switching program, like in Indonesia, unfamiliarity with LPG is a key barrier to its adoption and safe use. In addition, we found that part of the benefits of the LPG program was undone by increased fuel stacking. Stacking of fuels is partly motivated by the wish to increase supply security, but since it implies continued use of relatively inefficient and expensive fuels it clearly has its price. Hence, policies to convert kerosene into LPG consumption on a large scale also depend on efforts to control prices of competing fuels and to reduce uncer-tainties in the supply chain of both the new fuel (LPG) and the competing fuel (kerosene). More in general, our results demon-strate that a large scale shift away from an unsafe, polluting and cost-ineffective cooking fuel like kerosene is feasible and leads to considerable positive effects, not only for the end user, but also for the government, the business community and the environment.
Appendix
SeeTables A1–A3 here.
References
Amirruddin, 2009. Analisis Pengetahuan, Persepsi dan Sikap Konsumen Terhadap Produk LPG Pertamina Kemasan 3 Kilogram. Studi Kasus di Desa Leuwiliang, Kecamatan Leuwiliang, Kabupaten Bogor, Jawa Barat. Analysis of Consumer's Knowledge, Perception and Attitude Toward Pertamina's Product of 3 Kilogram LPG (Master theses). MB, IPB Bogor.
Barnes, D.F., Floor, W., 1999. Biomass energy and the poor in the developing countries. J. Int. Aff. 53, 237–259.
Barnes, D.F., Qian, U., 1992. Urban Interfuel Substitution, Energy Use and Equity in Developing Countries. World Bank Industry and Energy Department Working Paper, Energy Series Paper 53, Washington, DC.
Barnes, D.F, Krutilla, K., Hyde, W., 2005. The Urban Household Energy Transition; Energy, Poverty, and the Environment in the Developing World. World Bank, Washington, DC.
Barnes, D.F., Khandker, S.R., Samad, H.A., 2011. Energy poverty in rural Bangladesh. Energy Policy 39, 894–904.
Beyene, A.D., Koch, S.F., 2013. Clean fuel-saving technology adoption in urban Ethiopia. Energy Econ. 36, 605–613.
Budya, H., Arofat, M.Y., 2011. Providing cleaner energy access in Indonesia through the mega project of kerosene conversion to LPG. Energy Policy 39, 7575–7586. D'Sa, A., Narashimha Murty, K.V., 2004. LPG as a domestic cooking fuel option for
India. Energy Sustainable Dev. VIII, 91–106.
Edwards, J.H.Y., Langpap, C., 2005. Startup costs and the decision to switch from
firewood to gas fuel. Land. Econ. 81, 570–586.
Farsi, M., Filippini, M., Pachauri, S., 2007. Fuel choices in urban Indian households. Environ. Dev. Econ. 12, 757–774.
Foell, W., Pachauri, S., Spreng, D., Zerriffi, H., 2011. Household cooking fuels and technologies in developing economies. Energy Policy 39, 7487–7496. Gebreegziabher, Z., Mekonnen, A., Kassie, M., Köhlin, G., 2012. Urban energy
transition and technology adoption: The case of Tigrai, northern Ethiopia. Energy Econ. 34, 410–418.
Gupta, G., Köhlin, G., 2006. Preferences for domestic fuel: analysis with socio-economic factors and rankings in Kolkata, India. Ecol. Econ. 57, 107–121. Heltberg, R., 2004. Fuel Switching: evidence from eight developing countries.
Energy Econ. Econ. 26, 869–887.
Heltberg, R., 2005. Factors determining household fuel choice in Guatemala. Environ. Dev. Econ. 10, 337–361.
Hosier, R.H., Dowd, J., 1987. Household fuel choices in Zimbabwe; an empirical test of the energy ladder hypothesis. Resour. Energy 9, 347–361.
Hosier, R.H., Kipondya, W., 1993. Urban household energy use in Tanzania: prices, substitutes and poverty. Energy Policy 21, 453–573.
IEA, 2010. World Energy Outlook. International EnergyAgency, Paris p. 2010. Kebede, B., Bekele, A., Kedir, E., 2002. Can the urban poor afford modern energy?
The case of Ethiopia. Energy Policy 30, 1029–1045.
Kemmler, A., Spreng, D., 2007. Energy indicators for tracking sustainability in developing countries. Energy Policy 35, 2466–2480.
Kowsari, R., Zerriffi, H., 2011. Three dimensional energy profile; A conceptual framework for assessing household energy use. Energy Policy 39, 7505–7517. Kroon, B., van der, R., Brouwer, P.J., van Beukering, H., 2013. The energy ladder:
theoretical myth or empirical truth? Results from a meta-analysis. Renew. Sustainable Energy Rev. 20, 504–513.
Latifah, E.W., 2010. Analisis Persepsi, Sikap, dan Strategi Koping Keluarga Miskin Terkait Program Konversi Minyak Tanah ke LPG di Kota Bogor. Skripsi. IPB, Bogor.
Lam, N.L., Smith, K.R., Gauthier, A., Bates, M.N., 2012. Kerosene: a review of household uses and their hazards in low- and middle-income countries. J. Toxicol. Environ. Health B 15, 396–432.
Leach, G., 1992. The energy transition. Energy Policy 20, 116–123.
Table A3
Regression Coefficient TrendlinesFigure 3;y¼αx3þβx2þγxþδ.
αa β γ δ R²
All
Expenditure 0.001 0.000 0.009 5.703 0.04
Useful energy 0.002 0.002 0.517 10.067 0.32
Useful energy and access (RP) 0.004 0.003 0.169 70.139 0.23
Useful energy and access (1 2 3) 0.001 0.008 0.257 62.888 0.41
Rural
Expenditure 0.008 0.003 0.341 19.538 0.74
Useful energy 0.030 0.013 1.805 29.235 0.31
Useful energy and access (RP) 0.200 0.067 4.129 46.258 0.21
Useful energy and access (1 2–3) 0.070 0.022 1.653 38.149 0.40
Suburban
Expenditure 0.020 0.006 0.473 21.421 0.16
Useful energy 0.020 0.010 0.752 12.154 0.62
Useful energy and access (RP) 0.040 0.003 1.090 59.307 0.37
Useful energy and access (1-2-3) 0.060 0.019 1.451 72.533 0.12
Urban
Expenditure 0.050 0.003 0.045 9.921 0.35
Useful energy 0.200 0.035 1.013 14.677 0.28
Useful energy and access (RP) 0.600 0.099 3.650 25.435 0.27
Useful energy and access (1-2-3) 0.200 0.035 1.337 54.454 0.32
Masera, O.R., Saatkamp, B.D., Kammen, D.M., 2000. From linear fuel switching to multiple cooking strategies: a critique and alternative to the energy ladder model. World Dev. 28, 2083–2103.
Miah, M.D., Al Rashid, H., Shin, M.Y., 2009. Wood fuel use in the traditional cooking stoves in the rural floodplain areas of Bangladesh: a socio-environmental perspective. Biomass Bioenergy 33, 70–78.
Modi, V., McDade, S., D., Lallement, Saghir, J., 2006. Energy Services for the Millennium Development Goals. Energy Sector Management Assistance Pro-gramme, United Nations Development ProPro-gramme, UN Millennium Project, and World Bank, New York.
Ouedragogo, B., 2006. Household preference for cooking in urban Ouagadougou, Burkina Faso. Energy Policy 34, 3787–3795.
Pachauri, S., Müller, A., Kemmler, A., Spreng, D., 2004. On measuring energy poverty in Indian households. World Dev. 32, 2083–2104.
Pachauri, S., Spreng, D., 2004. Energy use and energy access in relation to poverty. Econ. Polit. Wkly. 39, 17–23.
Pachauri, S., Spreng, D., 2011. Measuring and monitoring energy poverty. Energy Policy 39, 7497–7504.
Pereira, M.G., Vasconcelos Freitas, M.A., Fidelis da Silva, N., 2011. The challenge of energy poverty: Brazilian case study. Energy Policy 39, 167–175.
Putriyani, D., Oswari, T., 2005. Analisis faktor–faktor yang mempengaruhi permin-taan konsumsi minyak tanah rumah tangga, studi kasus konsumen minyak
tanah rumah tangga di Kecamatan Sukmajaya, Depok. In: Proceeding Seminar Nasional PESAT.
Rao, M.N., Reddy, B.S., 2007. Variations in energy use by Indian households: An analysis of micro level data. Energy 32, 143–153.
Rao, M.N., 2012. Kerosene subsidies in India: when energy policy fails as social policy. Energy Sustainable Dev. 16, 35–43.
Sagar, A.D., 2005. Alleviating energy poverty for the world's poor. Energy Policy 33, 1367–1372.
Sathaye, J., Tyler, S., 1991. Transitions in household energy use in urban China, India, The Philippines, Thailand, and Hong Kong. Ann. Rev. Energy Environ. 16, 295–335.
Viswanathan, B., Kavi Kumar, K.S., 2005. Cooking fuel use patterns in India: 1983– 2000. Energy Policy 33, 1021–1036.
Vermaak, C., M. Kohler, M., Rhodes, B., 2009. Developing energy based poverty indicators for South Africa. J. Interdiscip. Econ. 21, 63–195.
Wijayatunga, P.D.C., Attalage, R.A., 2002. Analysis of household cooking energy demand and its environmental impact in Sri Lanka. Energy Convers. Manage. 43, 2213–2223.