Handgrip Strength Prediction Formula Using Aneroid
Sphygmomanometer in Elderly
Akhmad Yahin, Marina Annette Moeliono, Marietta Shanti Prananta
Department of Physical Medicine and Rehabilitation, Faculty of Medicine, Universitas Padjajaran-Dr. Hasan Sadikin General Hospital
Abstract Objective: To examine the prediction formula used to measure handgrip strength using aneroid sphygmomanometer in elderly.
Methods: This study was a cross-sectional study performed at the Department of Physical Medicine and Rehabilitation, Faculty of Medicine, Universitas Padjadjaran-Dr. Hasan Sadikin General Hospital from March to
April 2015. Thirty five elderly subjects aged 60–74 years were included in
the study. The subject handgrip strength was measured using an aneroid sphygmomanometer and a Jamar dynamometer.
Results: All data were analyzed statistically using Pearson correlation test to examine the distributed data and Spearman test to examine the non
distributed data. A significant correlation was found between hand width,
age, and sex and the handgrip strength values using Jamar dynamometer (p<0.01) using multiple linear regression (p<0.01). A normality test using the Shapiro-Wilk test resulted normal residue with p value 0.000. The results showed that the regression analysis could be used to predict the handgrip strength using aneroid sphygmomanometer.
Conclusions: Aneroid sphygmomanometer can be used to predict handgrip strength in elderly using conversion formula.
Keywords:Aneroid sphygmomanometer, elderly, handgrip strength, Jamar dynamometer [IJIHS. 2016;4(2):47–55]
pISSN: 2302-1381; eISSN: 2338-4506; http://dx.doi.org/10.15850/ijihs.v4n2.832
Received: November 2, 2015
Revised:
July 17, 2016
Accepted: August 3, 2016
Correspondence:
Akhmad Yahin, Department of Physical Medicine and Rehabilitation, Faculty of Medicine, Universitas Padjajaran-Dr. Hasan Sadikin General Hospital
Introduction
Ageing is as a gradual changing process in adults from healthy to weaker condition caused by decreased physiology system ability in the body.1 The physiological changes do
not only influence the physical performances
but also the physical functions and responses in performing daily life. Several distinctive changes in body systems caused by the ageing
process are significant decreased of muscle
mass and muscle strength.
Muscle strength in elderly is associated with several functional abilities.2 Functional
abilities in elderly are defined as the abilities in
performing daily activities integrated to their
environments. The minor muscle weakness disturbs daily activities and decreases the quality of life.3 Muscle strength measurement
can be performed as well as measuring the handgrip strength.
Hands are particularly used to grasp any object. There are three steps in grasping:
open the hand, close the fingers to grasp the
object, and control the grip power.4 The study
also described two types of grip movements, power grip and prehension grip. The power grip needs maximal power such as grasping a
hammer and picking a rope bag with fingers in the half maximum flexion position while the
palm and the thumb are on the opposite side. The prehension grip requires main function of the hand such as grasping a cone-shaped object.
health problems and increased mortality risks.5
The handgrip strength can be measured by
using a specific medical apparatus, a handgrip
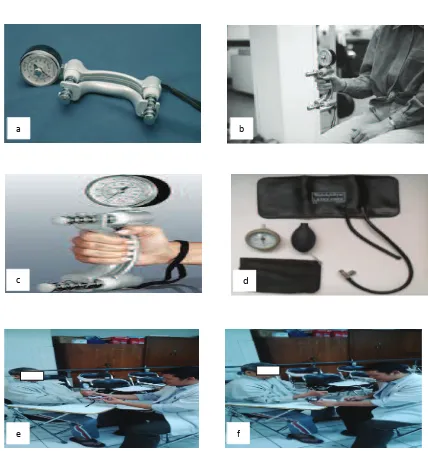
dynamometer. One of most used handgrip dynamometers with a typical hydraulic system is namely Jamar dynamometer as described in this study (Fig. 1a, b, c). Alternatively, handgrip
strength can be measured using another apparatus, it is aneroid sphygmomanometer (Fig. 1d). Aneroid sphygmomanometer is an apparatus to measure blood pressure becoming the gold standard in blood pressure measurement.6–8
This study aimed to measure the handgrip strength in elderly. The study was initiated to
Handgrip Jamar Dynamometer, 1a.10 1b, Body Position in Grasping Jamar Dynamometer.16 1c, Hand Position in Grasping Jamar Dynamometer.16 1d, Aneroid Sphygmomanometer.17 1e, The Subject Handgrip Strength was Measured Using Jamar Dinamometer. 1f, The Subject Handgrip Strength was Measured Using aneroid Sphygmomanometer
Fig. 1
a b
c
e f
estimate the prediction formula to measure the handgrip strength by using aneroid sphygmomanometer and Jamar dynamometer. The prediction formula becomes the most effective effort to measure elderly handgrip strength.
Methods
This study was conducted at the Department of Physical Medicine and Rehabilitation, Faculty of Medicine, Universitas
Padjadjaran-Dr. Hasan Sadikin General Hospital in March–
April 2015. This study was approved by the Health Research Ethic Committee, Faculty of Medicine, Universitas Padjadjaran with ethic number: LB.04.01/A05/EC/093/IV/2015.
The subjects of this study were patients who attended Physical Medicine and Rehabilitation Polyclinic, Dr. Hasan Sadikin General Hospital, Bandung who met the inclusion and exclusion
criteria. The inclusion criteria were aged 60– 74 years, able to comprehend the instructions
with mini mental status examination (MMSE)
score ≥24, cooperative and willing to be
included in the study. The exclusion criteria were patients with sensibility and deformity problems in their upper body.
35 healthy elderly (13 males and 22 females) and calculated by consecutive sampling. All subjects lived in Bandung, Indonesia, and willing to be included in the study after signing the informed consent.
The subjects were recruited based on their medical records and physical characteristics, including subject body weight and height. Hand length was measured from the distal
ulnar wrist crease to the end of middle finger while the hand and all the fingers opened.
Hand width was measured from the distal palmar crease to the radial distal palmar crease while the hand was on straight position. Then, the subjects were instructed to grasp a cone-shaped object while the thumb met the middle
finger to measure the handgrip diameter.
The subject handgrip strength was measured using Jamar Hydrolic hand dynamometer type J00105 (Lafayette Instrument Company, Sagamore Parkway North, Lafayette, USA) and One Med Aneroid Sphymomanometer type T-200 (PT. Jayamas Medica Industri, Sidoarjo, Indonesia) with participants seated,
90 degrees elbow flexion (Fig 1e). Value of
handgrip strength was displayed on the screen in kilogram meter. The right and left handgrip strengths were measured three times. Between each measurement took 5 minutes
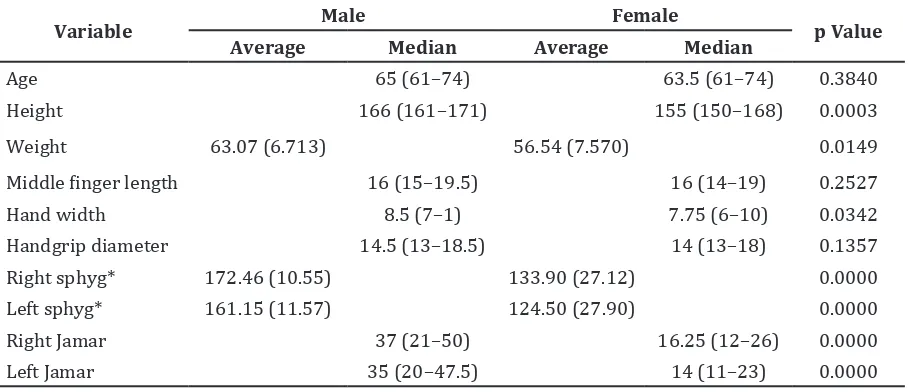
Table 1 Subject Characteristics
Variable Male Female p Value
Average Median Average Median
Age 65 (61–74) 63.5 (61–74) 0.3840
Height 166 (161–171) 155 (150–168) 0.0003
Weight 63.07 (6.713) 56.54 (7.570) 0.0149
Middle finger length 16 (15–19.5) 16 (14–19) 0.2527
Hand width 8.5 (7–1) 7.75 (6–10) 0.0342
Handgrip diameter 14.5 (13–18.5) 14 (13–18) 0.1357
Right sphyg* 172.46 (10.55) 133.90 (27.12) 0.0000
Left sphyg* 161.15 (11.57) 124.50 (27.90) 0.0000
Right Jamar 37 (21–50) 16.25 (12–26) 0.0000
Left Jamar 35 (20–47.5) 14 (11–23) 0.0000
Notes
from the mean value after three trials.
The subject handgrip strength was then measured using aneroid sphygmomanometer (Fig. 1d). Several instructions were asked to all subjects to grasp the rolled cuff with
the wrist in neutral position. The aneroid sphygmomanometer level should be adjusted to 20 mmHg. The right and left handgrip strengths were measured three times with 5 minutes rests for each measurement. The
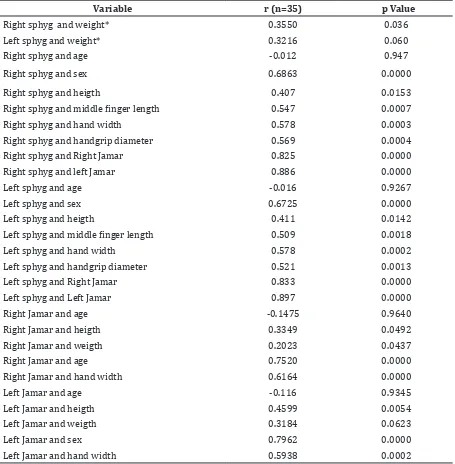
Table 2 Multivariable Correlation Test to Handgrip Strength Value
Variable r (n=35) p Value
Right sphyg and weight* 0.3550 0.036
Left sphyg and weight* 0.3216 0.060
Right sphyg and age -0.012 0.947
Right sphyg and sex 0.6863 0.0000
Right sphyg and heigth 0.407 0.0153
Right sphyg and middle finger length 0.547 0.0007
Right sphyg and hand width 0.578 0.0003
Right sphyg and handgrip diameter 0.569 0.0004
Right sphyg and Right Jamar 0.825 0.0000
Right sphyg and left Jamar 0.886 0.0000
Left sphyg and age -0.016 0.9267
Left sphyg and sex 0.6725 0.0000
Left sphyg and heigth 0.411 0.0142
Left sphyg and middle finger length 0.509 0.0018
Left sphyg and hand width 0.578 0.0002
Left sphyg and handgrip diameter 0.521 0.0013
Left sphyg and Right Jamar 0.833 0.0000
Left sphyg and Left Jamar 0.897 0.0000
Right Jamar and age -0.1475 0.9640
Right Jamar and heigth 0.3349 0.0492
Right Jamar and weigth 0.2023 0.0437
Right Jamar and age 0.7520 0.0000
Right Jamar and hand width 0.6164 0.0000
Left Jamar and age -0.116 0.9345
Left Jamar and heigth 0.4599 0.0054
Left Jamar and weigth 0.3184 0.0623
Left Jamar and sex 0.7962 0.0000
Left Jamar and hand width 0.5938 0.0002
Notes
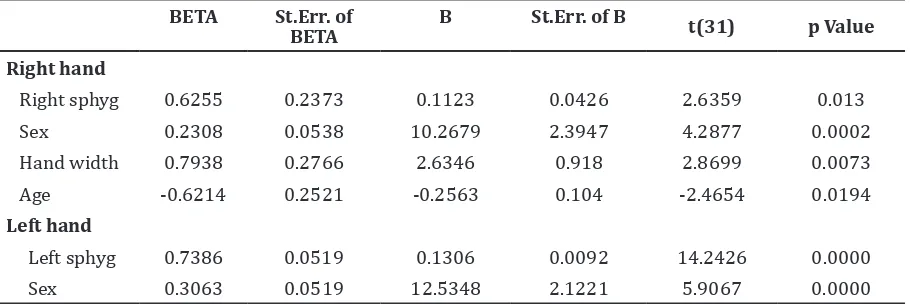
Table 3 Coefficient Regression Analysis and p Value to Measure Right Handgrip Strength
Using Jamar Dynamometer
BETA St.Err. of BETA
B St.Err. of B t(31) p Value
Right hand
Right sphyg 0.6255 0.2373 0.1123 0.0426 2.6359 0.013
Sex 0.2308 0.0538 10.2679 2.3947 4.2877 0.0002
Hand width 0.7938 0.2766 2.6346 0.918 2.8699 0.0073
Age -0.6214 0.2521 -0.2563 0.104 -2.4654 0.0194
Left hand
Left sphyg 0.7386 0.0519 0.1306 0.0092 14.2426 0.0000 Sex 0.3063 0.0519 12.5348 2.1221 5.9067 0.0000
Notes
Right sphyg = Right handgrip strength measurement using aneroid sphygmomanometer Left sphyg = Left handgrip strength measurement using aneroid sphygmomanometer
value after three times trials were taken. This was an observational study using correlational test and also cross-sectional analysis to examine the prediction formula to measure the handgrip strength using aneroid sphygmomanometer. The results were conversion formula from the measurement values using aneroid sphygmomanometer compared to the measurement values using Jamar dynamometer due to estimate the handgrip strength. This study analyzed two variables, dependent and independent variables.
The dependent variable was measurement values using Jamar dynamometer, while the independent variable was the measurement values using aneroid sphygmomanometer and hand anthropometry results (hand length, width, and diameter).
The two variables were examined using Spearman and Pearson correlation tests, however, the examination depended on the data distribution. The simple linear regression and multiregression analyses were peformed by adding hand anthropometry results and sex as additional independent variables (dummy variables).
Shapiro Wilk test was performed due to the total subjects were <50. The results showed that the subject characteristics such as weight and right and left handgrip strength values using aneroid sphygmomanometer were normally distributed. The t test was performed
female subjects’ characteristics. Non normally distribution were found in age, height, middle
finger length, hand width, handgrip diameter,
and right and left handgrip strength values using aneroid sphygmomanometer. Mann Whitney test was performed to analyze the comparison between male and female subjects’ characteristics.
The data were the handgrip strength measurement values using Jamar dynamometer and aneroid sphygmomanometer. Then, values were combined with the anthropometry results. The combination generated the conversion formula of handgrip strength measurement using aneroid sphygmomanometer.
Results
Thirty five healthy participants, 13 males and
22 females, were assesed for eligibility and performed all measurement with the same method to collected all data (Fig. 2). This study analyzed the subject characteristics compared to handgrip strength measurement values. Statistical examination using t-test
showed significant difference between subject
characteristics, including weights (p=0.0149), handgrip strength values using aneroid sphygmomanometer on right (p=0.0000) and left (p=0.0000) hands (Table 1).
Significant differences were found using
and handgrip strength values using Jamar dynamometer on right (p=0.0000) and left
(p=0.0000) hands. No significant difference
was found using Mann Whitney test in analyzing male and female subjects in age
(p=0.3840), middle finger length (p=0.2527), and handgrip diameter (p=0.1375).
The correlation analysis was performed between the measurement values using Jamar dynamometer and the measurement values using aneroid sphygmomanometer compared to the variables (Table 2). The multivariable correlation test was performed using Spearman correlation test to analyze the normal distributed data, while the Pearson correlation test was used to analyze the
non-distributed data. A significant correlation
was found in the related variables, except the age variable when compared to the handgip strength measurement values using aneroid sphygmomanometer and Jamar dynamometer (Table 2). The correlational analysis among the variables resulted different correlation values. The correlational test between ages and the handgip strength measurement values using aneroid sphygmomanometer and Jamar dynamometer were not considered statistically
significant. The correlational test between
weights and handgrip strength measurement values using aneroid sphygmomanometer and Jamar dynamometer of right and left hands
was not considered statistically significant (r=0.2–0.4).
The correlation test between the subject
height, middle finger length, and hand width
compared to the handgip strength measurement values using aneroid sphygmomanometer and Jamar dynamometer of right and left hands were considered statistically moderate
(r=0.4–0.6). The correlation test between sex
and the handgip strength measurement values using aneroid sphygmomanometer and Jamar dynamometer of right and left hands was
considered statistically significant (r=0.6–0.8).
A regression test were performed between handgip strength measurement values using Jamar dynamometer and several variables, including right handgip strength aneroid sphygmomanometer measurement values, sex, hand width, dan age (Table 3). The results revealed that the related variables
might influence significantly compared to the
right handgrip strength Jamar dynamometer measurement values. The results showed that the left handgip strength measurement values using aneroid sphygmomanometer and sex
influenced significantly different compared
to left handgip strength Jamar dynamometer measurement values (p <0.05) (Table 3).
To generate the regression analysis,
residual test was performed to find the
residual mean and residual distribution.
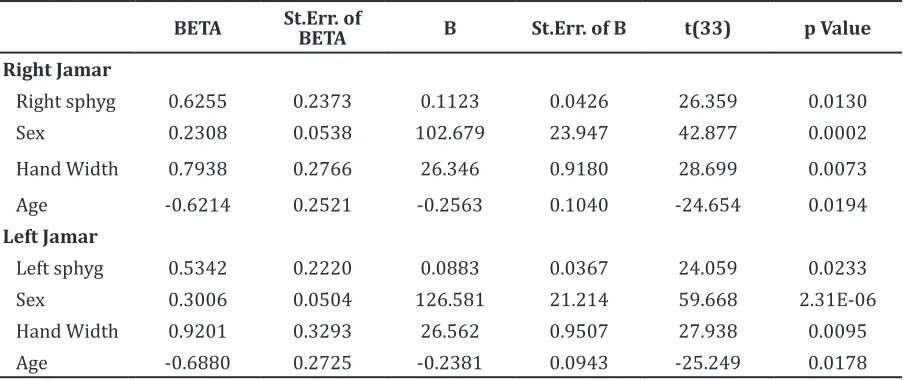
Flowchart of Patient Recruitment Fig. 2
Enrollment Assessed for eligibility (n=35)
Excluded (n=0)
•Not meeting inclusion criteria (n=0)
•Declined to participate (n=0)
•Other reasons (n=0)
Allocation
Measurement
•Body weight and height
•Hand width, length and diameter
Measuring handgrip using Jamar Dynamometer
Measuring handgrip using aneroid sphymomanometer
Analysis
Analyzed (n=35)
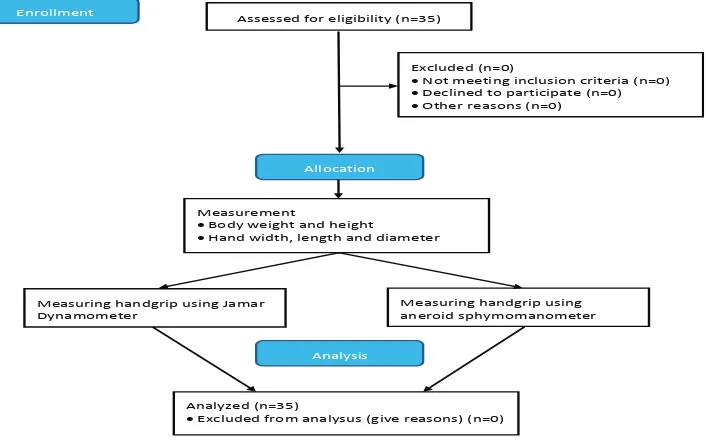
Table 4 Coefficient Regression Analysis and p Value to Measure Right and Left Handgrip
Strength Using Jamar Dynamometer
BETA St.Err. of BETA B St.Err. of B t(33) p Value
Right Jamar
Right sphyg 0.6255 0.2373 0.1123 0.0426 26.359 0.0130
Sex 0.2308 0.0538 102.679 23.947 42.877 0.0002
Hand Width 0.7938 0.2766 26.346 0.9180 28.699 0.0073
Age -0.6214 0.2521 -0.2563 0.1040 -24.654 0.0194
Left Jamar
Left sphyg 0.5342 0.2220 0.0883 0.0367 24.059 0.0233
Sex 0.3006 0.0504 126.581 21.214 59.668 2.31E-06 Hand Width 0.9201 0.3293 26.562 0.9507 27.938 0.0095
Age -0.6880 0.2725 -0.2381 0.0943 -25.249 0.0178
Notes
Right Sphyg = Right handgrip strength measurement using aneroid sphygmomanometer Left Sphyg = Left handgrip strength measurement using aneroid sphygmomanometer Right Jamar = Right handgrip strength measurement using Jamar dynamometer Left Jamar = Left handgrip strength measurement using Jamar dynamometer
Therefore, the residual mean was considered
statistically significant. The t-test was
performed to examine the residual value = 0,
and the value was 15.79 (p value >0.05). The
value was not considered valid to generate the handgrip strength prediction formula. The invalid value determined that further analyses should be performed. The error was caused by the presence of outlier data. There were four data which were considered invalid because of higher values.
The outlier data were not included in the subsequence regression analysis. The results
showed a new coefficiet regression table to
measure the handgrip strength values of left hand using Jamar dynamometer (Table 4).
The handgip strength using aneroid sphygmomanometer values of right and left
hands, sex, hand width, dan age influenced significantly compared to the handgrip
strength Jamar dynamometer measurement values of right hand.
After eliminating the outlier data, the
coefficient regression results showed handgrip
strength using aneroid sphygmomanometer values of left hand, sex, hand width, dan age
influenced significantly compared to the
handgrip strength Jamar dynamometer values
After generating the new coefficient
regression analysis in several variables, new residual test was performed to discover residual mean and residual distribution. Then, the residual test results were found after eliminating the outlier data.
Normality test using Saphiro Wilk showed that the residue distributed normally and resulted the mean=0 and p value was 0.0000. It reveals that the regression analysis results could be generated to predict the handgrip strength values using Jamar dynamometer.
Based on regression analysis, the prediction formula resulted the handgrip strength values using aneroid sphygmomanometer (Table 4). The handgrip strength could be measured by using prediction formula.
Right Handgrip Strength Prediction Formula:
Left Handgrip Strength Prediction Formula:
Data were statistically examined and
0.0854 x right SPHYG +(11.5642 x SEX (Female =0, Male =1)) + 3.4243 x Hand width – 0.2951 x Age
prediction formula. The prediction formula were appropriately used to measure the handgrip strength in elderly.
Discussion
Handgrip strength is one of main factors related to hand functions. Several studies
stated that there were many factors influence
the handgrip strength such as age, race, hand domination, height, weight, and hand anthropometry.5,8,9
Participants in this study could understand the instruction during the test (MMSE score more than 24). All subjects in this study had similar hand characteristics which meant male
and female subjects were not significantly different. The hand middle finger lengths in
male and female subjects had the same median (16 cm) and handgrip diameters (14 cm) with the same average values. In this study, hand antrhopometry values were lower than the previous study.10 In literatures stated that
hand middle finger length were 18 cm in males
and 16 cm in females while the handgrip diameters were 15 cm in male subjects and 14 cm in female.
It showed that handgip strength values using aneroid sphygmomanometer and Jamar dynamometer of right and left hands were
considered significantly different (Table 1).
The handgrip strength of right hand were
stronger than left hand. This study finds the
total subjects had stronger and more dominant right hands.
In correlation analysis between related variables and the handgip strength values using aneroid sphygmomanometer and Jamar dynamometer showed positive correlation, except age variable. The age variable caused negative correlation that showed the opposite value compared to the handgip strength values using aneroid sphygmomanometer and Jamar dynamometer. The results were similar to the previous studies which reported that
the handgrip strength was influenced by the
subject age.2,5
The correlation analysis between the handgip strength values using aneroid sphygmomanometer and Jamar dynamometer and age was not considered statistically
significant because the subject average age was 60–70 years old. The results reveals that there was no significant correlation between the
handgrip strength values and age. This study was different from the previous study which
stated that no significant correlation between
age and handgip strength measurement values.11
In correlation analysis between weight and height compared to the handgip strength values using aneroid sphygmomanometer and Jamar dynamometer were not considered
statistically significant. The results were
similar to the previous studies which revealed
that weight was not the only factor influenced
the handgrip strength values.10–12 Other factors
that will influence the handgrip strength
values were height and body mass index (BMI). However, this study was in agreement with
the previous study which reported significant
results between the handgip strength values using aneroid sphygmomanometer and Jamar dynamometer.7 The significant results were caused by the same handgip strength measurement movements between aneroid sphygmomanometer and Jamar dynamometer.
Regression test revealed that handgrip
strength was influenced by sex. In the handgrip
strength prediction formula, the different
coefficient results between male and female
subjects revealed that males are stronger than females.
A study reported that males had stronger handgrip than females.13 This different
handgrip strength between males and females was caused by the muscle mass. Regression test in several variables and p value revealed
that hand width significantly influenced
handgrip strength values (Table 4). The results were similar to the previous study which
stated that significant correlation was found
between hand anthropometry and handgrip strength measurement values.7,8,15 The studies described that an individual with wider hand had higher handgrip strength values.
The limitation of this study is in handgrip strength prediction formula. The prediction formula in this study can only be used to
measure handgrip strength in 60–74 years
References
1. Dietzel R, Felsenberg D, Armbrecht G. Mechanography performance tests and their association with sarcopenia, falls and impairment in the activities of daily living-a pilot cross-sectional study in 293 older adults. J Musculoskelet Neuronal Interact.
2015;15(3):249–56.
2. Teimoori A, Kordi MR, Choobine S, Heidari B. The effects of aging on muscle strength and functional ability of healthy iranian males. WJ
Sport Sci. 2009;2(2):261–5.
3. Lum PS, Mulroy S, Amdur RL, Requejo P, Prilutsky BI, Dromerick AW. Gains in upper extremity function after stroke via recovery or compensation. Top Stroke Rehabil.
2009;16(4):237–53.
4. Perez MA, Rothwell JC. Distinct influence of hand posture on cortical activity during human
grasping. J Neurosci. 2015;25(12):4882–9.
5. Ling CH, Taekema D, de Craen AJ, Gussekloo J, Westendorp RG, Maier AB. Handgrip strength and mortality in the oldest old population: the
Leiden 85-plus study. CMAJ. 2010;182(5):429–
36.
6. Ma Y, Temprosa M, Fowler S, Prineas RJ, Montez MG, Brown-Friday J, et al. Evaluating the accuracy of an aneroid sphygmomanometer in a clinical trial setting. Am J Hypertens.
2009;22(3):263–6.
7. Hamilton GF, McDonald C, Chenier TC. Measurement of grip strength: validity and reliability of the sphygmomanometer and jamar grip dynamometer. J Orthop Sports Phys
Ther. 1992;16(5):215–9.
8. Fallahi AA, Jadidian AA. The effect of hand dimensions, hand shape and some anthropometric characteristics on handgrip strength in male grip athletes and non-athletes.
J Hum Kinet. 2011;29:151–9.
9. Kamarul T, Ahmad TS, Loh WY. Hand grip strength in the adult Malaysian population. J
Orthop Surg (Hong Kong). 2006;14(2):172–7.
10. Chuan TK, Hartono M, Kumar N. Anthropometry of the Singaporean and Indonesian populations.
Int J Indust Ergonom. 2010;40(6):757–66.
11. Spruit MA, Sillen MJ, Groenen MT, Wouters EF, Franssen FM. New normative values for handgrip strength: results from the UK Biobank.
J Am Med Dir Assoc. 2013;14(10):5–11.
12. Koley S, Kaur SP. Correlations of handgrip strength with selected hand-arm-anthropometric variables in Indian inter-university female volleyball players. Asian J
Sports Med. 2011;2(4):220–6.
13. Putrawan IBP, Kuswardhani RAT. Faktor-faktor yang menentukan kekuatan genggam tangan pada pasien lanjut usia di panti wredha tangtu dan Poliklinik Geriatri RSUP Sanglah Bali. J
Peny Dalam. 2011;12(2):87–91.
14. Park SW, Goodpaster BH, Strotmeyer ES, de Rekeneire N, Harris TB, Schwartz AV, et al. Decreased muscle strength and quality in older adults with type 2 diabetes: the health, aging, and body composition study. Diabetes.
2006;55(6):1813–8.
15. Mandahawi N, Imrhan S, Al-Shobakia S, Sarder B. Hand anthropometry survey for the Jordanian population. Int J Indust Ergonom.
2008;38(11):966–76.
16. Susan L. Michlovitz. Principles of hand theraphy. In: hand surgery. 1st ed. Philadelphia: Lippincott Williams & Wilkins; 2004.
17. Souza LA, Martins JC, Moura JB, Teixeira-Salmela LF, De Paula FV, Faria CD. Assessment
of muscular strength with the modified
sphygmomanometer test: what is the best method and source of outcome values? Braz J