Full Terms & Conditions of access and use can be found at
http://www.tandfonline.com/action/journalInformation?journalCode=vjeb20
Download by: [Universitas Maritim Raja Ali Haji] Date: 11 January 2016, At: 20:49
Journal of Education for Business
ISSN: 0883-2323 (Print) 1940-3356 (Online) Journal homepage: http://www.tandfonline.com/loi/vjeb20
Classroom Versus Online Assessment
Michael F. Spivey & Jeffrey J. McMillan
To cite this article: Michael F. Spivey & Jeffrey J. McMillan (2014) Classroom Versus Online Assessment, Journal of Education for Business, 89:8, 450-456, DOI: 10.1080/08832323.2014.937676
To link to this article: http://dx.doi.org/10.1080/08832323.2014.937676
Published online: 04 Nov 2014.
Submit your article to this journal
Article views: 217
View related articles
Classroom Versus Online Assessment
Michael F. Spivey and Jeffrey J. McMillan
Clemson University, Clemson, South Carolina, USAThe authors examined students’ effort and performance using online versus traditional classroom testing procedures. The instructor and instructional methodology were the same in different sections of an introductory finance class. Only the procedure in which students were tested—online versus in the classroom—differed. The authors measured student effort by tracking the number of times students accessed study resources that had been placed on the university Blackboard course management system, and performance as grades on tests given either online for some students or in the classroom for other students. The results indicate that neither study efforts nor course performance was influenced by the testing procedure. However, the authors did find a strong positive relationship between students’ effort and their performance in the course.
Keywords: online assessment, online testing, student effort, student performance
The implementation of online study and assessment resour-ces has grown sharply during the past decade (Zuckweiler, 2012). Online assessment (i.e., testing) can provide several benefits not afforded by conventional paper-and-pencil test-ing. First, online assessment allows the offering of flexible testing times and the periods of time in which the test may be worked on. Second, online resources can be set to auto-matically randomize the order of questions and randomize the set of answers provided for multiple-choice and match-ing questions. Third, online tools allow instructors to offer students the opportunity to rework the same or equivalent questions multiple times. Fourth, varying degrees of feed-back such as test score, test score with correct answers, or test score with detailed solutions may be provided. In addi-tion, instructors have control of when feedback is given (e.g., immediately, after all questions are completed, set to a specific date and time). Fifth, desired online testing systems can be set to provide hints or prompts as to where help to answer a question can be found in the text or course notes.
Based on their review of the literature DeSouza and Fleming (2003) argued that too few instructors are realizing the full instructional potential of web-based assessment resources. In addition they point out that empirical research comparing the effectiveness of web-based assessment with traditional paper-and-pencil testing was very limited with
regard to research directly comparing students learning in a traditional classroom versus those who take the course online. Schmidt (2011), Ledman (2008), and Neuhauser (2002) found no significant differences in test scores or final course grades between courses offered online versus in the classroom. All three studies compared the grade perfor-mance of students in traditional face-to-face lecture sections versus online sections of the same course. The testing for-mat used in each study was the same for the online and the traditional face-to-face lecture classes—exams were open book and submitted to each student via email and returned in the same way to the instructor. Thus, their studies inves-tigated the effect of online versus face-to-face content delivery using the same testing procedure for both groups.
A logical research question that comes to mind from the line of research described above is whether different testing procedures affect the level of study effort students put forth during a semester as well as the grades they earn. One might hypothesize that students who knew they would not be not be proctored when being tested online would rely on open book and notes and would not put forth as much study effort as students who knew they would be tested in a proc-tored, closed-book environment. Alternatively, it could be hypothesized that students who could rely on open book and notes when being tested would have an advantage and should do better than students who are being tested in a proctored, closed-book situation. Accordingly, the major purpose of this study was to investigate whether students study efforts and course performance were affected by Correspondence should be addressed to Jeffrey J. McMillan, Clemson
University, School of Accountancy and Finance, 300 Sirrine Hall, Clem-son, SC 29634, USA. E-mail: [email protected]
ISSN: 0883-2323 print / 1940-3356 online DOI: 10.1080/08832323.2014.937676
whether they took the tests online or if they took traditional paper-and-pencil classroom tests.
The remainder of the article is organized as follows. We first describe the primary instructional delivery method, the different testing methods, and the data collected. Then, we present the empirical analysis and results. Last, we conclude with our summary and suggestions for future research.
INSTRUCTIONAL DELIVERY, TESTING METHODS, AND DATA
The primary means of content delivery for the classes from which our data was drawn was online via our university’s Blackboard course management system.1 Study resources were specifically designed to accompany and supplement an assigned course text and selected readings on current issues. These study resources were produced by authors and con-sisted of instructor-produced and -recorded PowerPoint lec-tures using Adobe Presenter, recorded instructor calculator entry lectures, and recorded excel spreadsheet lectures using Adobe Captivate. These recorded materials could only be viewed online (i.e., they were packaged files with sound that could not be downloaded and printed). Care was taken to make sure that the recorded lecture materials clearly empha-sized the conceptual issues and computational problem solv-ing that would be addressed in course tests.
For some students, testing was done online. Students could take the test from anywhere in the world and were not proctored enabling open access to their text and notes. For others, testing was traditional paper-and-pencil exams proctored in the classroom, and was closed-book.2 Regard-less of the testing procedure they were under, students were given the same amount of time to take the tests (90 min) and the Blackboard course management system was used as the primary method to deliver course content and to mea-sure students’ effort.
We collected data on a sample of 174 students enrolled in different sections of an upper level finance course taught by the same instructor at a major university in the South-eastern United States. The syllabi provided a detailed out-line of the concepts and materials that were to be covered for each of the four tests given during the semester. The tests were equally weighted and were administered on an evenly spaced schedule throughout the semester. Course content and study resources were delivered primarily online in the same manner to all sections. Through the Blackboard system, we were able to observe when and how often stu-dents viewed each of the recorded materials over the course of the semester. We tracked the number of times each of these study resources that were relevant for the upcoming test was viewed by each student. We used two different study period measures. First, we tracked how many times each student viewed the resources for each test from the day following the previous test (or start of semester with
test 1) and the date of the test. This time period was roughly 25–30 days for each of the four tests. We also used the number of views the 10 days prior to each test as a second measure of the study period. Ten days prior might be viewed as a more realistic study period. Although the Blackboard tracking feature does not provide information concerning how long a resource was observed with each viewing, we believe keeping track of the number of times students access these resources does provide useful infor-mation concerning students’ study habits.
As control variables, we included information available on each student that reflected common characteristics and that have been utilized in prior investigations of student effort and performance. Characteristics available for our study included cumulative grade point average (GPA), aca-demic classification (i.e., senior, junior, sophomore, fresh-man), and major, gender and the current semester course load. Contradictory results have been reported for the effect of gender on academic performance for students in business courses. While investigating performance in introductory business courses, Terry (2002) and Borde, Byrd, and Mod-ani (1988) found that male students significantly outper-formed the female students. However, when Johnson, Joyce, and Sen (2002) took effort into account, there was no significant difference between male and female perfor-mance. Cumulative GPA has been found to have a highly significant positive relationship with course performance in most previous studies while academic class (a possible proxy for maturity of the student), semester course load, and academic major have not shown a consistent pattern in regard to their relationship with course performance.
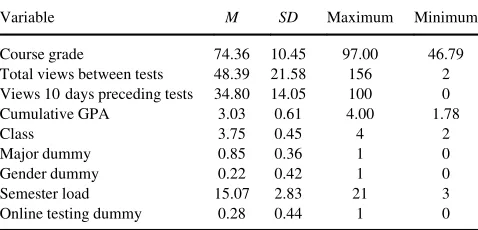
Table 1 presents descriptive statistics for our sample. The course grade is the numeric average of the four tests taken over the semester. The mean grade was 74.36 and ranged from a low of 43.79 to a high of 97.00. Total views of the course resources between tests over the semester averaged 48.39 (minimum was 2 and maximum was 156). The sum of the number of views over the 10 days preceding each test for the semester averaged 34.80 (minimum was 0 and the maximum was 100). From these numbers, roughly 72% (34.80 of 46.79) of the total views occurred during the
TABLE 1
Descriptive Statistics for the Sample of 174 Students
Variable M SD Maximum Minimum
Course grade 74.36 10.45 97.00 46.79 Total views between tests 48.39 21.58 156 2 Views 10 days preceding tests 34.80 14.05 100 0 Cumulative GPA 3.03 0.61 4.00 1.78
Class 3.75 0.45 4 2
Major dummy 0.85 0.36 1 0
Gender dummy 0.22 0.42 1 0
Semester load 15.07 2.83 21 3
Online testing dummy 0.28 0.44 1 0 CLASSROOM VERSUS ONLINE ASSESSMENT 451
TABLE 2 Pearson Correlation Matrix
Course grade Total views Prior 10 days views
Cumulative grade
point average Class Major dummy Gender dummy Semester load
Variable Coefficient p Coefficient p Coefficient p Coefficient p Coefficient p Coefficient p Coefficient p Coefficient p
Total views .297 .001
Prior 10 days views .265 .001 .831 .001
Cumulative grade point average .736 .001 .251 .001 .195 .010
Class ¡.125 .100 ¡.057 .451 ¡.090 .236 ¡.112 .142
Major dummy ¡.118 .119 ¡.099 .190 ¡.070 .357 ¡.187 .014 ¡.129 .091
Gender dummy ¡.017 .821 .060 .429 ¡.082 .281 .036 .635 .057 .452 .147 .102
Semester load ¡.030 .693 ¡.125 .100 ¡.088 .245 .023 .766 ¡.026 .733 .245 .001 ¡.121 .110
Online testing dummy ¡.026 .724 ¡.032 .674 ¡.030 .692 ¡.113 .137 .090 .239 ¡.066 .388 ¡.054 .477 .107 .161
ten days preceding each test. The cumulative GPA averaged 3.03 with a minimum of 1.78 and a maximum of 4.00 of a 4.00 grading scale. Most of the students were seniors (class
D4) with only one sophomore (classD2). Accounting and
finance majors were grouped together (major dummyD1)
and made up 85% of the classes. All other majors (major dummy D 0) accounted for only 15%. Female students
(gender dummyD1) represented 22% of the classes. The
credit hours being taken during the semester (semester load) averaged 15.07 hr with a minimum of 3 hr and a max-imum of 21 hr. Students taking the tests online (online test-ing dummyD1) comprised 28% of the sample.
RESULTS
Table 2 presents the Pearson correlation coefficients for the variables used in the study.
The course grade was significantly positively correlated (pD.001) with the total views of the online study resources. We also saw a significantly positive correlation (p D.001) between the course grade and the number of views the 10 days prior to each test. There was a strong positive corre-lation (pD.001) between the course grade and the students’ cumulative GPA. In addition, both total views (pD.001) and
the number of views the 10 days prior to each test (pD.001)
were significantly positively correlated with the student’s cumulative GPA. Thus, on average, students who did well in other courses did well in the class and students with higher GPAs put forth more study effort. Neither course grade nor study effort showed any significant correlation with the student’s academic class, major, gender, or semester load.3
Focusing on the testing procedure, the online testing dummy was not significantly correlated with either the students’ course grade or the student’s study efforts (as measured by the viewing measures). This finding provides evidence that neither study efforts nor course performance was influenced by the testing procedure. Students taking the exam online did not demonstrate significantly less study effort (i.e., fewer views) or better performance (i.e., higher grades) because they might have had access to their text and notes during testing than students taking traditional closed-book paper-and-pencil exams.
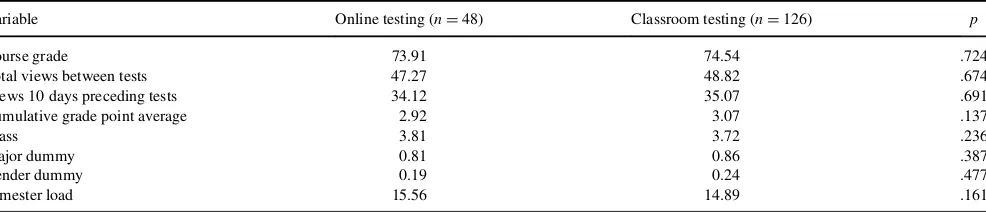
Table 3 compares the means of the variables used in our study for online versus traditional classroom testing. Thep
values for significance of the t-tests comparing the means are also given. The mean course grade for those taking the tests online was 73.91 and the mean for those taking the tests in the classroom was 74.5. The online test takers scored only 0.63 less than the in-class test takers andpvalue for thet-test (pD.724) indicates that the difference between the two testing procedures was not statistically significant.
TABLE 3
Comparison of Means for Online Versus Classroom Testing
Variable Online testing (nD48) Classroom testing (nD126) p
Course grade 73.91 74.54 .724
Total views between tests 47.27 48.82 .674
Views 10 days preceding tests 34.12 35.07 .691
Cumulative grade point average 2.92 3.07 .137
Class 3.81 3.72 .236
Major dummy 0.81 0.86 .387
Gender dummy 0.19 0.24 .477
Semester load 15.56 14.89 .161
Note: pvalues indicate statistical significance of differences in means.
TABLE 4
Ordinary Least Squares Regression of Study Efforts
Regression 1 (nD174) Regression 2 (nD174)
Variable Coefficient p Coefficient p
Intercept 44.902 .022 44.837 .022
Cumulative grade point average 8.496 .001 8.548 .002
Class ¡1.971 .587 ¡2.009 .582
Major dummy ¡2.305 .635 ¡2.226 .648
Gender dummy 2.343 .552 2.355 .551
Semester load ¡0.891 .134 ¡0.903 .133
Online dummy 0.564 .877
Note:Study efforts utilizes total views over the semester as the measure of effort. For (1),R2
D.0841. For (2),R2D.0842.
CLASSROOM VERSUS ONLINE ASSESSMENT 453
The mean total views for students who took the tests online was 47.27 and the mean for students who took the tests in the classroom was 48.82. Thus, the students who took tests online versus in the class had only 1.55 less views and the
pvalue for thet-test (pD.674) indicates that the difference between the two testing procedures was not statistically sig-nificant. The other measure of student study effort (views 10 days preceding tests) was also not significantly different across the two groups. Comparison of all the control varia-bles across the two group yield insignificant differences.
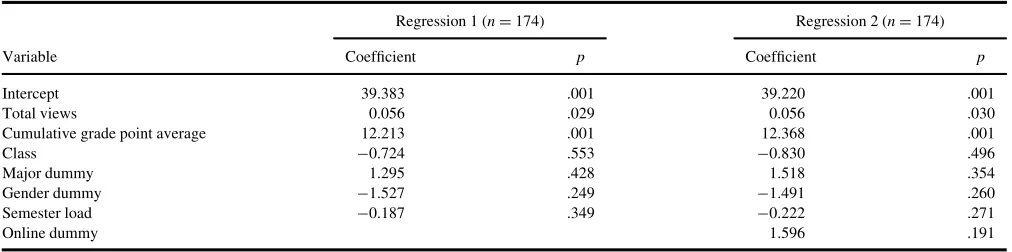
Table 4 presents a multivariate regression analysis ana-lyzing students’ study efforts and Table 5 shows course per-formance for online versus classroom testing.4 In Table 4, we first regressed total views between tests over the semes-ter against our control variables in regression 2 and then added our online dummy variable in regression 2. In Table 5, we first regressed course grade against total views between tests and our control variables in regression 1 and then added our online dummy variable in regression 2. The results for the online testing dummy were consistent with the findings in Tables 2 and 3. In Panel A, the coefficient is not statistically significant (pD.877).5In Table 5, the coef-ficient for the online testing dummy was also not statisti-cally significant (p D .191). Thus, our results indicate that neither students’ study efforts nor their course performance differed when they were tested online versus conventional in-class testing, ceteris paribus. Consistent with the findings presented in Table 2, the cumulative GPA was significantly positive in all four regressions. As would be expected, bet-ter students (as measured by cumulative GPA) studied more and subsequently did better in the course. None of the other control variables were significant in any of the regressions.6
SUMMARY AND CONCLUSION
The purpose of this study was to investigate whether the use of online testing as compared to traditional paper-and-pen-cil classroom testing affected students’ study efforts and
performance. We used the statistics tracking feature of the Blackboard course management system as a valid objective measure of student effort and exam percentage scores as proxies for performance. The results of our investigation revealed that students’ effort and performance did not sig-nificantly differ among different sections of the same course where the testing procedures differed.
Reflecting on our results we believe there are three fac-tors that could have had an influence on our findings. First, the contextual nature placed had a heavy computational emphasis. Material that is highly computational requires sound advance preparation in order for one to be able to produce the quick and accurate computations necessary in a timed test environment. Secondly, the course was lecture oriented with the textbook basically used as support mate-rial. Accordingly, the exams were based on the lecture materials, which were delivered as online educational resources via Blackboard as described previously. This made having access to the textbook during the exam not very helpful or trying to view recorded lectures feasible because of the limited time allotted. Third, exam questions were not basically repeated questions with just different numbers taken from homework assignments or practice exams. The students were required to apply the methods and procedures we had covered in similar but new and dif-ferent contexts on the exams. This made the opportunity to quickly locate the same question in notes during the timed exams highly unlikely.
Taken together we believe these factors suggest that when a judiciously timed exam is paired with sufficient rigor (especially when computations are required) the opportunity to benefit from an open-book testing environment is greatly mitigated. In other words, the format and rigor of our exams were such that attempting to learn (i.e., looking up answers) appears to have been of little benefit to the majority of the students in the online open-book testing environment. Whether our findings would hold for courses and exams, which have less computational weight or utilize different testing formats is an interesting avenue for future research.
TABLE 5
Ordinary Least Squares Regression of Course Performance
Regression 1 (nD174) Regression 2 (nD174)
Variable Coefficient p Coefficient p
Intercept 39.383 .001 39.220 .001
Total views 0.056 .029 0.056 .030
Cumulative grade point average 12.213 .001 12.368 .001
Class ¡0.724 .553 ¡0.830 .496
Major dummy 1.295 .428 1.518 .354
Gender dummy ¡1.527 .249 ¡1.491 .260
Semester load ¡0.187 .349 ¡0.222 .271
Online dummy 1.596 .191
Note:Course performance utilizes numeric course grade for the semester as the measure of performance. For (1),R2
D.5626. For (2),R2D.5671.
Our results do show evidence of a strong positive corre-lation between students’ study efforts and their course per-formance. We also find a strong positive correlation between both study efforts and course performance with students’ cumulative GPA. We find gender, academic class, or semester credit load to have little influence on either course performance or study effort.
Linking the findings of Nonis and Hudson (2010) and Martin (2011) with the findings of this study suggest that future research into how factors such as scheduling and the ability of students’ to concentrate can shed more light into explaining the mixed findings of prior study-time-perfor-mance research. Continued identification of specific study habits and individual characteristics that help students ignore or moderate the distractions that can manifest them-selves in online learning environments would be of great value to online educators. Furthermore, while classroom and online test takers were allotted the same overall time for each test (90 min), the specific time each student took to complete their tests was not gathered. While we did not notice a significant difference in the amount of time taken to complete tests between the testing procedures overall, future researchers should examine this issue and its possible relationship to performance.
We believe our findings may encourage some instruc-tors who are hesitant about utilizing online testing to go ahead and experiment with it. Especially, for those exams, which have a computational emphasis and where pretest questions or problems and time to complete are restricted. The potential benefits of the increased flexibility and con-venience for both students and instructors and the option of providing immediate feedback are just a few of the major advantages online testing can have over traditional in class paper-and-pencil testing. In addition, online test-ing allows for more detailed monitortest-ing of how students are doing both during and immediately after the exams are completed. This can provide instructors with more accu-rate feedback with which they can make modifications to future class coverage, assignments, or techniques. Last, online testing resources provide instructors with the ability to employ a wide variety of assessment options with differ-ent settings for feedback that may be provided. The rela-tionship between different types and combinations of assessment options and feedback options on student effort or performance is an area that could offer many rich insights into how instructors can enhance their students’ learning. If properly implemented, these advantages can be available without a loss of effort by students or grade inflation.
NOTES
1. Blackboard has evolved into the prominent online course management system for higher education. It
quite versatile and can be employed for a wide range of instructional, communication, and assessment functions. Textbook publishers also provide flexible, dynamic online interactive teaching, learning, and assessment tools. Examples include McGraw Hill’s Connect, Wiley’s Wiley Plus, Cengage’s Course Mate, and Pearson’s MyLab.
2. Students who were tested online versus tested in the classroom knew the testing method when they enrolled in the sections. There also was only one sec-tion offering online testing which made the online testing sample size smaller than the traditional testing sample size where multiple sections were offered. This lack of randomness may introduce a sample selection bias. Self-selection is most often a problem when samples are truncated (or censored), but can be present due to nonrandom sample selection. We uti-lized the technique suggested by Heckman (1979) to test for sample selection bias. Neither the coefficient of a Probit estimate (substituted for the online dummy) from a model regressing the independent variables against our online dummy nor the inverse mills ratio constructed from the estimate were signifi-cant in either the efforts regression or course perfor-mance regression. This suggests no self-selection bias was present.
3. The low correlation of the control variables suggests the explanatory variables are not correlated suffi-ciently to create a multicollinearity problem.
4. We did the analysis using panel data comparing the views each of the four test periods with the respective test grades. The findings are consistent with the reported analyses using the total views for the course and the overall course grade.
5. We also used the number of views the 10 days prior to each test as our measure of student effort. The overall findings were unchanged.
6. We also estimated our regressions with a log transfor-mation of our continuous measure of course grade as the dependent variable. As a third specification, we utilized a multinomial ordered Probit model. The dependent variable was categorized as those making an A (90–100), B (80–89), C (70–79), D (60–69), and F (<60). The key findings of the study were
unchanged.
REFERENCES
Borde, S. F., Byrd, A. K., & Modani, N. K. (1998). Determinants of student performance in introductory corporate finance courses. Journal of Financial Education,24, 23–30.
DeSouza, E., & Fleming, M. (2003). A comparison of in-class and online quizzes on student performance.Journal of Computing in Higher Edu-cation,14, 121–134.
CLASSROOM VERSUS ONLINE ASSESSMENT 455
Heckman, J. J. (1979). Sample selection bias as a specification error. Econ-ometrica,47, 153–161.
Johnson, D. L., Joyce, P., & Sen, S. (2002). An analysis of student effort and performance in the finance principles course.Journal of Applied Finance,12, 67–72.
Ledman, R. E. (2008). Comparing student learning in online and classroom formats of the same course.Developments in Business Simulation and Experiential Learning,35, 351–352.
Martin, L. R. (2011). Teaching business statistics in a computer lab: benefit or distraction?Journal of Education for Business,86, 326–331. Neuhauser, C. (2002). Learning style and effectiveness of online and
face-to-face instruction.American Journal of Distance Education,16, 99– 113.
Nonis, S., & Hudson, G. I. (2010). Performance of college students: Impact of study time and study habits.Journal of Education for Business,85, 229–238.
Pimpa, N. (2010). E-business education: A phenomenographic study of online engagement among accounting, finance, and international busi-ness students.I-Business,2, 311.
Schmidt, M. (2011, November).Lessons from teaching undergraduate finance online. Proceedings of Academy of Business Disciplines Annual Meetings, Fort Myers, FL.
Terry, A. (2002). Student performance in the introductory corporate finance course.Journal of Financial Education,28, 28–41.
Zuckweiler, K. M. (2012). Using technologies to enhance student learning in the online classroom.Decision Line: Decision Sciences Institute,43, 6–8.