Full Terms & Conditions of access and use can be found at
http://www.tandfonline.com/action/journalInformation?journalCode=cbie20
Bulletin of Indonesian Economic Studies
ISSN: 0007-4918 (Print) 1472-7234 (Online) Journal homepage: http://www.tandfonline.com/loi/cbie20
Implications for Indonesia of Asia’s Rise in the
Global Economy
Kym Anderson & Anna Strutt
To cite this article: Kym Anderson & Anna Strutt (2015) Implications for Indonesia of Asia’s Rise in the Global Economy, Bulletin of Indonesian Economic Studies, 51:1, 69-94, DOI: 10.1080/00074918.2015.1016568
To link to this article: http://dx.doi.org/10.1080/00074918.2015.1016568
Published online: 30 Mar 2015.
Submit your article to this journal
Article views: 278
View related articles
ISSN 0007-4918 print/ISSN 1472-7234 online/15/00069-26 © 2015 Indonesia Project ANU http://dx.doi.org/10.1080/00074918.2015.1016568
* The authors are grateful for comments and suggestions from seminar participants at the Arndt–Corden Department of Economics, The Australian National University, Canberra, 30 April 2013, and at the 16th Annual Conference on Global Economic Analysis, Shanghai, 12–14 June 2013. We also acknowledge helpful interactions with Tom Hertel, Terrie Walms -ley, Dominique van der Mensbrugghe, Fan Zhai, and Rob McDougall on a related paper presented at the AARES Annual Conference in Sydney, 6–8 February 2013. Thanks are also due to the anonymous referees for their very helpful comments and suggestions, and to Jayanthi Thennakoon for research assistance with igures 1a and 1b. Funding support from the Australian Research Council and the Rural Industries Research and Development Cor -poration is gratefully acknowledged. Views expressed are the authors’ alone.
IMPLICATIONS FOR INDONESIA OF
ASIA’S RISE IN THE GLOBAL ECONOMY
Kym Anderson*
University of Adelaide; The Australian National University; Centre for Economic Policy Research
Anna Strutt*
University of Waikato; University of Adelaide
This article projects Indonesia’s production and trade patterns to 2020 and 2030 in the course of global economic development under various growth and policy sce -narios. We support our projections of the global economy by employing the Global Trade Analysis Project (GTAP) model and version 8.1 of the GTAP database, along with supplementary data from a range of sources. Our baseline projection assumes that trade-related policies do not change in each region, but that endowments and real GDP do change, at exogenously selected rates. We use this baseline and its assumptions to analyse how potential global changes may affect the Indonesian economy over this and the next decade. We then consider the potential impacts of three policy reforms by 2020: an increase in global rice exports, associated with the opening of Myanmar; the recently imposed export taxes in Indonesia on un -processed primary products; and the implementation of Indonesia’s new food law.
Keywords: global economy-wide model projections, economic growth, structural change, food policy, export taxes
JEL classiication: D58, F13, F15, F17, Q17
INTRODUCTION
the low rates of recession-hit developed economies. The rapid growth of emerging economies, particularly in Asia, has shifted the global industrial centre of gravity away from the North Atlantic. It has also raised the demand for primary products in the international marketplace, consistent with the fastest growth in emerging economies being concentrated in natural-resource-poor countries such as China and India. That increased demand for primary products, in turn, has stimulated growth in demand for exports from natural-resource-rich economies, continu -ing a process that began in Japan in the 1950s, in Korea and Taiwan in the late 1960s, and then in some Southeast Asian countries (Anderson and Smith 1981). However, because the earlier, Northeast Asian group represents just 3% of the world’s population, its rapid industrial growth was accommodated by the rest of the world without much dificulty, including in primary-product markets. China and India, in contrast, account for nearly 40% of the world’s population, and so their rapid and persistent industrial output and income growth have far greater signiicance for goods markets, and, for example, for food and energy security and greenhouse-gas emissions.
How might these ongoing developments affect markets over the next two dec -ades? In this article, we focus on the potential consequences for Indonesia. We do so by irst assuming that recent growth rates continue and economic policies remain unchanged (the core scenario to 2020 and 2030), and then examining the potential economic consequences of implementing some recently announced policies. We also consider the estimated effects by 2020 of three policy reforms, one of which is external to Indonesia but of considerable policy interest none -theless: a signiicant increase in international rice-market competition that might be associated with the opening up of Myanmar’s economy (which some believe could substantially depress the international rice price). The other policies that we consider are Indonesia’s recently imposed export restrictions on unprocessed primary products and its implementation of Law 18/2012 on Food (both of which may dampen the country’s agricultural exports and imports and reduce national economic welfare). These recent changes to Indonesia’s trade policy may be in response to the latest effects of Dutch disease on food production and manufactur-ing—which raises the question of how appropriate these changes are, especially now that recent high prices for the country’s primary product exports appear to have started to fall back to trend levels (Aswicahyono and Hill 2014).
THEORY AND PAST EXPERIENCE
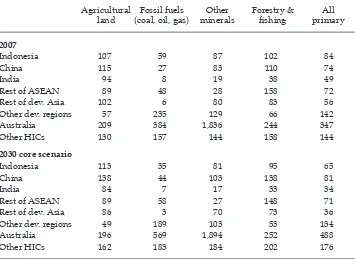
Trade and development theory and Asia’s experience with industrialisation pro -vide a guide to what to expect both in and beyond the region over the next decade or two.1 For example, China and South Asia’s economies—like Northeast Asia’s earlier rapidly industrialising economies—are densely populated and relatively poor in natural resources (table 1). They are therefore highly complementary to
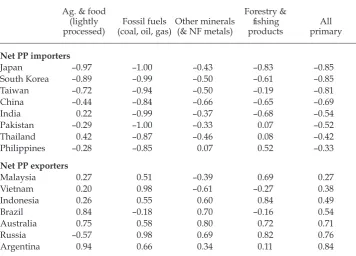
relatively sparsely populated economies that are well endowed with agricultural land or mineral resources per worker, such as those in Australasia, Latin America, the Middle East, and parts of Africa. China and South Asia’s complementarity with ASEAN economies is less clear-cut. For example, Indonesia is relatively well endowed per worker with minerals and energy raw materials, compared with the rest of ASEAN and other Asian countries. Compared with non-Asian develop -ing countries, though, Indonesia is not as well endowed with minerals—but it is twice as well endowed with agricultural land per worker, and this is projected to increase by 2030 (table 1). These relative factor endowments are consistent with patterns of specialisation in primary-product trade as of 2005–9 (table 2).
The workhorse theory of comparative cost advantage, developed in the 20th century, has been used to explain trade specialisation patterns, including trade between natural-resource-rich and natural-resource-poor economies. The theory blends the Heckscher–Ohlin–Samuelson model, which assumes that all factors of production are mobile between sectors, and the Ricardo-Viner model, which
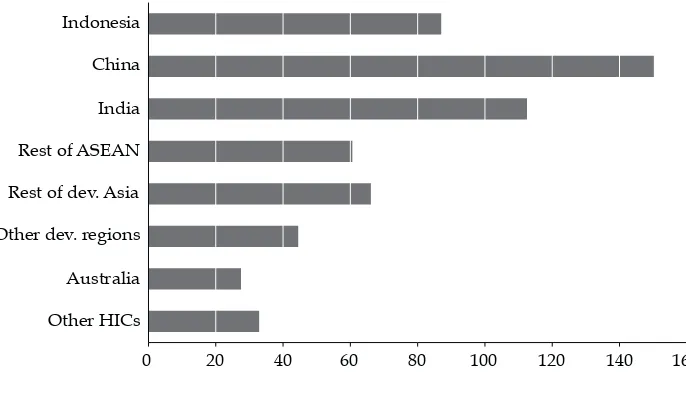
TABLE 1 Relative Natural-Resource Endowments per Worker, 2007 and 2030 (world = 100)
Agricultural land
Fossil fuels
(coal, oil, gas) mineralsOther
Forestry &
ishing primaryAll 2007
Indonesia 107 59 87 102 84
China 115 27 83 110 74
India 94 8 19 38 49
Rest of ASEAN 89 48 28 158 72
Rest of dev. Asia 102 6 80 83 56
Other dev. regions 57 235 129 66 142
Australia 209 384 1,836 244 347
Other HICs 130 157 144 158 144
2030 core scenario
Indonesia 113 35 81 95 65
China 138 44 103 138 81
India 84 7 17 33 34
Rest of ASEAN 89 58 27 148 71
Rest of dev. Asia 86 3 70 73 36
Other dev. regions 49 189 103 53 134
Australia 196 569 1,894 252 488
Other HICs 162 183 184 202 176
Source: Calculated from the GTAP database and the authors’ core projection to 2030, drawing on CEPII
data for economically active populations (Fouré, Bènassy-Quéré, and Fontagné 2012).
Note: Based on the real value of sector-speciic endowments of natural resources per active worker
relative to the world average, in domestic prices (2007 dollars). The workforce is assumed to grow between 2007 and 2030 by only 2% in China, compared with 36% in Indonesia, 35% in the rest of ASEAN, 47% in India, 44% in the rest of developing Asia, and 59% in other developing regions. Pro
-jected rates of growth in natural-resource endowments are shown in appendix table A1. Dev. = devel
assumes that some factors are sector-speciic. Such a blend is provided by Krue -ger (1977) and explored further by Deardorff (1984), who consider two tradable sectors that use intersectorally mobile labour, as well as one sector-speciic factor (natural-resource capital or produced industrial capital). Assuming that labour exhibits diminishing marginal product in each sector, and that there are no ser-vices or non-tradables and no policy distortions, then at a given set of interna-tional prices the real wage in each economy is determined by the aggregate per worker endowment of the two types of capital. The commodity composition of a country’s trade—that is, the extent to which a country is a net exporter of primary or industrial products—is determined by its endowment of natural capital rela -tive to industrial capital compared with that ratio for the rest of the world.
Leamer (1987) develops this model further and relates it to paths of economic development. If the stock of natural resources is unchanged, rapid growth by one or more economies relative to others in their availability of produced capital (physical skills, human skills, and technological and managerial knowledge) per unit of available labour time would tend to cause those economies to increase their comparative advantage in non-primary products. In contrast, a discovery of minerals or energy raw materials would see those economies increase their
TABLE 2 Indexes of Trade Specialisation in Primary Products,
Indonesia and Other Countries, 2005–9
Ag. & food (lightly
processed) (coal, oil, gas)Fossil fuels Other minerals (& NF metals)
Forestry & ishing products
All primary Net PP importers
Japan –0.97 –1.00 –0.43 –0.83 –0.85
South Korea –0.89 –0.99 –0.50 –0.61 –0.85
Taiwan –0.72 –0.94 –0.50 –0.19 –0.81
China –0.44 –0.84 –0.66 –0.65 –0.69
India 0.22 –0.99 –0.37 –0.68 –0.54
Pakistan –0.29 –1.00 –0.33 0.07 –0.52
Thailand 0.42 –0.87 –0.46 0.08 –0.42
Philippines –0.28 –0.85 0.07 0.52 –0.33
Net PP exporters
Malaysia 0.27 0.51 –0.39 0.69 0.27
Vietnam 0.20 0.98 –0.61 –0.27 0.38
Indonesia 0.26 0.55 0.60 0.84 0.49
Brazil 0.84 –0.18 0.70 –0.16 0.54
Australia 0.75 0.58 0.80 0.72 0.71
Russia –0.57 0.98 0.69 0.82 0.76
Argentina 0.94 0.66 0.34 0.11 0.84
Source: Authors’ calculations from the GTAP version 8.1 trade time-series database.
comparative advantage in mining and weaken it in agricultural and other trad -able products, other things being equal. It would also boost national income and hence the demand for non-tradables, which would cause mobile resources to move into the production of non-tradable goods and services, further reducing farm and industrial production (Corden 1984).
Domestic or foreign savings can be invested to enhance the stock or improve the quality not only of a country’s produced capital but also of its economically exploitable stock of natural resources. Any such increase in the stock of capital (net of depreciation) per worker will put upward pressure on real wages. That will encourage, in all sectors, the use of more labour-saving techniques and the development or importation, or both, of better and less labour-intensive technol-ogies. Whether such an increase boosts industrialisation more than agriculture or other primary production will depend on the relative speed of sector-speciic productivity growth yielded by such investments in research and development (R&D). Which types of investment would expand fastest in a free-market set -ting depends on their expected rates of return. The more densely populated and poorer in natural resources an open economy is, the greater the likelihood that the highest pay-off would be in expanding stocks of capital (including technologi -cal knowledge) for non-primary sectors. That gives rise to the Rybczynski effect, of pulling mobile resources (most notably labour) out of primary production. If there is also relatively rapid productivity growth in primary sectors (as Martin and Mitra [2001] have found to be the case historically), and especially if that productivity growth is labour-saving, this also pushes labour into non-primary sectors (Martin and Warr 1993).
At the early stages of development of a country with a relatively small stock of natural resources per worker, wages would be low and the country would have a comparative cost advantage in unskilled labour-intensive, standard-technology manufactures. Then, as the per-worker stock of industrial capital grew, there would be a gradual move towards exporting manufactures that are relatively intensive in their use of physical capital, skills, and knowledge. Natural-resource-rich economies, however, would invest more in capital speciic to primary pro -duction and so would be less likely to develop a comparative advantage in manufacturing until a later stage of development, at which time their industrial exports would be relatively capital-intensive.
The above theory of changing comparative advantages—which can also be used to explain shocks to that pattern from discovery-driven mining booms or major terms-of-trade changes imposed by the rest of the world—has been used to explain the evolving trade patterns of Asia’s resource-poor, irst- and second-generation industrialising economies and their resource-rich trading partners (early examples being the studies of Anderson and Garnaut [1980] and Anderson and Smith [1981]). It has also explained the 20th-century evolution, for early- and later-industrialising countries, of the lying-geese pattern of comparative advan -tage, and then of comparative disadvan-tage, in unskilled labour-intensive man-ufactures, as some rapidly growing economies expanded their endowments of industrial capital per worker relative to the rest of the world—the classic example being clothing and textiles (Anderson 1992; Ozawa 2009).
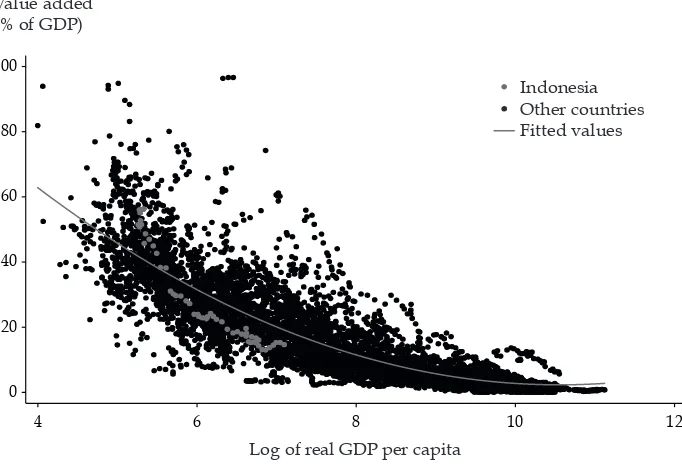
below-average share of GDP from agriculture and an above-average share from manufacturing, but that has reversed with the sharp rise over the past decade in the price of primary products in which Indonesia still has a comparative advan -tage (igures 1a and 1b). The rise in the price of such export products as coal and palm oil led to the share of primary products in Indonesia’s merchandise exports rising from 56% to 75% between 2005 and 2011 (WTO 2012). Its index of ‘revealed’ comparative advantage in agriculture fell from 2.7 in 1965–69 to 1.0 in 2000–2002, but by 2009–11 it was back to 2.4.2
Another element that complicates the task of predicting trade outcomes is domestic demand, the product pattern of which differs across the per capita income spectrum, even when tastes are identical (Markusen 2013). These differ -ing patterns, together with the fact that per capita incomes, endowments, and productivities grow at different rates in different economies, make it particu -larly dificult to predict from theory the pattern of future production and trade of a country such as Indonesia, which is not extreme in its expected output and income growth (appendix table A1) or relative factor endowments (table 1). For that reason, an empirical modelling approach is called for. In particular, given the interdependence between sectors of growing economies described above, an economy-wide model of the world’s national markets is needed to project future
2. The index of ‘revealed’ comparative advantage in agriculture, following Balassa (1965), is the share of agriculture in Indonesia’s exports divided by the share of agricultural prod-ucts in global merchandise exports.
FIGURE 1a Relation between Sectoral Share of GDP and Log of Real GDP per Capita,
Indonesia and All Countries, Agriculture, 1960–2011
100
80
60
40
20
0
4 6 8 10 12
Indonesia Other countries Fitted values Value added
(% of GDP)
Log of real GDP per capita
production, consumption, and international trade developments, given the types of growth rates that we might expect in different economies. Such an approach has the additional advantage of being able to estimate the impacts of policy changes on projected developments.
EMPIRICAL MODELLING METHODOLOGY AND DATABASE
In this study we employ the GTAP model (Hertel 1997) of the global economy and the latest available version (8.1) of the GTAP database, which is calibrated to 2007 levels of production, consumption, trade, and protection for 134 coun-tries or regions (Narayanan, Aguiar, and McDougall 2012). The standard GTAP model is perhaps the most widely used computable general equilibrium model for economy-wide global market analysis, in part owing to its robust, explicit, and fully documented assumptions.3 Version 8.1’s base period of 2007 is ideal for projecting forward to 2030, because 2007 immediately precedes the recent period of temporary spikes in food and fuel prices and the North Atlantic inancial crisis and recession.
In its simplest form, the model assumes perfect competition and constant returns to scale in production. The functional forms are nested production func-tions with constant elasticities of substitution. Land, other natural resources, labour (skilled and unskilled), and physical capital substitute for one another in
3. See http://www.gtap.org.
FIGURE 1b Relation between Sectoral Share of GDP and Log of Real GDP per Capita,
Indonesia and All Countries, Manufacturing, 1960–2011
100
80
60
40
20
0
4 6 8 10 12
Value added (% of GDP)
Log of real GDP per capita
Indonesia Other countries Fitted values
a value-added aggregate, and composite intermediate inputs substitute in ixed proportions for value added at the next level of constant elasticities of substi-tution. Land is speciic to agriculture in the GTAP database; but it is somewhat mobile among agricultural uses during this projection period, according to a con-stant elasticity of transformation, which, through a revenue function, transforms land from one use to another. In the modiied version of the GTAP model that we used for this study, natural resources, including coal, oil, gas, and other minerals, are speciic to the sector in which they are extracted. Labour and produced capital are assumed to be mobile across all uses within a country but immobile interna -tionally. While the aggregate national employment of each productive factor is ixed in the standard macroeconomic closure, we use exogenous projections to model expected changes in factor availability over time.
On the demand side, there is a national representative household whose expenditure is governed by a Cobb–Douglas aggregate utility function, which allo -cates net national expenditures across private, government, and saving activities. Government demand across composite goods is determined by a Cobb–Douglas assumption (ixed budget shares). Private household demand is represented by a constant-difference-of-elasticities functional form, calibrated to replicate a vector of own-price and income elasticities of demand (Hertel et al. 2012). In projecting to 2030 we follow Yu et al. (2004) in lowering these elasticities for food crops (see Anderson and Strutt 2014 for further details).4
To handle bilateral international trade lows, we use the Armington (1969) speciication, which differentiates products by country of origin. These Arm -ington elasticities are the same across countries but are sector-speciic, and the import–import elasticities have been estimated at the disaggregated GTAP com-modity level (Hertel et al. 2007). For present purposes, where we are dealing with long-term changes, we follow the common modelling practice of doubling the short- to medium-term Armington elasticities. The national balance of trade is determined by the relationship between national savings and investment, with investment allocated in response to rates of return (Anderson and Strutt 2014).
Version 8.1 of the GTAP database divides each of the 134 economies into 57 sectors: 26 for primary goods, 16 for manufactures, and 15 for services. We ini-tially aggregated the database to 35 countries or country groups and 34 sectors. To conserve space and highlight key issues of importance to Indonesia, we then aggregated many results to 8 regions and just 4 sectors for reporting.
CORE PROJECTIONS OF THE DATABASE TO 2020 AND 2030
We use the GTAP 2007 database for the world economy to generate a baseline for 2020 and 2030 that assumes the 2007 trade-related policies of each country do not change.5 However, we assume that national real GDP, population, unskilled and skilled labour, capital, agricultural land, and extractable mineral resources (oil, gas, coal, and other minerals) grow at exogenously set rates over that 23-year period. The exogenous growth rates for GDP, population, and skilled and unskilled labour draw on estimates from the World Bank and the Centre d’Études Prospec -tives et d’Informations Internationales (CEPII), using the baseline datasets and aggregation tools of Chappuis and Walmsley (2011). Given that our comparative static model does not include endogenous changes in the capital stock, we also draw on exogenous projections of changes in the capital stock from CEPII’s macro -econometric model results (Fouré, Bénassy-Quéré, and Fontagné 2012). Historical trends in agricultural land are estimated from FAOSTAT (summarised in Dein-inger et al. 2011), while trends in minerals and energy raw-material reserves are estimated from data presented in the reports of BP (2012) and the USGS (2015). We generally assume that annual rates of change in fossil-fuel reserves over the past two decades continue for each country for the next two decades.6 For other miner-als, in the absence of country-speciic data, we use the unweighed average of the annual rate of growth of global reserves for iron ore, copper, lead, nickel, and zinc between 1995 and 2009 for all countries (USGS 2015). The assumed growth rates are summarised in appendix table A1, with the last ive columns showing rates of change in natural resources.
Given these exogenous growth rates, the model is able to derive implied rates of growth in total factor productivity and GDP per capita. The rate of total factor productivity growth for any one country is assumed to be the same in each of its manufacturing sectors, somewhat higher in most of its primary sectors, and some -what lower in services. Higher rates of productivity growth for primary activities were characteristic of the second half of the 20th century (Martin and Mitra 2001), and are necessary in this projection if the average of the real international prices of primary products (relative to the aggregate change for all products) is to remain roughly unchanged.7
5. The baseline projection to 2030 follows the core baseline developed in another of our studies (Anderson and Strutt 2014).
6. Data on past reserves are from BP (2012). For coal, production data are used as a proxy, since projections of reserves were not available. Data on Vietnam’s coal, oil, and gas were available for only a decade of what was exceptionally high growth, which would have led to implausibly high projections, so we modiied them downward. Indonesia’s coal reserves are assumed to grow at 3% per year during 2007–20 and then remain static thereafter— since as of 2011 it had only 17 years of production in reserves, compared with twice that in China and six times that in both India and the rest of the world (BP 2012).
At an average of 8.25% per year from 2007 to 2020, the assumed rate of China’s GDP growth may appear rather high. Yet China’s GDP grew at 9.3% between 2007 and 2012, so our assumption implies a real growth rate of 7.6% for the remainder of this decade. This is the same rate as that projected by the World Bank for China during 2013–16 (World Bank 2014) and marginally above the average annual rate of 7.6% that we assume for the subsequent decade to 2030 (leading to the overall average for 2007–30 of 7.9%, as shown in appendix table A1).
Impacts on Indonesia’s Sectoral and Trade Compositions
The differences across economies in rates of growth of factor endowments and sectoral factor productivities, and the fact that sectors differ in their relative fac-tor intensities and their shares of GDP, ensure that the structures of production, consumption, and trade across sectors within countries—and also between coun -tries—are going to be very different in 2030 than in 2007, owing to changes in incomes and comparative advantages. In particular, the faster-growing devel -oping economies (especially those of Asia) will account for considerably larger
price of manufactures as industrialisation in China and other Asian countries booms— as occurred in the Industrial Revolution, in the irst half of the 19th century (Williamson 2012). It is even less likely that farm products will fall if fossil-fuel prices and biofuel man -dates in the United States, the European Union, and elsewhere are maintained over the next decade. Timilsina et al. (2012) project that international prices will be higher by 2020 in the presence versus the absence of those biofuel mandates for sugar (by 10%), corn (by 4%), oilseeds (by 3%), and wheat and coarse grains (by 2%), while prices for petroleum products will be 1% lower. (For Asian growth assumptions that lead to different price projections, see Anderson and Strutt 2014.)
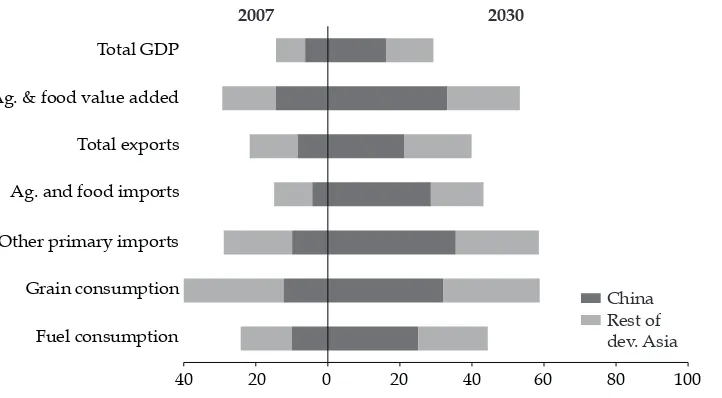
FIGURE 2 Shares in the Global Economy—China and the Rest of Developing Asia, 2007 and 2030 (%)
2007 2030
China Rest of dev. Asia
Fuel consumption Grain consumption Other primary imports Ag. and food imports Total exports Ag. & food value added Total GDP
40 20 0 20 40 60 80 100
Source: Derived from the authors’ GTAP-model results.
shares of the projected global economy over the next two decades. Given our macroeconomic assumptions outlined above, in the core scenario the aggregate developing-country share of world GDP—measured in 2007 US dollars (not in purchasing-power-parity dollars, in which developing-country shares are much larger)—will rise from 27% in 2007 to 36% in 2020 and to 46% in 2030, while Indo -nesia’s share will rise from 0.8% to 1.2% and then to 1.4%. By 2030, China is pro -jected to be the world’s top producing country, not only of primary products but also of manufactures. China has not held this ranking since the mid-19th century, just before the United Kingdom and then (from 1895) the United States became the top-ranked country for industrial production (Allen 2011; Crafts and Venables 2003). We project that China will become much more dominant in many other respects, too, including in imports of primary products (igure 2).
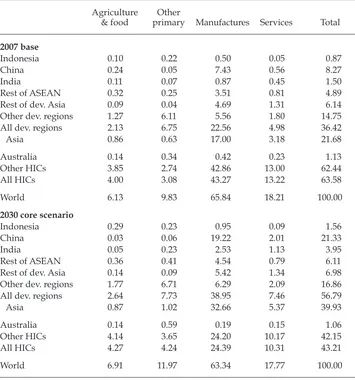
As the Asian developing-country share of global exports of all products nearly doubles, rising from 22% in 2007 to 40% in 2030, China’s share alone grows from 8% to 21%. The growth of China’s export share is entirely at the expense of high-income countries, because the export shares for the other developing-country regions also grow. Indonesia’s share, for example, increases from 0.9% in 2007 to 1.6% by 2030. The developing-country share of primary products in world exports grows slightly, while its share of manufactures in world exports almost doubles (table 3). Asia’s import shares also increase, although not quite so dra -matically: the increase for developing countries in Asia is from 19% to 32% for all products, whereas China’s primary-product imports increase their share of total world imports from 1.3% to 6.5%.
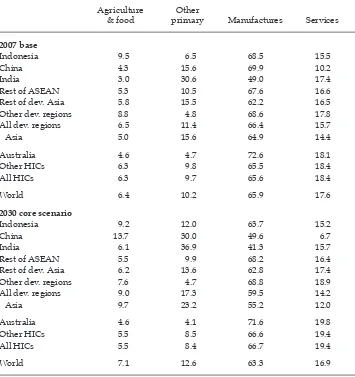
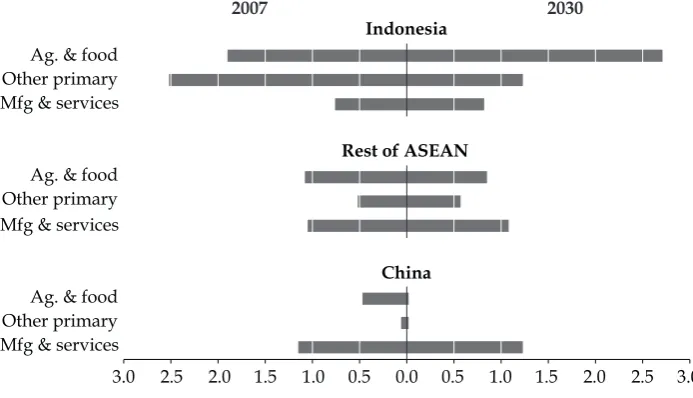
The consequences of continuing Asian industrialisation are also evident in the sectoral shares of national trade in our projections: primary products become less important in the aggregate of developing-country exports and considerably more important in their imports, and conversely for non-primary products, with the changes being largest in developing countries in Asia (tables 3 and 4).8 In Indone-sia, however, the share of farm products in exports rises, from 12% to 19%. This implies an increase in Indonesia’s comparative advantage in farm products at the expense of mineral and energy products (igure 3): Indonesia’s coal reserves are assumed not to grow after 2020 (footnote 6), and China and India import greater amounts of Indonesian farm products by 2030 (table 4). China’s growing demand for palm-oil imports is a dominant part of this development.
Impacts on Self-Suficiency and Real Consumption of Farm Products
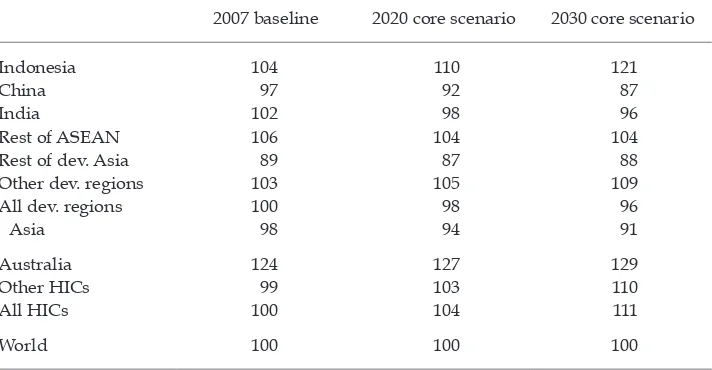
Under the core scenario, we project that agricultural self-suficiency in devel -oping countries, as a group, will fall from 100% to 96% between 2007 and 2030. This decrease is largely due to falls in China and, to a smaller extent, in India. Indonesia’s agricultural self-suficiency rises, from 104% to 121%, while that of other ASEAN countries and of other developing Asian countries falls slightly, on
average (table 5).9 For Indonesia, rice self-suficiency is likely to be a key concern; we ind that it increases from 96% in 2007 to 100% in 2030.
Self-suficiency is a poor indicator of food security, however. A more meaningful indicator is real per capita consumption of agricultural and processed food prod-ucts by households (Tiwari, Skouias, and Sherpa 2013). We project that, between 2007 and 2030, real per capita agricultural and food consumption will increase by 78% in developing countries, as a group, by 87% in Indonesia, and by more
9. In practice, these populous countries might seek to prevent such growth in food import dependence by erecting protectionist barriers (at least for food staples), but we do not model that here. See, however, Anderson and Nelgen’s (2011) study.
TABLE 3 Regional Sectoral Shares of Global Exports, 2007 and 2030 (%)
Agriculture
& food primaryOther Manufactures Services Total 2007 base
Indonesia 0.10 0.22 0.50 0.05 0.87
China 0.24 0.05 7.43 0.56 8.27
India 0.11 0.07 0.87 0.45 1.50
Rest of ASEAN 0.32 0.25 3.51 0.81 4.89
Rest of dev. Asia 0.09 0.04 4.69 1.31 6.14
Other dev. regions 1.27 6.11 5.56 1.80 14.75
All dev. regions 2.13 6.75 22.56 4.98 36.42
Asia 0.86 0.63 17.00 3.18 21.68
Australia 0.14 0.34 0.42 0.23 1.13
Other HICs 3.85 2.74 42.86 13.00 62.44
All HICs 4.00 3.08 43.27 13.22 63.58
World 6.13 9.83 65.84 18.21 100.00
2030 core scenario
Indonesia 0.29 0.23 0.95 0.09 1.56
China 0.03 0.06 19.22 2.01 21.33
India 0.05 0.23 2.53 1.13 3.95
Rest of ASEAN 0.36 0.41 4.54 0.79 6.11
Rest of dev. Asia 0.14 0.09 5.42 1.34 6.98
Other dev. regions 1.77 6.71 6.29 2.09 16.86
All dev. regions 2.64 7.73 38.95 7.46 56.79
Asia 0.87 1.02 32.66 5.37 39.93
Australia 0.14 0.59 0.19 0.15 1.06
Other HICs 4.14 3.65 24.20 10.17 42.15
All HICs 4.27 4.24 24.39 10.31 43.21
World 6.91 11.97 63.34 17.77 100.00
Source: Derived from the authors’ GTAP-model results.
than double in China and South Asia (igure 4). These are major improvements in consumption of farm products per capita. According to this baseline scenario, people in virtually all developing-country regions can expect to be much better fed by 2030, even if income distribution worsens in these regions over the next two decades.
Turning to global consumption shares, the rise in grain consumption is espe-cially great in China—owing to the country’s expanding demand for livestock products, most of which continue to be produced domestically in the core sce -nario and to be fed intensively rather than grazed. So even though China’s share of the world’s direct grain consumption by households grows little, its share of total grain consumed grows from 12% to 32% of the global total. That promises
TABLE 4 Sectoral Shares of National Imports, 2007 and 2030 (%)
Agriculture
& food primaryOther Manufactures Services 2007 base
Indonesia 9.5 6.5 68.5 15.5
China 4.3 15.6 69.9 10.2
India 3.0 30.6 49.0 17.4
Rest of ASEAN 5.3 10.5 67.6 16.6
Rest of dev. Asia 5.8 15.5 62.2 16.5
Other dev. regions 8.8 4.8 68.6 17.8
All dev. regions 6.5 11.4 66.4 15.7
Asia 5.0 15.6 64.9 14.4
Australia 4.6 4.7 72.6 18.1
Other HICs 6.3 9.8 65.5 18.4
All HICs 6.3 9.7 65.6 18.4
World 6.4 10.2 65.9 17.6
2030 core scenario
Indonesia 9.2 12.0 63.7 15.2
China 13.7 30.0 49.6 6.7
India 6.1 36.9 41.3 15.7
Rest of ASEAN 5.5 9.9 68.2 16.4
Rest of dev. Asia 6.2 13.6 62.8 17.4
Other dev. regions 7.6 4.7 68.8 18.9
All dev. regions 9.0 17.3 59.5 14.2
Asia 9.7 23.2 55.2 12.0
Australia 4.6 4.1 71.6 19.8
Other HICs 5.5 8.5 66.6 19.4
All HICs 5.5 8.4 66.7 19.4
World 7.1 12.6 63.3 16.9
Source: Derived from the authors’ GTAP-model results.
to provide ongoing growth in the market for grain and oilseed exports to China. We project that China’s share of global consumption of fossil fuels will rise by a similar proportion over this period (from 10% to 25%), as will imports of other non-agricultural primary products (from 10% to 35%) (igure 2).
Impacts on Bilateral Trade
In the core scenario, the phenomenal growth in China’s shares of global imports of primary products and exports of manufactures dominates the bilateral trade picture. The share of Indonesia’s exports to China nearly trebles between 2007 and 2030, rising from 9% to 25%, while the share of its imports from China doubles (rising from 13% to 27%) (igure 5). The same tendency is evident in the projected trade direction of many other natural-resource-rich countries, some of which are well ahead of Indonesia in their intensity of trade with China. In 2007, 16% of Australia’s exports went to China, for example, and we project that in 2030 the share will be 44%. The accuracy of these projections will depend to some extent on the evolving intensities of Chinese investment in natural-resource sectors over the next two decades, including in resource-rich South America and Sub-Saharan Africa in addition to ASEAN and Australia.
EFFECTS OF POLICY CHANGES
The above projections assume no policy changes from 2007 to 2030. How would the core projection change if we were to include some of the policy changes that have already taken place? This section examines the possible effects by 2020 of
FIGURE 3 ‘Revealed’ Comparative Advantage Indexes, by Sector, 2007 and 2030
Mfg & services Other primary Ag. & food Mfg & services Other primary Ag. & food Mfg & services Other primary Ag. & food
3.0 2.5 2.0 1.5 1.0 0.5 0.0 0.5 1.0 1.5 2.0 2.5 3.0
Rest of ASEAN
China Indonesia
2007 2030
Source: Derived from the authors’ GTAP-model results.
Note: The index of ‘revealed’ comparative advantage is the share of a product in an economy’s exports
three policies announced since 2007. One that is external to Indonesia, but of con-siderable interest to Indonesia’s policymakers, is Myanmar’s decision to begin opening up its economy, since that will involve its re-entry into the international rice market. The other policies are Indonesia’s recently imposed export restric-tions on unprocessed primary products and the implementation of Law 18/2012 on Food.
Increased Supply in the International Rice Market
Both Thailand (as the world’s main rice exporter) and Indonesia (as prospectively a major rice importer) have a keen interest in what impact Myanmar’s gradual opening up will have on international rice markets. In the inter-war period, Burma (as Myanmar was then known) was the world’s largest rice exporter, sup -plying about one-third of global exports (Wickizer and Bennett 1941); its share remained relatively high in the 1950s and early 1960s (Barker, Herdt, and Rose 1985; Van der Eng 2004).
Using GTAP to model Myanmar’s emergence as a rice exporter is problematic, for several reasons. First, data are not available to model Myanmar as a separate country; in the GTAP database, Myanmar forms a residual group with Brunei and Timor-Leste. Second, since the GTAP model is based on proportional changes, it does not lend itself to capturing the effect of a country moving from zero trade to positive trade. We therefore generate the effect on Indonesia of these greater rice exports by using a proxy: we assume that the supply expansion occurs in Vietnam, which has been the major source of Indonesia’s rice imports in recent years and is likely to have a similar impact on Indonesia as would a comparable expansion of rice exports from Myanmar.
TABLE 5 Agricultural Self-Suficiency Ratio, 2007, 2020, and 2030 (%)
2007 baseline 2020 core scenario 2030 core scenario
Indonesia 104 110 121
China 97 92 87
India 102 98 96
Rest of ASEAN 106 104 104
Rest of dev. Asia 89 87 88
Other dev. regions 103 105 109
All dev. regions 100 98 96
Asia 98 94 91
Australia 124 127 129
Other HICs 99 103 110
All HICs 100 104 111
World 100 100 100
Source: Derived from the authors’ GTAP-model results.
To examine the prospect of increased global rice supply following Myanmar’s re-emerging as a major rice exporter, we model an expansion of rice production and exports between 2007 and 2020: we project the rice self-suficiency of ASEAN countries other than Indonesia in 2020 to be 131%, compared with 124% under the core scenario. Despite this major increase in rice exports in Southeast Asia, our results suggest the impact on Indonesia is relatively minor: rice self-suficiency falls by just over one percentage point, the drop in the international rice price is only two-thirds of a percentage point, and real food consumption in Indonesia in 2020 is only marginally higher.
Indonesia’s Taxes on Exports of Unprocessed Primary Products
In 2012, Indonesia introduced restrictions on exports of a wide range of unpro -cessed primary products, the aim being to encourage the domestic processing of raw materials. The decrees went further, foreshadowing a ban on unprocessed primary product exports from 2014 (Burke and Resosudarmo 2012).
There remains considerable uncertainty regarding the implementation of these measures, however. To examine some possible effects, we ran an alternative sce -nario to 2020, in which we imposed a 20% tax on raw oilseed and on the export of all unprocessed outputs of the non-agricultural mining or extractive sectors (except coal). Given the relatively small proportion of world exports contributed by Indonesia in our 2020 projections, these export taxes will lead only to small increases in the international prices of these commodities. For oilseeds and oil, of which Indonesia supplies less than 0.2% of world exports, international prices increase by less than 0.1%. They increase by 0.4% for forestry and ish products, of which Indonesia supplies 1.7% of the world market. Even in the cases of other
FIGURE 4 Increase in Real per Capita Household Consumption of
Food and Agricultural Products, 2007 –30 (%)
Other HICs Australia Other dev. regions Rest of dev. Asia Rest of ASEAN India China Indonesia
0 20 40 60 80 100 120 140 160
Source: Derived from the authors’ GTAP-model results.
minerals and gas, of which Indonesia supplies between 3.7% and 5.5% of the world market, international export prices increase by less than 1.0%.
Not surprisingly, those price-distorting policies shrink the value of Indonesia’s overall exports, which fall by an estimated 0.6% (a 1.3% reduction in the volume of exports). While agriculture and food exports decrease by only 0.7%, the impact of the export taxes on oil, gas, and other minerals leads to other primary product exports being more than 17% lower than otherwise. Indonesian exports to China of other primary products reduce by 28% with the export taxes, driving an overall reduction in exports to China of 4% relative to the 2020 core scenario. This leads to China becoming 0.6% less important to Indonesia as an overall export destina -tion, but 2.6% less important for non-agricultural primary exports (table 6). These policies also lower real GDP by 0.1%, yet they have almost no impact on agricul -tural self-suficiency (table 7).10
Implementation of Indonesia’s Food Law of November 2012
Indonesia’s new food law, which was rushed through parliament in late 2012, explicitly aims to boost food self-suficiency in Indonesia, including through quo -tas and bans on imports; restrictions on exports of unprocessed farm products; and greater state involvement in food and feed procurement, distribution, and processing.
10. We note that these impacts would be much more severe if exports from the large veg -etable oils and fats sector were also taxed.
FIGURE 5 Redirection of Indonesia’s External Trade, 2007–30 (% of all goods-and-services trade with different trading partners)
2007 2030
HICs Other dev. regions Rest of ASEAN China
Imports
HICs Other dev. regions Rest of ASEAN China
Exports
60 50 40 30 20 10 0 10 20 30 40
Source: Derived from the authors’ GTAP-model results.
To get a sense of what impacts the implementation of just one component of such a food self-suficiency policy may have, we modelled the consequences of simply restricting imports of a selection of farm products, via tariffs, such that imports reduce by 99%.11 The targeted products are rice, coarse grains, oilseeds, vegetable oils, sugar, red meats, and dairy products. Such a policy requires huge increases in tariffs on the targeted products in order to achieve near self-suficiency (table 8). Some of those tariffs would be above the rates bound under international law by the WTO, and so would upset trading partners and possi -bly trigger retaliation against Indonesian exports. They would also divert mobile resources away from palm oil and other farm products in which Indonesia has a comparative advantage. The appreciation in the real exchange rate that such a rise in protectionism triggers means that Indonesia’s share of global farm exports rises from 1.7% in 2007 to only 2.0% in 2020, compared with 2.8% in the core scenario. Such protectionism reduces real GDP more than the previous export-tax scenario (by 0.5% instead of 0.1%) and it lowers consumption of farm products and per capita household welfare.
SOME QUALIFICATIONS
As with the results of all economy-wide model projections, it is necessary to keep in mind numerous qualiications. While results such as those discussed above can provide useful insights into the changing nature of the global economy, assump-tions will inevitably not capture all aspects of the changing global economy. In this section we highlight some qualiications of the current modelling.
First, we have just 34 sectors and product groups. Given the lack of detailed industry speciication, this aggregation underestimates the extent to which irms can take advantage of intra-industry trade by fragmenting the production process (Feenstra 1998). Our underestimate is made even larger by not accommodating endogenous lows of foreign direct investment, since they tend to reinforce trade lows in manufactures within Asia (Petri 2012). The linkage between investment and trade in manufactures has become more important in recent years as global
11. The baseline with which this scenario is compared is the updated 2020 database, which includes the impacts of Indonesia’s imposing export taxes on selected primary products.
TABLE 6 Share of Indonesia’s Exports to China: 2007 Baseline, 2020 Core, and Alternative Scenarios (%)
Agriculture
& food Other primary products
All products
2007 baseline 10.9 10.0 8.7
2020 core scenario 31.8 19.8 16.0
Myanmar’s rice expansion 31.8 19.8 16.0
Indonesia’s export taxes 31.8 17.2 15.4
Indonesia’s food law 29.1 17.3 14.5
value chains have strengthened in ways that allow innovating irms to retain ownership and control of their intellectual capital (Baldwin and Lopez-Gonzales 2014, Cattaneo et al. 2013).
Second, we have assumed constant returns to scale and perfect competition, rather than allowing irms to enjoy increasing returns and some degree of monop -oly power for their differentiated products. This too leads us to underestimate the changes associated with production and trade growth, particularly in manufac -tured goods and services (Krugman 2009).
Third, where consumers (including irms importing intermediate inputs) value a greater variety of goods, or a greater range of qualities, intra-industry trade can grow as a result of both economic growth and trade policy reform (Rutherford and Tarr 2002), but that too is not taken into account in the above analysis.
Fourth, our model does not include biofuel policies that have been put in place in many countries but have begun to bite severely since our 2007 base year. The new biofuel mandates and subsidies have had a non-trivial effect of increasing both the mean and the variance of international food prices, and are expected to become even more important over the next decade as the mandates in the United States and the European Union, in particular, increase to 2020–21 (Hertel and Beckman 2011; Hertel and Diffenbaugh 2011). Whether these policies will still be in place in 2030, or even 2020, is a moot point. If the expected dramatic expansion in unconventional gas production materialises (IEA 2012), and if the resulting fall in fossil-fuel prices is enough to cause governments to abandon biofuel mandates, this omission from our modelling may be inconsequential.
Fifth, our projections do not include the effects of climate change. It is conceiv-able that climate change will affect agriculture sectors in tropical countries more than those in temperate zones (Hertel and Lobell 2014). But it will also affect other sectors (Rosen and Van der Mensbrugghe 2012), and at this stage the net effects are too uncertain to include in our analysis.
TABLE 7 Indonesia’s Self-Suficiency in Farm Products: 2007 Baseline, 2020 Core, and 2020 after Policy Changes
2007
Coarse grains 0.97 0.98 0.98 0.98 1.00
Fruit & vegetables 0.98 1.05 1.05 1.05 1.02
Oilseeds 0.94 0.92 0.92 0.92 1.00
Vegetable oils 1.95 2.53 2.53 2.52 2.13
Cattle & sheep 0.94 0.94 0.94 0.94 1.00
Sugar 0.64 0.65 0.65 0.65 1.00
Beef & mutton 0.92 0.91 0.92 0.91 1.00
Poultry meats 0.97 1.00 1.00 1.00 0.99
Dairy products 0.71 0.72 0.72 0.71 1.00
Highly processed food 1.06 1.05 1.05 1.05 1.03
Sixth, our projections depend on our underlying macroeconomic assumptions, including those of relatively rapid growth in China and India. If, for example, these economies experienced a signiicant slowdown, it could have a substantial impact on our projections.12 To test the sensitivity of our results to the growth assump -tions that we have made for China and India, another of our studies (Anderson and Strutt 2014) projects a 2030 baseline with 25% slower growth in GDP, capital, and skilled labour in China and India, along with a global slowdown in primary total factor productivity growth owing to the lower consequent prices for primary products. As expected, this slows the expansion of the importance of developing Asia in global exports: its share rises from 22% in 2007 to 34% in 2030—not to the 40% projected in the core scenario. We project that the share of Indonesia’s total exports going to China will increase from 9% in 2007 to 17% in 2030 (instead of
12. Such a slowdown is less likely than some observers fear. According to one of China’s most prominent economists and former senior vice president of the World Bank, ‘China can maintain an 8% annual GDP growth rate for many years to come. . . . China’s per capita GDP in 2008 was 21% of per capita GDP in the United States. That is roughly the same gap that existed between the United States and Japan in 1951, Singapore in 1967, Taiwan in 1975, and South Korea in 1977. . . . Japan’s average annual growth rate soared to 9.2% over the subsequent 20 years, compared to 8.6% in Singapore, 8.3% in Taiwan, and 7.6% in South Korea’ (Lin 2013).
TABLE 8 Indonesian Food and Agricultural Import Shares and Tariff Rates, 2020 (%)
2020 share of agriculture and
food importsa 2020 tariff, without new food law 2020 tariff, with new food law
Rice, processedb 4 9 191
Wheat 12 2 2
Coarse grainsb 1 3 607
Fruit & vegetables 4 4 4
Oilseedsb 12 5 187
Vegetable oilsb 8 0 114
Sugarb 10 20 415
Cotton 13 0 0
Other crops 5 4 4
Cattle & sheepb 3 3 488
Beef & muttonb 2 5 124
Other meats 1 2 2
Dairy productsb 9 4 126
Other processed foods 16 10 10
Total 100
Source: Derived from the authors’ GTAP model results.
a2020 database includes Indonesian agricultural export taxes.
25%), relecting a dampening of import growth by China and meaning that Indo -nesia will trade more with other developing countries than with China. Indone -sia’s agricultural self-suficiency of 121% in the 2030 core scenario falls to 110% in the slower growth scenario for China and India, while the increase in China’s (and India’s) shares of global grain, fuel, and mineral consumption is moderated.
Finally, the standard GTAP model that we use here is comparative static. It therefore does not measure the additional dynamic consequences of trade reform. Dynamic effects arise in numerous ways. One of the more important is through encouraging a country’s more eficient irms to take over from its less eficient irms (Melitz 2003; Melitz and Ottaviano 2008; Bernard et al. 2012; Helpman 2013). Another way is through multinational irms sharing technologies and knowledge across countries within these irms (Markusen 2002). Offshoring is yet another mechanism through which heterogeneous irms are affected by trade liberalisa -tion, including by irms relocating from small nations to larger ones (Baldwin and Okubo 2011). Offshoring may also alter the political economy of protection, pro -viding stronger opposition from new exporters and thus leading more economies to open up (Baldwin and Lopez-Gonzales 2014).
POLICY IMPLICATIONS AND CONCLUSIONS
Should relatively rapid economic growth in Asia, and, to a lesser extent, in devel -oping countries outside Asia, continue to characterise world economic devel -opment, developing Asia’s share of global GDP and trade will continue to rise steeply over the next two decades. Our core scenario results indicate that by 2030 developing Asia will consume around half of the world’s grain and fossil fuels (or more, if carbon taxes are introduced in high-income countries but not emerging economies), and around three-quarters of the world’s other minerals. Indeed, the core scenario projects that their shares of the world’s imports of primary products will more than double between 2007 and 2030—and be paid for with their rapidly rising earnings from the exports of manufactures.
These changes in the global economy have signiicant implications for Indone -sia, which, we project, will increase its share of global exports by 80% in the core scenario between 2007 and 2030. Indonesia looks set to experience a particularly large increase in the share it contributes to global agriculture and food exports. The actual growth in its exports, however, will depend on the rates of growth in other economies—and especially in China and India, to whom Indonesia would be directing a much larger share of its exports than currently.
restricting exports in this way is also likely to reduce inlows of foreign invest -ment—particularly from China—which would dampen Indonesia’s growth.
We have shown that the new food law’s attempt to boost food self-suficiency would be a costly and ineffective way of pursuing food security, because it would lead to lower economic welfare and real consumption of farm products. It could also create disputes between Indonesia and its trading partners, insofar as the tariffs or quantitative import restrictions violate Indonesia’s commitments at the WTO. The food law also notes that the government could expand public invest -ments in agricultural R&D and rural infrastructure, and improve the allocation and policing of land and water property rights. Those measures would have the advantages of boosting food self-suficiency by making domestic food production more proitable, beneiting both net buyers and net sellers of food—in contrast to food import restrictions, which beneit net sellers at the expense of net buyers, producers in other sectors who compete with food producers for land and other mobile resources, and processing industries using importable farm products as key inputs. Returns from further R&D investments are likely to be especially high because, as a percentage of agricultural GDP, Indonesia’s level of investment in recent years has been less than half that of China and India and barely one-sev -enth that of Malaysia and Brazil (ASTI 2012).
Focusing on growth-enhancing measures such as R&D and infrastructure would also facilitate Indonesia’s adjustment to other realities related to the decline in transaction costs of doing business internationally and to major changes in diets. A ‘quiet revolution’ is taking place within many Asian countries, rapidly altering the staple food supply chain (Reardon et al. 2012). These market forces are trans -forming farm production systems and food trade in Asia. In particular, farming is becoming more of a part-time activity for many households, so that their economic well-being depends increasingly on earnings from processing outside the farm-gate and on service activities, rather than on farm production itself. These earn-ings increase as a country’s economy becomes more internationally competitive, whereas they decrease if an economy instead chooses to be more protectionist. Should the Indonesian government still worry that household income growth in rural areas is lagging that in urban areas, it could provide conditional cash transfers electronically as direct assistance to remote and small-farm households. Indonesia has succeeded in pioneering such social-protection mechanisms in the past (Alatas et al. 2013; Skouias, Tiwari, and Zaman 2010), which bodes well for the govern -ment should it move further in that direction in order to achieve its food security goals without compromising its opportunities for trade-led economic growth.
REFERENCES
Alatas, Vivi, Abhijit Banerjee, Rema Hanna, Benjamin A. Olken, and Julia Tobias. 2012. ‘Targeting the Poor: Evidence from a Field Experiment in Indonesia’. American Eco-nomic Review 102 (4): 1206–40.
Allen, Robert C. 2011. Global Economic History: A Very Short Introduction. Oxford: Oxford University Press.
Alston, Julian M., Bruce A. Babcock, and Philip G. Pardey, eds. 2010. The Shifting Patterns of Agricultural Production and Productivity Worldwide. Ames, IA: Midwest Agribusiness Trade Research and Information Center, Iowa State University.
Anderson, Kym, Betina Dimaranan, Tom Hertel, and Will Martin. 1997. ‘Economic Growth and Policy Reforms in the APEC Region: Trade and Welfare Implications by 2005’. Asia-Paciic Economic Review 3 (1): 1–18.
Anderson, Kym, and Ross Garnaut. 1980. ‘ASEAN Export Specialisation and the Evolution of Comparative Advantage in the Western Paciic Region’. In ASEAN in a Changing Paciic and World Economy, edited by Ross Garnaut, 374–412. Canberra: ANU Press. Anderson, Kym, and Signe Nelgen. 2011. ‘What’s the Appropriate Agricultural Protection
Counterfactual for Trade Analysis?’. In Uninished Business? The WTO’s Doha Agenda, edited by Will Martin and Aaditya Mattoo, 325–54. London: Centre for Economic Pol -icy Research / World Bank.
Anderson, Kym, and Mari Pangestu. 1998. ‘Structural Changes in a Reforming World Econ -omy: Implications for Indonesia’. Bulletin of Indonesian Economic Studies 34 (3): 85–113. Anderson, Kym, and Ben Smith. 1981. ‘Changing Economic Relations between Asian ADCs
and Resource-Exporting Developed Countries’. In Trade and Growth in the Advanced Developing Countries, edited by Wontack Hong and Lawrence B. Krause, 293–338. Seoul: Korea Development Institute Press.
Anderson, Kym, and Anna Strutt. 2014. ‘Emerging Economies, Productivity Growth and Trade with Resource-Rich Economies by 2030’. Australian Journal of Agricultural and Resource Economics 58 (4): 590–606.
Armington, Paul S. 1969. ‘A Theory of Demand for Products Distinguished by Place of Production’. IMF Staff Papers 16: 159–78.
ASTI (Agricultural Science and Technology Indicators). 2012. ASTI Database. Accessed 12 December. http://www.asti.cgiar.org/data.
Aswicahyono, Haryo, and Hal Hill. 2014. ‘Survey of Recent Developments’. Bulletin of Indonesian Economic Studies 50 (3): 319-46.
Balassa, Bela. 1965. ‘Trade Liberalization and “Revealed” Comparative Advantage’. Man-chester School of Economic and Social Studies 33 (2): 99–124.
Baldwin, Richard, and Javier Lopez-Gonzales. 2014. ‘Supply-Chain Trade: A Portrait of Global Patterns and Several Testable Hypotheses’. The World Economy. Published elec-tronically 13 May. doi: 10.1111/twec.12189.
Baldwin, Richard, and Toshihiro Okubo. 2011. ‘International Trade, Offshoring and Hetero -geneous Firms’. NBER Working Paper 16660, National Bureau of Economic Research, Cambridge, MA.
Barker, Randolph, Robert W. Herdt, and Beth Rose. 1985. The Rice Economy of Asia. Wash-ington, DC: Resources for the Future.
Bernard, Andrew B., J. Bradford Jensen, Stephen J. Redding and Peter K. Schott. 2012. ‘The Empirics of Firm Heterogeneity and International Trade’. Annual Review of Economics 4: 283–313.
BP. 2012. BP Statistical Review of World Energy June 2012. London: BP.
Burke, Paul J., and Budy P. Resosudarmo. 2012. ‘Survey of Recent Developments’. Bulletin of Indonesian Economic Studies 48 (3): 299–324.
Cattaneo, O., G. Gerefi, S. Miroudot, and D. Taglioni. 2013. ‘Joining, Upgrading and Being Competitive in Global Value Chains: A Strategic Framework’. Policy Research Working Paper 6406, World Bank, Washington, DC.
Chappuis, Thomas, and Terrie L. Walmsley. 2011. ‘Projections for World CGE Model Base -lines’. GTAP Research Memorandum 22, Center for Global Trade Analysis, Purdue University, West Lafayette, IN.
Corden, W. M. 1984. ‘Booming Sector and Dutch Disease Economics: Survey and Consoli -dation’. Oxford Economic Papers 36 (3): 359–80.
Deardorff, Alan V. 1984. ‘An Exposition and Exploration of Krueger’s Trade Model’. Cana-dian Journal of Economics 5 (4): 731–46.
Deininger, Klaus, Derek Byerlee, Jonathan Lindsay, Andrew Norton, Harris Selod, and Mercedes Stickler. 2011. Rising Global Interest in Farmland: Can It Yield Sustainable and Equitable Beneits?. Washington DC: World Bank.
Feenstra, Robert C. 1998. ‘Integration of Trade and Disintegration of Production in the Global Economy’, Journal of Economic Perspectives 12 (4): 31–50.
Fouré Jean, Agnès Bénassy-Quéré, and Lionel Fontagné. 2012. ‘The Great Shift: Macroeco -nomic Projections for the World Economy at the 2050 Horizon’. CEPII Working Paper 2012-03, Centre d’Etudes Prospectives et d’Informations Internationales, Paris. Helpman, Elhanan. 2013. ‘Foreign Trade and Investment: Firm Perspectives’. NBER
Work-ing Paper 19057, National Bureau of Economic Research, Cambridge, MA.
Hertel, Thomas W., ed. 1997. Global Trade Analysis: Modeling and Applications. Cambridge: Cambridge University Press.
Hertel, Thomas W., and Jayson Beckman. 2011. ‘Commodity Price Volatility in the Biofuel Era: An Examination of the Linkage Between Energy and Agricultural Markets’. In The Intended and Unintended Effects of U.S. Agricultural and Biotechnology Policies, edited by Joshua S. Graff Zivin and Jeffrey M. Perloff, 189–221. National Bureau of Economic Research Conference Report. Chicago: University of Chicago Press.
Hertel, Thomas, and Noah Differbaugh. 2011. ‘Implications of Climate Volatility for Agri -cultural Commodity Markets in the Presence of Biofuel Mandates’. Paper presented at the 14th Annual Conference on Global Economic Analysis, Venice, 16–18 June.
Hertel, Thomas, David Hummels, Maros Ivanic, and Roman Keeney. 2007. ‘How Coni -dent Can We Be in CGE-Based Assessments of Free Trade Agreements?’. Economic Mod-elling 24 (4): 611–35.
Hertel, Thomas W., and David B. Lobell. 2014. ‘Agricultural Adaptation to Climate Change in Rich and Poor Countries: Current Modeling Practice and Potential for Empirical Contributions’. Energy Economics 46: 562–75.
Hertel, Thomas W., Robert A. McDougall, Badri Narayanan G., and Angel H. Aguiar. 2012. ‘Behavioral Parameters’. In Global Trade, Assistance, and Production: The GTAP 8 Data Base, edited by Badri Narayanan G., Angel Aguiar, and Robert McDougall, 1–18. West Lafayette, IN: Center for Global Trade Analysis, Purdue University.
IEA (International Energy Agency). 2012. World Energy Outlook 2012. Paris: IEA.
Krueger, Anne O. 1977. Growth, Distortions, and Patterns of Trade Among Many Countries. Princeton Studies in International Finance 40. Princeton, NJ: International Finance Sec -tion, Department of Economics.
Krugman, Paul. 2009. ‘The Increasing Returns Revolution in Trade and Geography’. Ameri-can Economic Review 99 (3): 561–71.
Leamer, Edward E. 1987. ‘Paths of Development in the Three-Factor, n-Good General Equi -librium Model’. Journal of Political Economy 95 (5): 961–99.
Lin, Justin Yifu. 2013. ‘Long Live China’s Boom’. Chazen Global Insights, 16 August. http:// www8.gsb.columbia.edu/chazen/globalinsights/node/207/Long+Live+China’s+ Boom.
Markusen, James R. 2002. Multinational Firms and the Theory of International Trade. Cam -bridge, MA: The MIT Press.
———. 2013. ‘Putting Per-Capita Income Back into Trade Theory’. Journal of International Economics 90 (2): 255–65.
Martin, Will, and Devashish Mitra. 2001. ‘Productivity Growth and Convergence in Agri -culture and Manufacturing’. Economic Development and Cultural Change 49(2): 403–22. Martin, Will, and Peter G. Warr. 1993. ‘Explaining Agriculture’s Relative Decline: A Supply
Melitz, Marc J. 2003. ‘The Impact of Trade on Intra-industry Reallocations and Aggregate Industry Productivity’. Econometrica 71 (6): 1692–1725.
Melitz, Marc J., and Gianmarco I. P. Ottaviano. 2008. ‘Market Size, Trade, and Productivity’. Review of Economic Studies 75 (1): 295–316.
Narayanan, G., Badri, Angel Aguiar, and Robert McDougall. 2012. Global Trade, Assistance, and Production: The GTAP 8 Data Base. West Lafayette, IN: Center for Global Trade Anal -ysis, Purdue University.
Ozawa, Terutomo. 2009. The Rise of Asia: The ‘Flying-Geese’ Theory of Tandem Growth and Regional Agglomeration. Cheltenham: Edward Elgar.
Petri, Peter A. 2012. ‘The Determinants of Bilateral FDI: Is Asia Different?’. Journal of Asian Economics 23 (3): 201–9.
Reardon, Thomas, Kevin Chen, Bart Minten, and Lourdes Adriano. 2012. The Quiet Revo-lution in Staple Food Value Chains in Asia: Enter the Dragon, the Elephant, and the Tiger. Manila: Asian Development Bank.
Rosen, Roberto, and Dominique van der Mensbrugghe. 2012. ‘Climate Change and Eco -nomic Growth: Impacts and Interactions’. International Journal of Sustainable Economy 4 (3): 270–85.
Rutherford, Thomas F. and David G. Tarr. 2002. ‘Trade Liberalization, Product Variety and Growth in a Small Open Economy: A Quantitative Assessment’. Journal of International Economics 56 (2): 247–72.
Skouias, Emmanuel, Sailesh Tiwari, and Hassan Zaman. 2010. ‘Can We Rely on Cash Transfers to Protect Dietary Diversity during Food Crises? Estimates from Indonesia’. Policy Research Working Paper 5548, World Bank, Washington, DC.
Timilsina, Govinda R., John C. Beghin, Dominique van der Mensbrugghe, and Simon Mevel. 2012. ‘The Impacts of Biofuel Targets on Land-Use Change and Food Supply: A Global CGE Assessment’. Agricultural Economics 43 (3): 315–32.
Timmer, C. Peter, Steven Block, and David Dawe. 2010. ‘Long-Run Dynamics of Rice Con -sumption, 1960–2050’. In Rice in the Global Economy: Strategic Research and Policy Issues for Food Security, edited by Sushil Pandey, Derek Byerlee, David Dawe, Achim Dober -mann, Samarendu Mohanty, Scott Rozelle, and Bill Hardy, 139–74. Los Baños, Philip -pines: International Rice Research Institute.
Tiwari, Sailesh, Emmanuel Skouias, and Maya Sherpa. 2013. ‘Shorter, Cheaper, Quicker, Better: Linking Measures of Household Food Security to Nutritional Outcomes in Bangladesh, Nepal, Pakistan, Uganda and Tanzania’. Policy Research Working Paper 6584, World Bank, Washington, DC.
USGS (US Geological Survey). 1996–2015. Mineral Commodity Summaries. Accessed 5 Febru-ary 2015. http://minerals.usgs.gov/minerals/pubs/mcs/.
Van der Eng, Pierre 2004. ‘Productivity and Comparative Advantage in Rice Agriculture in Southeast Asia since 1870’. Asian Economic Journal 18(4): 345–70.
Wickizer, V. D., and M. K. Bennett. 1941. The Rice Economy of Monsoon Asia. Stanford, CA: Stanford University Press.
Williamson, Jeffrey G. 2012. ‘Commodity Prices over Two Centuries: Trends, Volatility, and Impact’. Annual Review of Resource Economics 4: 185–206.
World Bank. 2014. Global Economic Prospects: Coping with Policy Normalization in High-income Countries. Washington DC: World Bank.
WTO (World Trade Organization). 2012. International Trade Statistics 2012. Geneva: WTO. Yu, Wusheng, Thomas W. Hertel, Paul V. Preckel, and James S. Eales. 2004. ‘Projecting
APPENDIX TABLE A1 Exogenous Projected Average Annual GDP and Endowment Growth Rates, 2007 to 2030 (% per year)
GDP
growth Population growth Unskilled labour
Skilled
labour Capital
Oil reserves
Gas reserves
Coal
reserves
Other mineral reserves
Agricultural land
Indonesia 5.75 0.83 0.87 3.73 3.88 –1.08 0.56 1.68 2.07 0.36
China 7.95 0.42 –0.06 2.75 7.32 –0.40 4.85 5.62 2.07 –0.36
India 7.24 1.06 1.28 3.92 5.56 0.24 0.00 4.93 2.07 –0.04
Rest of ASEAN 4.27 1.01 0.11 3.40 4.42 3.28 2.43 7.27 2.07 0.10
Rest of dev. Asia 3.87 1.23 –0.03 2.51 4.07 0.40 –0.84 –0.51 2.07 –0.40
Other dev. regions 3.90 1.51 0.85 3.49 3.44 2.19 3.16 3.09 2.07 0.14
All dev. regions 5.56 1.08 0.48 3.21 4.96 2.02 2.87 4.95 2.07 –0.13
Asia 6.63 0.84 0.25 2.99 6.00 0.68 1.62 5.16 2.07 –0.20
Australia 2.35 1.11 0.29 1.91 2.28 1.54 6.52 3.56 2.07 –0.59
Other HICs 1.63 0.26 –0.56 1.40 1.32 2.55 0.19 –0.89 2.07 –0.29
All HICs 1.64 0.27 –0.53 1.41 1.34 2.53 0.74 0.17 2.07 –0.29
World 3.04 0.93 –0.18 1.85 2.87 2.18 1.99 3.30 2.07 –0.18
Source: Authors’ assumptions (see text for details).