BE-69
DEVELOPMENT AND VALIDATION OF PHYSICAL CLASSROOM
LEARNING ENVIRONMENT INSTRUMENT (PCLEI) FOR SECONDARY
SCHOOL IN MALAYSIA
Nurul Jannah Amirul, Che Nidzam Che Ahmad
Faculty of Science and Mathematics, Sultan Idris Education University [email protected], [email protected]
Abstract
The purpose of this study was to develop and validate a new learning environment instrument used to measure the physical learning environment in secondary school’s classroom in Malaysia. The Physical Classroom Learning Environment Instrument (PCLEI) was developed by using a three stages approach, field-tested with 900 students and then validated. The PLCEI has 66 items allocated to six constructs: (1) furniture; (2) facilities; (3) space; (4) lighting; (5) air quality; (6) color. Each construct has a factor loading at least 0.40 and alpha reliability coefficient for constructs ranged from 0.83 to 0.98. The instrument will inform us on existing physical learning environment in secondary school’s classroom. Further effective way can be planned to overcome the existing gaps.
Keywords: Instrument, learning environment, physical aspect
INTRODUCTION
Physical component is one of main aspect in the learning environment. It encompasses the classroom, teaching and learning materials and facilities inside and outside the classroom (Che Nidzam et al., 2010). Mok (2009) also stated that school physical factors include the physical arrangement of the classroom and the school.
Good physical environment can enhance student’s focus in classroom, learning and interaction, thus improving student achievement over time (Baek & Choi, 2002; Waldrip & Fisher, 2003). The classrooms physical environment can give positive impact on the effectiveness of teaching and learning process as it can make that process occurs in a comfortable and enjoyable way (Veal & Jackson, 2005; Ahmad Fauzi, 2005). In addition, the physical environment plays an important role in ensuring students safety, reducing the risk of accidental injury and subsequently contributing to attitude, well-being, happiness and creativity of students (Australian Children's Education & Care Quality Authority, 2012). A previous study also shows that the physical environment has an important role in teaching and learning process as it can enhance students involvement in activities that promote a better understanding of concepts, problem solving abilities and attitudes towards learning (Mohd Hairy et al., 2012).
contribute in lack of studies conducted on the physical environment in the classroom is due to unfixed and inappropriate instruments to be applied in the study. Therefore, there is a need to build an instrument that has a good validity and reliability in evaluating the physical environment in the classroom in secondary schools in Malaysia. Through this study, the researchers want to develop and validate an instrument that will provide information to the authorities about the state of the physical environment in the classroom at school.
RESEARCH METHOD
This study was conducted using quantitative method. All the data were collected by using questionnaire. The target population for this research was the Malaysian’s secondary school students which is in their Form Four. The sample of respondents consisted of 900 students and fortunately this value was exceed as suggested. Krejcie and Morgan (1970) suggested 384 of respondents were needed as sample for one million students.
The development of the PCLEI used a three-stages approach. These steps were used in the study by Walker and Fraser (2005). Stage one include the identification of salient physical learning environment construct, stage two involve writing individuals items within the constructs and preliminary study while stage three perform the field testing.
Stage one consist four steps which are reviewing literature related to physical learning environment in the classroom, reviewing previously developed learning environment instruments for constructs that could be modified for the PCLEI, conducting a discussions with experienced teachers and lecturers to obtain their opinions and lastly classifying newly developed constructs and developing a set of preliminary constructs. Stage two involving three steps which are both adapting items used in previously validated learning environment questionnaires and developing new items for the constructs identified, subjecting the entire set of items to face validation by seven panel of experts and pilot testing. Meanwhile, stage three including two steps which are field testing the draft instrument with a large sample from the target population and conducting the factorial analysis.
Overall, PCLEI consist of six constructs including furniture, facilities, space, lighting, indoor air quality and color. The constructs and examples of items in the PCLEI were described in Table 1 below.
Table 1: Physical Classroom Learning Environment Instrument (PCLEI) Scale Description Item per
scale
Sample Item
Furniture Extent to which the furniture’s in the classroom are suitable
31 The tables in the classroom are safe to be used
Facilities Extent to which the classroom is supported by the suitable facilities
56 The classroom is occupied by suitable facilities which can help learning process
BE-71 Indoor air
quality
Extent to which the indoor air quality in the classroom is suitable
20 Enough window present in the classroom to increase the efficiency of air flow
Color Extent to which the color used in the classroom is suitable
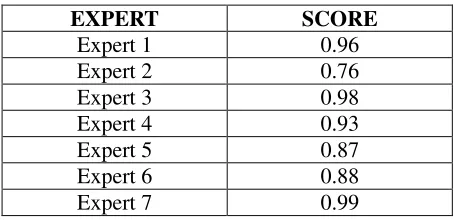
Table 2.0: Content validity of the experts based on Cohen Kappa’s value
Reliability
In the development of PCLEI, each construct was assessed for internal consistency. This analysis was conducted to serve two purposes which are to refine the PCLEI constructs and to provide evidence regarding reliability and validity of the refined constructs (Walker and Fraser, 2005). Then, items which not highly correlated with their respective construct were removed and data were reanalyzed until all the items with lowest item-scale correlations were removed and the alpha coefficient was maximized. Analysis of the refined data set provided evidence to support the overall reliability of the refined constructs.
Table 3.0: Scale Reliability Using Cronbach’s Alpha Coefficient for PCLEI
Factorial Analysis
Factorial analysis was conducted in order to measure the validity of the construct in the PCLEI. Factor analysis also provided information about whether items within a given construct are measuring that construct and no other construct. According to Kamisah et al. (2006) there are various methods or approach that can be used in the suggested the validity of an instrument. The methods can be classified into three main categories, namely the validity of content, criteria and constructs. Then, after considering the purpose of items construction that has produced, researcher would like to focus on construct validity. This is based on the continuation of the study by Nunally (1967) and Messick (1980) in Kamisah et al. (2006) stated that the construct validity was more justified than other procedures in the measurement of a test.
Construct validity was investigated by using principal component factor analysis with Varimax rotation and Kaiser normalization. Prior to factor analysis, Bartlett’s Test of Sphericity, which provide information whether there is a relation between Kaiser-Meyer-Olkin (KMO) coefficient and variables, was applied to test whether the data were suitable for factor analysis. The sample should be adequate since the size of the sample affects the results of factor analysis. Pallant (2001) suggested that KMO should be greater than 0.60 so factor analysis could be applied on the data. In this study, KMO value was 0.95, which fell in intended range. Besides, the result of Bartlett’s Test of Sphericity was significant [Barlet Test=44140.990, df=2145, (p<.000)]. The result of KMO and Bartlett’s Test of Sphericity indicated that the adequate sample size was provided in this study and factor analysis could be carried out on these data.
In this study, six constructs were originally developed for the PCLEI field test and, after factor analysis, the same six constructs remained; furniture, facilities, space, lighting, indoor air quality and color. This construct could be remained based on the result of Eigen values which greater than 1.0. Kaiser criterion which recommends that researchers select constructs with Eigen values greater than 1.0. Besides, this six constructs explained 56.29% of the total variance. For social sciences, variances rates between 40% and 60% are accepted adequate (Kutluca et al., 2010).
In the factor analysis, items with load factor greater than 0.40 were taken. Thus, eighty items that have load factor below 0.40 were removed. Finally, this instrument ended up with 66 items. The first construct, furniture had 14 items and the load values of these items varied between 0.48 and 0.65. The second construct, facilities had 6 items and the load values varied between 0.93 and 0.96. The third construct, space had 16 items and varied between 0.57 and 0.74. The fourth construct, lighting had 6 items and load values varied between 0.47 and 0.65. The fifth construct, indoor air quality had 12 items and the load values varied between 0.43 and 0.75. Finally the last construct, color had 12 items and the load values varied between 0.55 and 0.78. Table 4.0 presents items of each construct and their factor loads.
Scale Number of items Reliability
Furniture 21 0.90
Facilities 28 0.97
Space 16 0.98
Lighting 11 0.84
Indoor air quality 20 0.89
BE-73
Table 4.0 Factor Loadings For A Refined Version of the PCLEI Factor Loading
Item Furniture Facilities Space Lighting Indoor Air Quality
Color
1 .524
2 .596
3 .624
4 .639
5 .635
6 .593
7 .646
8 .509
9 .632
10 .481
11 .538 .
12 .571
13 .481
14 .497
15 .956
16 .954
17 .954
18 .943
19 .948
20 .931
21 .698
22 .737
23 .726
24 .722
25 .573
26 .679
27 .646
28 .676
29 .600
30 .589
31 .592
32 .705
33 .704
34 .734
35 .700
36 .687
38 .596
39 .474
40 .624
41 .647
42 468
43 .630
44 .425
45 .575
46 .565
47 .592
48 .746
49 .635
50 .702
51 .663
52 .618
53 .699
54 .691
55 .578
56 .631
57 .738
58 .771
59 .778
60 .755
61 .721
62 .645
63 .618
64 .548
65 .555
66 .572
The latest version of PCLEI consist of 6 construct and 66 items. Based on the analysis conducted, this instrument found to have a high reliability and also a good construct validity which could be used in the study of the classroom physical learning environment. Besides, PCLEI also had its own uniqueness as it contained the physical aspects of the learning environment that might affect the student learning. These physical aspects were chosen based on the results of previous studies and discussion with experienced lecturer and teachers. PCLEI also had the advantage of being easily administered as well as answered by the respondents as it used a simple word and easy to be understood. In addition, it’s also economy of use in terms of saving time and cost.
BE-75
CONCLUSION AND SUGGESTION
This paper has reported in detailed the development and validation procedure taken in order to design the Physical Classroom Learning Environment Instrument (PCLEI) to access the physical classroom learning environment in secondary school in Malaysia. This required several steps that needed to be followed in order to achieve high reliability and validity of this instrument. The development of this instrument was an addition to the physical classroom learning environment study. The finding of this study confirmed the validity and reliability of the PCLEI showing that it is an useful instrument for its evaluation.
Bibliography
Nurul Jannah Amirul is a master student in Biologi Education in Sultan Idris Education University. She’s from Department of Biology, Faculty Science and Mathematics. She was graduated from University Malaysia Terengganu in Biological Sciences.
Dr. Che Nidzam Che Ahmad is a lecturer at Sultan Idris Education University. She’s from Department of Biology, Faculty Science and Mathematics.
REFERENCES
Ahmad Fauzi, W. (2005). Pengurusan sumber fizikal IPT: Pengurusan ruang. Jurnal Teknologi, 43(E), 15-28. Universiti teknologi Malaysia.
Australian Children’s Education & Care Quality Authority. 2012. Quality Area 3:Physical Environment.http://acecqa.gov.au/storage/1DE_03_National%20Quality%20Standard _v8_Secn2.pdf
Baek, Sun-Guen & Choi, Hye-Jong. (2002). The relationship between student’s perceptions of classroom environment and their academic achievement in Korea. Asia Pacific Education, 3, 125-135.
Che Nidzam, C.A., Kamisah Osman, & Lilia Halim. (2010). Hubungan ramalan persekitaran pembelajaran makmal sains dengan tahap kepuasan pelajar. Jurnal Pendidikan Malaysia, 35(2), 19-30.
Cohen, J. (1968). Weighted kappa: nominal scale agreement with provision for scaled disagreement or partial credit. Psychological Bulletin, 70, 213-220.
George, D., & Mallery, P. (2001).SPSS for Windows step by step: A simple guide and reference 10.0 update (3rd ed.). Toronto, Canada: Allyn and Bacon.
Kamisah, O., Lilia, H. & T. Subahan, M.M. (2006). Pembinaan Instrumen untuk Mengenal Pasti Tanggapan Keperluan Semasa Guru-guru Sains di Malaysia. Jurnal Pendidik dan Pendidikan, 21, 101-113.
Krejcie, R.V. & Morgan, D.W. (1970). Determining Sample Size for Research Activities. Educational and Psychological Measurement, 30, 607-610.
Kutluca, T. Arslan, S. & Ozpinar, I. (2010). Developing a scale to measure information and communication technology utilization levels. Journal of Turkish Science Education, 7(4), 37-45.
Noh. (2012). Kesan Perubahan Iklim Terhadap Keselesaan Terma. International Conference on Innovation and Technology for Sustainable Built Environment, Uitm Manjong, Perak.
Mok, S.S. (2009). Pengurusan Bilik Darjah dan Tingkah Laku. Edisi Pertama. Selangor, Malaysia: Penerbitan Multimedia Sdn. Bhd.
Pallant, J. (2001). SPSS Survival Manual: A step by set guide to data analysis using SPSS for Windows. First Edition. Buckingham: Open University Press.
Veal, W.R., & Jackson, Z. (2005). Developing a primary science methods classroom. International Journal of Science and Mathematics Education, 4, 195-213.
Waldrip, B., & Fisher, D. (2003). Identifying exemplary science teachers through their classroom interactions with students. Learning Environments Research: An International Journal, 6(2), 157-174.
Walker, S.L., & Fraser, B.J. (2005). Development and Validation of an Instrument for Assessing Distance Education Learning Environments in Higher Education: The distance Education Learning Environments Survey (DELES). Learning Environment Research, 8, 289-308.doi: 10.1007/s10984-005-1568-3.