October-December 2015 Page 1
Executivemary
CHART OF
ACCOUNT
COA - Vol. 12 NATIONAL DIRECTORATE OF ECONOMIC POLICY DIRECTORATE GENERAL FOR STATE FINANCES
DILI - 2015
Quarterly Fiscal Bulletin
Chart of Accounts (CoA)
October
–
December 2015
Executive Summary
October-December 2015 Page 2 1. Overall Fiscal Position (Oil and Non-oil)
Table 1: Overall Fiscal Position1
2015 Act Q1 2015 Act Q2 2015 Act Q3 2015 Act Q4 Total Actual
A. Total Expenditure 217.5 258.2 351.2 529.8 1,356.6
Recurrent Expenditure 214.0 210.2 284.1 340.9 1,049.1 Capital Expenditure 3.5 48.0 67.1 188.9 307.5
B. Total Revenue 386.5 431.9 334.4 322.8 1,475.7
Non oil Revenue 34.2 41.6 37.5 56.8 170.1 Oil Revenue 352.3 390.3 296.9 266.0 1,305.6
Petroleum Fund Gross Receipts 273.2 294.7 218.3 192.7 978.9
Investment Income 79.1 95.6 78.6 73.3 326.7
Surplus of (A-B): 169.0 173.7 -16.8 -206.9 119.1
Financing -169.0 -173.7 16.8 206.9 -119.1
Foreign Loans 0.6 6.7 5.3 12.2 24.8
Net Purchase of Financial Assets -133.3 -156.3 -98.9 376.8 -11.6 Use of Cash Balance* -36.4 -24.1 110.3 -182.1 -132.3
Petroleum Fund and General Government
Notes: Net Purchase of Financial Assets and Investment Income excludes the changes in market value of financial assets in the Petroleum Fund. Recurrent Expenditure is divided into Salary, Goods and Services, and Public Transfers
*Use of Cash Balance refers to the Government Accounts only.
By the end of 2015, total expenditures for the General Government of Timor-Leste (GGoTL) and the Petroleum Fund (PF) reached $1,356.6 million. $1,049.1 million was spent on recurrent expenditures while $307.5 million was spent on capital expenditures.2
At the close of 2015, total revenues amounted to $1,475.7 million. From petroleum revenues, $1,305.6 million were recorded and $170.1 million were obtained from non-oil revenues. PF revenues include PF gross receipts (taxes, royalties and first tranche petroleum) and investment income (dividends, interest and trust income, but excludes fair value gains and losses on profit/loss).3
The total surplus stood at $119.1 million by the 31st December 2015, which is calculated as total revenue minus total expenditure. This compares to a surplus of $927.3 million in 2014.
Financing is broken down into three components. The GGoTL made use of $132.3 million from the cash balance, $24.8 million was received from loans and $11.6 million was used to purchase
1
All data in this document refers to unaudited accounts and is thus subject to change.
2
This includes expenditure from loans under capital and development.
3
October-December 2015 Page 3 financial assets in the PF. The loan data has not been audited and the numbers are subject to change.
2. Ge eral Gover e t’s Fiscal Positio
Table 2: Non-Oil Fiscal Position
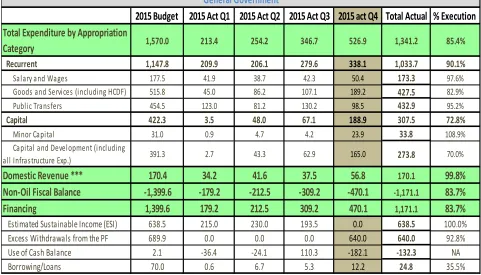
2015 Budget 2015 Act Q1 2015 Act Q2 2015 Act Q3 2015 act Q4 Total Actual % Execution
Total Expenditure by Appropriation
Category 1,570.0 213.4 254.2 346.7 526.9 1,341.2 85.4%
Recurrent 1,147.8 209.9 206.1 279.6 338.1 1,033.7 90.1%
Salary and Wages 177.5 41.9 38.7 42.3 50.4 173.3 97.6%
Goods and Services (including HCDF) 515.8 45.0 86.2 107.1 189.2 427.5 82.9%
Public Transfers 454.5 123.0 81.2 130.2 98.5 432.9 95.2%
Capital 422.3 3.5 48.0 67.1 188.9 307.5 72.8%
Minor Capital 31.0 0.9 4.7 4.2 23.9 33.8 108.9%
Capital and Development (including
all Infrastructure Exp.) 391.3 2.7 43.3 62.9 165.0 273.8 70.0%
Domestic Revenue *** 170.4 34.2 41.6 37.5 56.8 170.1 99.8%
Non-Oil Fiscal Balance -1,399.6 -179.2 -212.5 -309.2 -470.1 -1,171.1 83.7%
Financing 1,399.6 179.2 212.5 309.2 470.1 1,171.1 83.7%
Estimated Sustainable Income (ESI) 638.5 215.0 230.0 193.5 0.0 638.5 100.0%
Excess Withdrawals from the PF 689.9 0.0 0.0 0.0 640.0 640.0 92.8%
Use of Cash Balance 2.1 -36.4 -24.1 110.3 -182.1 -132.3 NA Therefore, $132.3 million was added to the Cash Balance.
2.1 General Government Expenditures
At the close of 2015, expenditures amounted to $1,341.2 million, which represented 85.4% of total budgeted expenditures for the year.
2.1.1. Expenditure by Appropriation Category
October-December 2015 Page 4
Recurrent expenditures are divided into:
Salary and Wages totalled $173.3 million at the close of 2015, reaching an execution rate of 97.6%. This is 6.7% higher than the $162.4 million incurred in the same period of 2014.
Goods and Services reached $427.5 million by the close of 2015, representing an execution rate of 82.9%. Expenditures to date in 2015 decreased by 8% compared to the $463.5 million spent in 2014. This was mainly due to a decrease in Fuel for Generators (14.2% decrease), Professional Services (24.1% increase) and Operation Expenses (25.2% decrease). Expenditures on human capital through the HCDF reached $35.2 million, 10% lower than those recorded in 2014.
Public Transfers totalled $432.9 million by the close of 2015 and was therefore the largest category of recurrent expenditures.This total represented an execution of 95.2%. This expenditure was 46.8% higher than the $291.7 million recorded by the close of 2014.This increase was mostly due to a rise in public grants, in particular to the Special Administrative Region of Oe-Cusse Ambeno and the Special Zone of Social Market Economy of Oe-Cusse Ambeno and Ataúro. Overall, public grants doubled by the close of 2015 compared to 2014.
Capital expenditures are composed of:
Minor Capital totalled $33.8 million by the close of 2015, which represented an execution rate of 108.9%.Total minor capital expenditure by the end of 2015 was 40.0% lower than those recorded by the same date of 2014. This was largely due to a decrease in the purchase of vehicles by 35.7%.
Capital & Development was $273.8 million by the end of the close of 2015, thus presenting an execution rate of 70.0%. Expenditure in the Infrastructure Fund in particular was 27.0% lower by the close of 2015, compared to 2014, reaching $240.5 million by the 31st December 2015. This is partly due to the phasing down of the electricity project and the redirection of funding for Oe-Cusse regional development through the channel of public transfers.
The Oe-Cusse Efect
In 2015 the special administrative region of Oe-Cusse received greater budget autonomy, with its entire budget, both recurrent and capital, being disbursed as a transfer. In 2014 only the recurrent budget was disbursed as a transfer, which capital spending being founded through the Infrastructure Fund.
October-December 2015 Page 5 2.2 Non-oil Revenues
Table 3: Non-oil Revenues
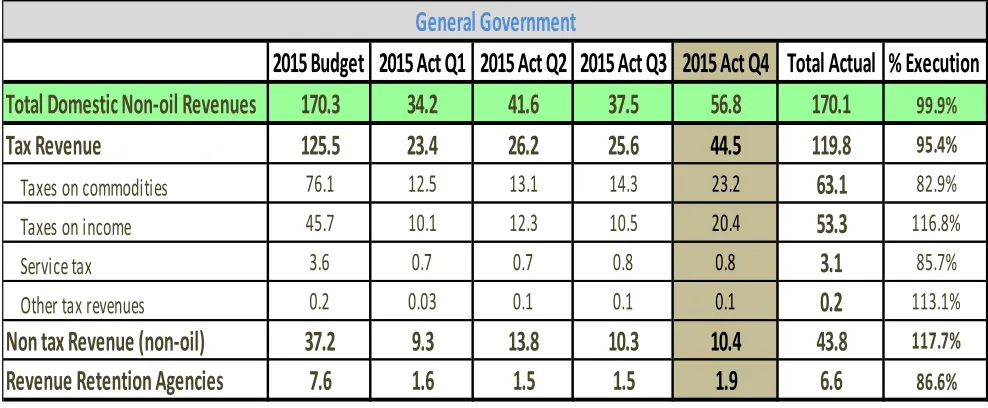
2015 Budget 2015 Act Q1 2015 Act Q2 2015 Act Q3 2015 Act Q4 Total Actual % Execution
Total Domestic Non-oil Revenues
170.3
34.2
41.6
37.5
56.8
170.1
99.9%Tax Revenue
125.5
23.4
26.2
25.6
44.5
119.8
95.4%Taxes on commodities 76.1 12.5 13.1 14.3 23.2
63.1
82.9%Taxes on income 45.7 10.1 12.3 10.5 20.4
53.3
116.8%Service tax 3.6 0.7 0.7 0.8 0.8
3.1
85.7%Other tax revenues 0.2 0.03 0.1 0.1 0.1
0.2
113.1%Non tax Revenue (non-oil)
37.2
9.3
13.8
10.3
10.4
43.8
117.7%Revenue Retention Agencies
7.6
1.6
1.5
1.5
1.9
6.6
86.6%General Government
Non-oil revenue receipts in recent years have been increasing and the government is planning further reforms to increase non-oil revenue collections going forward. Total domestic non-oil revenues were $170.1 million by the close of 2015, which represented 99.9% of the total revenue budgeted for the year. This was divided into:
Tax Revenue, which was the largest category and can be divided into:
Taxes on commodities were the largest tax category, reaching $63.1 million at the close of 2015 (5.4% lower than the $66.7 million collected in 2014). This is mainly due to the decrease in the international price of oil and the appreciation of the US dollar, which has resulted in lower sales tax and import duty collections.
Taxes on income totalled $53.3 million at the end of 2015, 25.9% lower than the $72.0 million collected in 2014. This was 116.8% of the total budgeted for the year.
Service tax decreased by 3.1% from the $3.2 million collected by the end of the fourth quarter 2014, totalling $3.1 million by the 31st December 2015.
Non-tax revenue totalled $43.8 million by the close of 2015, 117.7% of the total budgeted for the year.
October-December 2015 Page 6 3. Financing