Procedia - Social and Behavioral Sciences 169 ( 2015 ) 296 – 302
1877-0428 © 2015 The Authors. Published by Elsevier Ltd. This is an open access article under the CC BY-NC-ND license (http://creativecommons.org/licenses/by-nc-nd/4.0/).
Peer-review under responsibility of Center for Innovation, Entrepreneurship, and Leadership (CIEL), School of Business and Managements (SBM), Institut Teknologi Bandung (ITB).
doi: 10.1016/j.sbspro.2015.01.313
ScienceDirect
The 6th Indonesia International Conference on Innovation, Entrepreneurship and Small Business,
12
–
14 August 2014
ICT Adoption, Skill and Use Differences among Small and Medium
Enterprises Managers Based on Demographic Factors
Nurhidayati Kusumaningtyas
aand Dyna Herlina Suwarto
b*
aBalai Diklat Industri Regional IV Yogyakarta, Yogyakarta, Indonesia bUniversitas Negeri Yogyakarta, Yogyakarta, Indonesia
Abstract
The Small and Medium Enterprises in economics are able to develop by Information Communication Technology (ICT) adoption. The adoption is determined by many factors, one of them is demographic. This research purpose is to examine the demographic factor differences (age, gender and education level) in ICT (computer and internet) adoption, skill and use among small and medium enterprises (SMEs) managers at Province Daerah Istimewa Yogyakarta. The research sample is the SMEs that guidance by Tenaga Penyuluh Lapangan (TPL) Badan Diklat Industri Region IV Yogyakarta as 196 SMEs managers. The analysis is using Manova Test to find out the age and education level meanwhile the gender variable is investigated by Independent Sample T-Test. The research evidence found that there is difference of ICT adoption, skill and use based on age and education level. Meantime there is no difference according to the respondent gender.
© 2014 The Authors. Published by Elsevier Ltd.
Peer-review under responsibility of Center for Innovation, Entrepreneurship, and Leadership (CIEL), School of Business and Management (SBM), Institut Teknologi Bandung (ITB).
Keywords: ICT Skill; ICT use; ICT adoption; age; education level; gender
* Corresponding author
E-mail address: [email protected]
© 2015 The Authors. Published by Elsevier Ltd. This is an open access article under the CC BY-NC-ND license (http://creativecommons.org/licenses/by-nc-nd/4.0/).
1.Introduction
The strength of small medium enterprises was exhibit in report of Kementerian Koperasi dan Usaha Mikro, Kecil, dan Menengah (Data Statistik UMKM, 2011). The report said that in 2011, about 99,99% of Indonesian business is consist of SMEs only about 0,01% is big business. Those SMEs employ about 99,40 million workers that affected for about 57,12% of Indonesian Gross Domestic Product.
The competitiveness of SMEs are able to develop using ICT adoption in order to increase business transformation, information exchange efficiency and effectively (Rahmana, 2009), however the ICT adoption is not simple process. OECD Survey (1993) remarks that the ICT adoptions among SMEs are considered low. Based on research institution AMI Partners, at 2000 only about 20% of Indonesia SMEs have (Roosdhani, Wibowo, and Widiastuti, 2012).
The ICT adoption process is complex, moreover it’s determined by many factors one of them is demographic. Kumar, Rose, &D’Silva (2008) said that gender, age, and training were influence the computer and Internet adoption. Study that is conducted by Muinde (2009) found that ICT adoption at Kenya was determined by demographic factor as age, gender, education, welfare, and literacy level.
So that to find the empirical evidence, this research purpose is to find ICT adoption, skill and use differences among SMEs managers at Province of Daerah Istimewa Yogyakarta based on their demographic factors.
2.Literature Review
2.1.ICT adoption level differences based on demographic factor
ICT adoption defines as willingness to take the new innovation related to computer and internet. Roger (1995) divide innovation adopter into five categories: (1) innovator, (2) early adopter, (3) early majority, (4) late majorityand (5) laggard.
Some of prior research stated that demographic factors such as age, gender and education level determine ICT adoption. The younger people are adopt ICT easily compare to the oldest generation (Budiono, 2004; Nilsson, 2005; Indarti & Rostiani, 2008; Kumar, Rose, & D’Silva, 2008; Harrison & Rainer, 1992; Ongori & Migiro 2011). Not only age, gender variable also important. Earlier research revealed that the males are dominated ICT adoption (Maleka, 2011). According to Olatokun (2009) education level that are related with technology uses gap.
Based on the literature, it can develop some of hypotesis as below. H1a. There is ICT adoption difference based on age
H1b. There is ICT adoption difference based on gender H1c. There is ICT adoption difference based on education level.
2.2. ICT skill differences based on demographic factor
ICT skill consists of basic, computer and internet skill in term of operating, processing, changing, accessing and using software and hardware of computer and internet devices (Hashim, 2007). Previous study exhibit that age level associated with computer skill. The younger generation more computer skilfull rather than the older (Harrison & Reiner, 1992). In term of gender, women were considered less competence rather than men (Alazam, Bakar , Hamzah, & Asmiran, 2012). As education level represent the ICT skill so that the lower education level has lower ICT skill rather than the higher level (Olatokun, 2009).
Corespond to previous research, some hypothesis were initiated as below. H2a. There is ICT skill difference based on age
2.3. ICT actual use differences based on demographic factor
According to Hashim (2007) ICT actual use interpret as the application of computer and internet for working. As stated by World Bank(1998), age, gender, education level has significant effect on ICT use in our daily life. Earlier studies said that there is positive relationship between age and computer use because the older people has limited knowledge and training about computer (Harrison & Reiner, 1992; Lam, 2000; Liang dan Chao, 2002; Elsadaani, 2013). The researcher conducted by Korean Ministry revealed that women and men have different tendency to apply ICT (Sophia & Hafkin, 2007). Preceding investigation found that education level is one determinant factor to predict ICT adoption and actual use (Pijpers, Bemelmans, Heemstra, & van Montfort, 2001 ; Zhu & He, 2000; Valletta & MacDonald, 2003; Olatokun, 2009).
The hypothetical statements were arrange as below. H3a. There is ICT use difference based on age H3b. There is ICT use difference based on gender H3c. There is ICT use difference based on education level.
3.Research Method
3.1. Population and Sample
The population of this research is SMEs that guidance by Tenaga Penyuluh Lapangan Industri Kecil Menengah (TPL IKM) Kementerian Perindustrian as well as 397 SMEs. Based on Bartlet determinat sample size, the researcher choose 196 respondents using simple random sampling method by software SPSS.
3.2.Data Analysis Method
In order to examine the data researcher is using multivariate analysis. The age and education level variables were investigated using Manova Test meanwhile the gender variable was calculated using Independent T-Test (Margono, 2004).
4.Result and Discussion
4.1. Demographic Characteristic
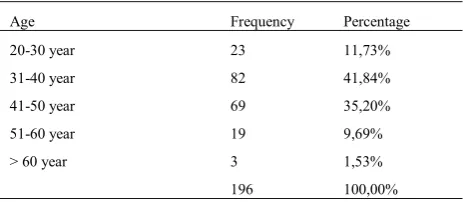
The demographic characteristic of respondent will describe below. The research respondents consist of 151 (77,04%) male and 45 (22,96%) female. Furthermore, the age and education level will exhibit at table 1 and 2 below.
Table 1. Respondent Demographic Characteristic based on Age
Age Frequency Percentage
20-30 year 23 11,73%
31-40 year 82 41,84%
41-50 year 69 35,20%
51-60 year 19 9,69%
> 60 year 3 1,53%
Table 2. Respondent Demographic Characteristic based on Education Level
Education Level Frequency Percentage
Junior High School 34 17,35%
Senior High School 134 68,37%
Diploma 3 4 2,04%
Undergraduate 24 12,24%
196 100,00%
4.2. Multivariate Prerequisite Test
Before conducting multivariate test, it’s necessary to having prerequisite test to evaluate data distribution using normality test (Kolmogorov-Smirnov value), covariance among group (Box’s Test Equality and Levene Test) and correlation test among dependen variables (Bartlett’s Test).
Fig.1. Kolmogorov – Smirnov Value
Figure 1 exhibit Kolmogorov-Smirnov value below 0.05 so that the data is not normally distributed. However, the analysis is still continued because The Assumption of Manova can use equality of covariance test by looking at Box Test Equality and Lavene 'test. Box Test Equality and Lavene 'test showed insignificant as seen at Table 3 and Table 4. Thus H0 stating that there is no difference between groups is accepted. So that Manova analysis can be continued.
Table 3. Box Test Equality of Covariance Matricesa
Box's M 98.364
F 1.303
df1 60
df2 1980.802
Sig. .061
Table 4. Levene's Test of Equality of Error Variancesa
F df1 df2 Sig.
ICT A 1.220 25 170 .228
ICTS 2.118 25 170 .003
ICTU .809 25 170 .727
same variation. According to Hair, Bill Black, & Rolph (2007), it could be due to the large sample size in each group. Because the overall results (Box’s Test Equality) are the same then the analysis can be continued.
The next step is the correlation between dependent variable testing to see whether each of the dependent variables is different. In this study, the correlation between the dependent variable is done by considering at the results of Bartlett's Test. P value indicates the significance value of less than 0.005, so it can be concluded that the inter-dependent variable relationship does has differences each other as seen at Table 5. So that Manova analysis can be continued.
Table 5. Bartlett's Test of Sphericitya
Likelihood Ratio .000
Approx. Chi-Square 201.149
df 5
Sig. .000
4.3.Multivariate Test
Multivariate test is used to test whether any independent variable affects the dependent variable as a whole, where the dependent variable has two or more factors. The test results can be seen by using the Wilk's lambda value. The test result shows that there is a relationship between the dependent and independent variables which is shown in the Wilk's lambda value on significance below 0.055. Then, Test Between Subject Effects and Post Hoc Test was done to test the effect of univariate ANNOVA for each factor on the dependent variable.
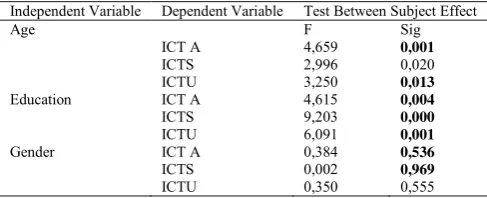
Table 6. Test Between Subject Effect
Independent Variable Dependent Variable Test Between Subject Effect
Age F Sig
Result of F Value Test (independent variables-age) on the dependent variable (ICT Skill, ICT use, and ICT Adoption) are 2,996; 3,250; and 4, 659. The result of the study also shows that there are differences in ICT Skills, ICT Use, and ICT Adoption in the age factor with a value of (0.020; 0.013; 0.001) with a p value <0.05.
Result of F Value Test (independent variables-education level) on the dependent variable (ICT Skill, ICT Sse, and ICT Adoption ) are 9.203; 6.091; 4,615 and overall there are significant differences in terms of ICT skills , ICT use), and ICT Adoption in the category of education (0,000; 0.001 and 0.004) p value <0.05.
Table 7. Post Hoc Test
ICTA Tukey HSD Scheffe benferonni
Dependent
The result of Tukey Test, Schefe and Benferoni shows that there are differences in ICT skills, ICT Use and ICT Adoption for each category of education level: junior high school (category 1), senior high school (category 2), diploma (category 3) and undergraduate (category 4). On the dependent variable (ICT Skill) there are different categories of educational level between (1) and (2), moreover between (2) (4). On the dependent variable of (ICT use) there are different categories of educational level between (1) and (2), (2) and (4). At the ICT Adoption category there are different levels of education between (1) and (2).
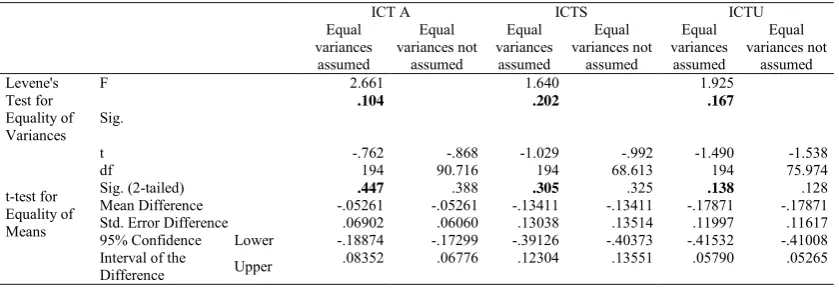
4.4. Independent T-Test Analysis
Analysis of T Test is used to test dependent variable which has two group such as gender. Therefore gender variable is tested by using independent sample t-test to find differences between groups (post hoct) will not be visible on the Manova test. The result of the independent sample t-test on gender can be seen by using the t-value equal variance assumed. In this study the value of t for the variable ICT Skill, ICT Use, and ICT adoption with the level of significance (0.447; 0.305 and 0, 138). The data can be interpreted that there is no difference in the gender category of the ICT skills, ICT Use and ICT Adoption with p value <0.05.
Table 8. Independent Sample T Test
ICT A ICTS ICTU
Std. Error Difference .06902 .06060 .13038 .13514 .11997 .11617
95% Confidence
The research intention is to reveal the ICT adoption level, skill and use differences based on demographic factors as age, gender and education level. Manova Test was performed to analyze age and education level variable meanwhile the gender factors was examined using Independent Sample T-Test. The data analysis revealed that there is difference of ICT adoption, skill and use based on age and education level. Meantime there is no difference according to the respondent gender.
References
Alazam, Abu-Obaidah.,Bakar, A. R.,Hamzah, R & Asmiran, S (2012). Teachers’s ICT Skills and ICT Integration in the Classroom: The Case of Vocational and Technical Teachers in Malaysia. Creative Education 2012. Vol.3, Supplement, 70-76
Budiono Edi, Akhmad (2004). Pengaruh Faktor Demografi dan Personality terhadap Keahlian dalam End-User Computing di Jawa Tengah.
Tesis. Magister Akuntansi Program Pasca SarjanaUniversitas Diponegoro, Semarang
Elsaadani, Mohamed Abdelaziz (2013). Exploring the Relationship between Teaching Staff' Age and Their Attitude towards Information and Communications Technologies (ICT). International Journal of Instruction January 2013. Vol.6, No.1
Hair, Joseph F., Bill Black, Barry Babin, & Rolph E. Anderson., (2007) Multivariate Data Analysis Sixth Edition. Pearson Education
Harrison, Allison W & Rainer, R.Kelly Jr (1992). The Influence of Individual Differences on Skill in End-User Computing. Journal of Management Information Systems I Summer 1992, Vol. 9, No. 1, pp. 93-111
Hashim, Junaidah (2007). Information Communication Technology (I C T) Adoption Among SME Owners in Malaysia. International Journal of Business and Information Volume 2, Number 2, December
Indarti, Nurul & Rostiani, Rokhima (2008). Intensi Kewirausahaan Mahasiswa: Studi Perbandingan Antara Indonesia, Jepang dan Norwegia.
Jurnal Ekonomika dan Bisnis Indonesia, Vol. 23, No. 4, Oktober 2008.
Kumar, N., Rose, R. C., & D’Silva, J. L. (2008). Predictors of Tech-nology Deployment Among Malaysian Teachers. American Journal of
Applied Sciences, 5 (9), 1127-1134.
Lam, Y. (2000). Technophobia or technophilia? A preliminary look at why second language teachers do or do not use technology in their classrooms. Canadian Modern Language Review, 56(93), 389-420.
Liang, M. & Chao, J. (2002). Investigating into the Internet literacy of elementary and junior high school teachers in Taiwan. World Transactions on Engineering andTechnology Education, 1(1), 129-131
Maleka, Mbombo Bruce Mokebe (2011). A Gender Based Analysis of ICT Adoption and Usage in South Africa. A research report. Faculty of Management, University of the Witwatersrand.
Margono. 2009. Metode Penelitian Pendidikan. Jakarta : Pustaka Umum
Muinde, Florence NzisaNzwilli (2009). Investigation of Factors Affecting The Adoption of Information and Communication Technologies For Communication of Research Output in Research Institution in Kenya. Thesis. School of Information Management, Victoria University of Wellington, New Zealand.
Nilsson, Daniel. 2005. A cross-cultural comparison of self-service technology use. European Journal of Marketing, 41(3/4), pp: 367-381. Olatokun, Wole Michael (2009). Analysing Socio-Demographic Differences in Access and Use of ICTs in Nigeria Using the Capability
Approach. Issues in Informing Science and Information Technology Volume 6, 2009
Ongori, Henry dan Migiro, Stephen (2011). Understanding The Drivers of Information and Communication Technologies (ICTs) Adoption By Kenyan Small and Medium Enterprises (SMEs). International Journal of Management Research and Review Vol 1, August
Pijpers, G. G. M., Bemelmans, T. M. A., Heemstra, F. J., & van Montfort, K. A. G. M., (2001). Senior executives' use of information technology.
Information and Software Technology, v. 43, no. 15, p. 959-971.
Rahmana, Arief (2009). Peranan Teknologi Informasi dalam Peningkatan Daya Saing Industri Kecil Menengah. Seminar Nasional Aplikasi Teknologi Informasi 2009
Rogers, Everet.M. (1995). Diffusion of Innovations 4th Edition. New York: Free Press
Roosdhani, Mohamad Rifqy.,Wibowo, Purwo Adi & Widiastuti, Anna (2012). Analisis Tingkat Penggunaan Teknologi Informasi dan Komunikasi pada Usaha Kecil Menengah di Kab. Jepara. Jurnal Dinamika Ekonomi dan Bisnis Vol.9 No.2 Oktober 2012.
Huyer, Sophia & Hafkin, Nancy J (2007). Women and Gender in ICT Statistics and Indicators forDevelopmen. Information Technologies and International Development Volume 4, Number 2, Winter 2007
Valletta, R., & MacDonald, G. (2003). Is there a digital divide? FRBSF Economic Letter, Federal Reserve Bank of San Francisco, Issue 5, December 26.
World Bank. (1998). World development report 1988/99: Knowledge for development. The International Bank for Reconstruction and Development/The World Bank: Oxford University Press; 50pp
Zhu, J. J. H., and He, Z., (2000). Perceived characteristics, perceived needs, and perceived popularity-Adoption and use of the Internet in China.