THIS REPORT CONTAINS ASSESSMENTS OF COMMODITY AND TRADE ISSUES MADE BY
USDA STAFF AND NOT NECESSARILY STATEMENTS OF OFFICIAL U.S. GOVERNMENT
POLICY
Date:
GAIN Report Number:
Approved By:
Prepared By:
Report Highlights:
Japanese beef and pork production is projected to remain flat in 2017 and 2018. Following unexpected
beef consumption growth in the first half of 2017, an upward trend in consumption and imports is
expected to hold through 2018. Pork consumption follows a steady trend upward, with flat production
leading to strong import demand. Import competition is expected to continue to intensify in the coming
years.
Kakuyu Obara, Agricultural Specialist
Alexander Blamberg, Agricultural Attaché
2017 Market Situation Update and 2018 Outlook
Livestock and Products Annual
Japan
JA7110
9/20/2017
Executive Summary:
Post projects flat domestic beef production in 2017 and 2018 with modestly heavier carcasses offsetting
slightly lower total cattle slaughter. Post has revised projections for total beef consumption and imports
in 2017 substantially upward, estimating that consumption growth in the first half of the year will push
annual totals higher. However, second half growth may be moderated by changes in import patterns
due to the implementation of the frozen beef safeguard. Year ending beef stocks are projected lower as
the frozen beef safeguard may make it difficult for importers to replenish stocks. High beef
consumption is expected to continue through 2018 due to sustained foodservice and ready-to-eat home
meal business demand.
Foodservice and ready-to-eat meal demand is likewise projected to drive pork consumption steadily
upward in 2017. Flat domestic swine production will lead to increased imports, although competition in
the chilled market is expected to intensify. An increase in frozen pork imports for processing will help
replenish stocks. The European Union continues to remain a leading player in the frozen pork market
despite a slowdown in first half imports. Prevailing dynamics in the pork market are projected to hold
through 2018, though consumption may be moderated by cross-commodity competition with beef and
chicken, particularly as the effects of the frozen beef safeguard continue to reverberate. Pork stocks are
projected to continue gradually expanding in 2017 and 2018.
Commodities:
Production, Supply and Demand Data Statistics:
Cattle PS&D
Animal Numbers, Cattle 2016 2017 2018
Market Begin Year Jan 2016 Jan 2017 Jan 2018
Japan USDA Official New Post USDA Official New Post USDA Official New Post
Total Cattle Beg. Stks 3824 3824 3810 3822 0 3840
Dairy Cows Beg. Stocks 752 752 745 735 0 745
Beef Cows Beg. Stocks 589 589 595 597 0 595
Production (Calf Crop) 1190 1194 1190 1210 0 1210
Total Imports 9 9 10 11 0 12
Total Supply 5023 5027 5010 5043 0 5062
Total Exports 0 0 0 0 0 0
Cow Slaughter 480 480 480 470 0 465
Calf Slaughter 5 5 5 5 0 5
Other Slaughter 566 566 555 570 0 575
Total Slaughter 1051 1051 1040 1045 0 1045
Loss 162 154 165 158 0 157
Ending Inventories 3810 3822 3805 3840 0 3860
Total Distribution 5023 5027 5010 5043 0 5062
(1000 HEAD)
Meat, Swine
Beef PS&D
Meat, Beef and Veal 2016 2017 2018
Market Begin Year Jan 2016 Jan 2017 Jan 2018
Japan USDA Official New Post USDA Official New Post USDA Official New Post
Slaughter (Reference) 1051 1051 1040 1045 0 1045
Beginning Stocks 185 185 151 151 0 133
Production 465 465 460 465 0 465
Total Imports 719 719 760 780 0 815
Total Supply 1369 1369 1371 1396 0 1413
Total Exports 3 2 2 3 0 3
Human Dom. Consumption 1215 1216 1225 1260 0 1265
Other Use, Losses 0 0 0 0 0 0
Total Dom. Consumption 1215 1216 1225 1260 0 1265
Ending Stocks 151 151 144 133 0 145
Total Distribution 1369 1369 1371 1396 0 1413
(1000 HEAD) ,(1000 MT CWE)
Swine PS&D
Animal Numbers, Swine 2016 2017 2018
Market Begin Year Jan 2016 Jan 2017 Jan 2018
Japan USDA Official New Post USDA Official New Post USDA Official New Post
Total Beginning Stocks 9313 9313 9100 9346 0 9307
Sow Beginning Stocks 845 845 845 839 0 835
Production (Pig Crop) 16600 16900 16600 16780 0 16700
Total Imports 1 1 1 1 0 1
Total Supply 25914 26214 25701 26127 0 26008
Total Exports 0 0 0 0 0 0
Sow Slaughter 0 0 0 0 0 0
Other Slaughter 16393 16393 16300 16370 0 16300
Total Slaughter 16393 16393 16300 16370 0 16300
Loss 421 475 401 450 0 450
Ending Inventories 9100 9346 9000 9307 0 9258
Total Distribution 25914 26214 25701 26127 0 26008
(1000 HEAD)
Pork PS&D
Meat, Swine 2016 2017 2018
Market Begin Year Jan 2016 Jan 2017 Jan 2018
Japan USDA Official New Post USDA Official New Post USDA Official New Post
Slaughter (Reference) 16393 16393 16300 16370 0 16300
Beginning Stocks 200 200 211 211 0 219
Production 1279 1279 1270 1275 0 1270
Total Imports 1361 1364 1350 1420 0 1405
Total Supply 2840 2843 2831 2906 0 2894
Total Exports 3 2 2 2 0 2
Human Dom. Consumption 2626 2630 2624 2685 0 2660
Other Use, Losses 0 0 0 0 0 0
Total Dom. Consumption 2626 2630 2624 2685 0 2660
Ending Stocks 211 211 205 219 0 232
Total Distribution 2840 2843 2831 2906 0 2894
Preface:
This report is an update to
JA7011
(Livestock and Products Semi-annual) dated February 27, 2017.
Quantities listed in the text are made on the basis of Carcass Weight Equivalent (CWE) unless specified
otherwise. Some numbers in the tables are on a product weight basis and have not been converted to
CWE (such as Japanese Government data related to the frozen beef safeguard).
Rates of conversion from product weight to CWE are:
Beef Cuts (Boneless)
–
1.40
Pork Cuts (Boneless)
–
1.30
Processed/Prepared Beef Products
–
1.79
Processed/Prepared Pork Products
–
1.30
Beef
2017 Market Situation and Summary Outlook
Declining Japanese Cattle Numbers, Slaughter Forecast to Slow in 2017
Total cattle slaughter during the first six months of 2017 decreased two percent compared to the same
period of the previous year to 488,600 head. Total beef production remained at 220,000 MT,
unchanged from the previous year due to an increased number of heavier cattle slaughtered for the
period. In the first half of 2017, the average carcass weight rose two percent to 451 kilograms,
offsetting a modest decline in total cattle slaughter.
The slaughter breakdown by major breeds for beef through June 2017 was:
Wagyu Cow/Heifer: 91,900 head, down six percent
Holstein Cow/Heifer (mostly spent cows) for beef: 75,600 head, down seven percent
F-1 Cross Heifer: 51,600 head, up three percent
Wagyu Steer: 108,700 head, down one percent
Holstein Steer: 94,200 head, down four percent
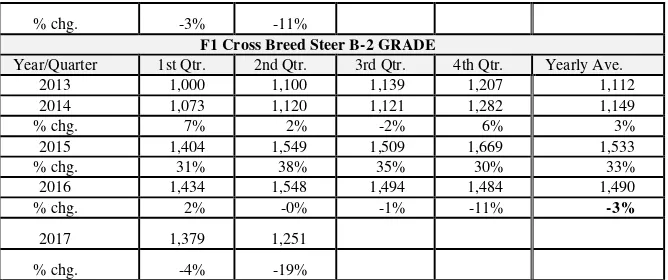
F-1 Cross Steer: 61,300 head, up seven percent
High market prices for domestic beef across breeds amidst continued contraction of Wagyu production
base in recent years encouraged a growing number of dairy producers to shift their artificial
insemination (AI) orientation to produce more F-1 cross animals that are priced higher than Holstein
steers in the market. Driven by solid market demand for high quality medium grade domestic beef in
recent years, increased AI crossing of Wagyu semen with first-bred Holstein heifers resulted in a
notable increase in F-1 steer/heifer slaughter in the first half of 2017.
six percent year-on-year) points to herd rebuilding in Wagyu breeding sector in an effort to capitalize on
high Wagyu calf prices (see Note 1 and Table 9-A, B and C and Table 10).
Note 1: The Ministry of Agriculture, Forestry, and Fisheries (MAFF) 2017 Year Beginning National Cattle Inventory data
point to two successive years of increases in Wagyu cow beginning stocks, up two percent to 589,000 head in 2016 and up
one percent to 597,000 head in the first half of 2017. A slight recovery in the beef breed inventory, which was up one
percent to 1.664 million head in the first half of 2017, points to a stable Wagyu steer slaughter in 2018, while increased F1
cross breed slaughter is anticipated to offset reduced Holstein steer and cow slaughters in 2018.
Consumption Jumps on Strong Foodservice, Ready-to-Eat Food Demand
Agriculture and Livestock Industry Corporation (ALIC) data on the total volume of beef distributed in
the first half of 2017 indicates exceptional growth of eight percent year-on-year to 681,904 MT
(converted to CWE from the original data). Foodservice was the main driver of increased import
demand for chilled and frozen cuts, accounting for over 60 percent of total beef distributed in Japan.
Japanese foodservice includes beef bowl and Korean style barbecue chains, family restaurants, specialty
restaurants offering steaks and barbecue dishes, hotels, and ready-to-eat foods businesses (including
convenience stores, supermarket delicatessens, and department stores). Data from the Japan Food
Service Association (JF) shows that average sales of all JF member shops and outlets for January-June
increased 3.4 percent with the number of people eating out also up 3.1 percent:
[CY 2017 (January-June) Average Sales Breakdown]
All shops/outlets, up 3.4 percent
Total number of customers, up 3.1 percent
Fast Foods (Western, Japanese, Noodle, Take out/Conveyer Best Sushi and Others), up 5.5 percent
Family Restaurants (Western, Japanese, Chinese and Korean Style Barbecue), up 0.4 percent
Pub Restaurants (Beer Hall, Pubs, and Other Drinking Places), down 0.7 percent
Dinner Restaurants, up 4.0 percent
Café and Tea Shops, up 3.7 percent
Others, up 4.2 percent
[CY 2016 (January-December) Average Sales Breakdown]
All shops/outlets, up 2.8 percent
Total number of customers, up 1.5 percent
Fast Foods, up 6 percent
Family Restaurants, up 4.3 percent
Pub Restaurants (Beer Hall, Pubs, and Other Drinking Places), down 7.2 percent
Dinner Restaurants, up 4.3 percent
Café and Tea Shops, up 1.2 percent
Others, up 3.4 percent
Given these trends, Post projects Japanese total beef consumption in 2017 to increase four percent to
1.26 million MT.*
[*Please note a correction to the JA 7011 semi-annual section - U.S. Chilled Cuts, Frozen Stocks Drove 2016 Beef
Consumption Higher:
Japan’s 2016 total beef consumption should re
ad 1.215 million MT, as noted in the PS&D table, not
1.25 million MT
.
].
The frozen beef safeguard tariff came into effect on August 1, 2017. Unexpected consumption growth
in the first half of 2017 was the foremost factor causing the safeguard to trigger. The gradual depletion
of frozen beef stocks which began in 2016 and continued throughout the first half of 2017 further
stimulated import demand (see Table 6-A). The triggering of the safeguard has created a substantial
tariff differential between countries with an Economic Partnership Agreement (EPA) with Japan
(namely Australia, Mexico, and Chile) and those without (including the United States, Canada, and New
Zealand). A detailed description of the safeguard mechanism and its triggering may be found in
JA7106
and in the notes to Table 3 of this report.
Consumption drove
up Japan’s total beef imports (boneless chilled and frozen cuts combined, including
a small volume of bone-in quarters/carcasses) in the first half of 2017 by 18 percent year-on-year to
387,731 MT. Frozen beef imports increased 20 percent to 212,310 MT in the same period.
Post anticipates that solid demand for beef will persist throughout the second half of 2017 driven by
strong eat-out/take out demand trends as explained above. As such, Post projects total imports up nine
percent to 780,000 MT (beef cuts up nine percent to 766,000 MT; prepared products unchanged at
14,000 MT) for 2017.
Year ending stocks are projected down 12 percent to 133,000 MT as the frozen beef safeguard makes it
difficult for importers to replenish stocks.
2018
Market Outlook
Beef Consumption Forecast to Remain Strong, but Cross-Commodity and Import Share
Competition to Intensify
Post projects that high beef consumption in 2017 continues to hold through 2018 at around 1.265
million MT due to sustained foodservice and ready-to-eat home meal business demand. Japanese cattle
slaughter in 2018, which is in a soft rebuilding cycle, is projected to hold at around the same level of
1.045 million head (with total beef production of 465,000 MT). Given limited supplies of low-priced
mid-grade domestic fresh/chilled beef (especially of Holstein steers), retail demand for imported
grain-fed chilled cuts is expected to remain strong.
Import share competition between the United States and Australia is expected to intensify in 2018.
Modestly higher cattle slaughter and domestic beef production for both countries will ensure ample
exportable supplies of chilled and frozen cuts destined for Asian markets, including Japan. U.S. chilled
beef cuts may face competition in the Japanese retail and foodservice market from Australian chilled
short-fed cuts that are in greater supply and lower-priced than in 2017.
In light of the above, Post projects total beef imports in 2018 to increase modestly to 815,000 MT (beef
cuts up five percent to 801,000 MT and prepared products unchanged at 14,000 MT), which will allow
year ending stocks to increase nine percent to 145,000 MT.
Pork
2017 Market Outlook Update
Hog Slaughter and Pork Production to Remain Steady in 2017
National swine inventory data released in July showed that the 2017 year-beginning total number of
hogs raised was slightly higher than the previous year at 7.797 million head. The beginning sow stock,
which had been declining in recent years, was sustained slightly lower at 839,000 head (see Note 2,
Table 10). The number of swine operators in Japan fell another three percent to 4,700, indicating
continued consolidation within the Japanese swine industry. Japanese pork production has become
increasingly reliant in recent years on farms operated by Japanese ham and sausage manufacturers and
agricultural cooperatives as well as semi-integrated farms jointly operated by multiple individual
owners.
Note 2: In response to reportedly improved average pig crops, Post made upward adjustments to pig crop estimates for
past two years. 2016 is revised slightly upward from 16.70 million to 16.90 million and 2017 is revised from 16.5
million to 16.78 million head
Given the above, Post projects Japan’s total hog slaughter in 2017 to s
ustain at nearly the same level as
the previous year at around 16.37 million head (or total pork production at 1.275 million MT).
Hog slaughter and pork production for the first six months of 2017 remained roughly the same as the
previous year at 8.132 million head or 637,749 MT. In effect, quarterly average wholesale prices of
fresh/chilled pork cuts, which declined in the previous year, also stabilized by hovering around previous
year levels (see Table 5-A and 5-B).
Considerably high volumes of North American chilled cuts continued to flow in the first half of 2017 as
sales competition further intensified between domestic (priced higher compared to imported chilled cuts
but generally preferred by households) and imported pork (priced significantly lower than domestic
cuts, catering to price conscious consumers).
A slight increase in average household pork consumption in the first half of 2017 (with unchanged
expenditure) suggests that a significant amount of imported chilled cuts were absorbed by
non-household foodservice and ready-to-eat businesses that have expanded chilled utilization in recent years
(i.e., specialty cutlet chains for eat-in/take-out, home meal replacement dishes, and delicatessens) on
lower market prices of imported chilled pork (see Table 1 and Table 5-C).
On Solid Consumption, Imports Expected to Reach New Record Highs in 2017
converted from the original data), following three percent annual growth achieved in 2016. Utilization
breakdown indicates an increasing presence of imported pork in Japanese market, up eight percent to
570,954 MT, giving it a 50 percent share of the total distribution. Domestic pork distribution grew a
modest two percent (see Notes 3 and 4). With household pork consumption (retail table pork
consumption) staying almost unchanged, first half growth was driven primarily by an expansion of
non-household sector demand. Solid foodservice and ready-to-
eat food demand, as indicated by JF’s first
half sales data presented in the beef section, appears to be picking up increased volumes of imported
pork (not only frozen cuts, but also a fairly large influx of chilled cuts), accounting for around 27
percent of total distribution according to a recent MAFF survey. Processing demand also emerged after
years of stagnation to account for 24 percent of distribution. Households accounted for the remaining
49 percent (see Note 5).
Note 3: The annual volume of total pork distributed in 2016 increased five percent to 2.245 million MT in 2016
(imported pork up eight percent to 1.092 million MT and domestic pork unchanged at 1,153 million MT, holding a
share of 49 percent and 51 percent, respectively) per the same ALIC data.
Note 4: As explained in a separate section, in addition to chilled and frozen cuts, the consumption figure reported in the
Post PS&D table also contains imported prepared products, including a large volume of frozen U.S. and Canadian
seasoned ground pork, which will make the import share even hi
gher than ALIC’s estimate.
Note 5: The Japan Ham and Sausage Processors Cooperative Association indicates that the volume of frozen pork cuts
used for processed products (mainly ham, bacon and sausage) in the first half of 2017 rose modestly, up three percent
to 179,971 MT (on a boneless equivalent basis and excluding the volume of imported seasoned ground pork). While
utilization of imported cuts was up five percent to 144,086 MT, utilization of domestic cuts was down four percent to
35,885 MT. Utilization of imported seasoned ground pork was 10 percent higher at 58,618 MT (on a product weight
basis).
In response to solid overall demand for pork mentioned above, total pork imports (pork cuts) in the first
half of 2017 rose seven percent to 596,616 MT. Chilled cuts increased eight percent to 246,943 MT
while frozen cuts increased six percent to 349,673 MT (see Tables 8-A, 8-B and 8-C).
Post has noted a growing presence of Canadian chilled pork in recent years, which has intensified
competition with the United States.
In the first half of 2017, Japan’s imports of Canadian chilled cuts
spiked 21 percent year-on-year to 103,886 MT while U.S. chilled cuts grew only one percent to 135,564
MT. As a result, Canada advanced its share of the chilled market by four percentage points to 42
percent while the U.S. share decreased by four percentage points to 55 percent (see Note 6).
Note 6: Canada’s export drive to Asia appears to coincide with the onset of the August 2014 Russian food import ban.
Canada has made strong inroads into Japanese market in recent years, expanding its presence in chilled pork market
(up 16 percent to 131,439 MT in 2014, up 20 percent to 157,461 MT in 2015, and up 13 percent to 178,403 MT in
2016). U.S. chilled pork imports, by contrast, were down five percent to 244,022 MT in 2014, unchanged at 244,178
MT in 2015, and up 10 percent to 268,302 MT in 2016. On June 30, 2017, the Russian government announced another
one-year extension of its food import ban from the EU and other countries to December 2018.
for bacon manufacturing in Japan. On the other hand, solid demand for sausage and ham, which mainly
uses picnics combined with loins and shoulders cuts from North American origins, led to increased
imports from the United States, up 19 percent to 39,320 MT, and Canada, up 15 percent to 30,369 MT
for the period. Portion controlled cuts and slices supplied by Spain and Mexico are said to be capturing
expanding demand in Japan’s ready
-to-eat foods business sector with Spain up 12 percent to 68,479 MT
and Mexico up 19 percent to 48,066 MT in the first half.
In response to solid frozen and ready-to-eat food demand for lower priced sausages and Chinese
dumplings, imports of prepared pork products increased 10 percent to 133,021 MT. Imports of U.S.
seasoned ground pork (the largest single component of the prepared products segment) grew 18 percent
to 83,545 MT, capturing 63 percent of the market (see Table 8-D).
Post projects consumption growth in the second half of 2017 to be somewhat moderate compared to the
first half, with annual growth up two percent year-on-year to 2.685 million MT. With flat annual
domestic production, Post projects that consumption growth will be filled mainly by increased imports,
up four percent to 1.420 million MT. There may be increased sales competition on the retail front for
table pork and non-retail front for cutlet/barbecue use pork from chilled beef imports which are
expected to increase in the second half of 2017 due to the frozen beef safeguard (see beef section).
However, growing beef consumption and high chicken consumption in the first half of 2017 do not
seem to have constrained pork consumption growth, leaving it in good position to surpass last year’s
record high.
2018 Outlook
Intense Cross-Commodity Competition to Cap Pork Market Growth in 2018
Post predicts that prevailing market dynamics in 2017 for Japanese pork will carry through to 2018 with
flat domestic production sustaining strong demand for imports. However, market saturation may lead to
greater cross-
commodity competition with beef and chicken, possibly constraining Japan’s pork
market
growth in 2018. As such, Post projects total pork consumption to decrease slightly from the previous
year to 2.660 million MT with total imports at 1.405 million MT. Hog slaughter is projected flat at 16.3
million head with pork production at 1.27 million MT.
Supplemental Tables:
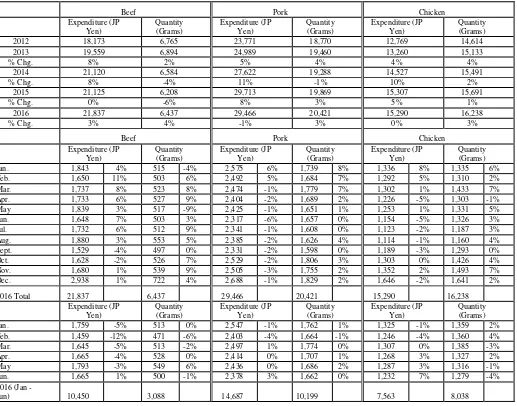
Table 1: Average Household Expenditures and Quantities Purchased of Selected Commodities YTD (Two or
more persons per household)
2012 18,173 6,765 23,771 18,770 12,769 14,614
2013 19,559 6,894 24,989 19,460 13,260 15,133
% Chg. 8% 2% 5% 4% 4% 4%
2014 21,120 6,584 27,622 19,288 14,527 15,491
% Chg. 8% -4% 11% -1% 10% 2%
2015 21,125 6,208 29,713 19,869 15,307 15,691
% Chg. 0% -6% 8% 3% 5% 1%
2016 21,837 6,437 29,466 20,421 15,290 16,238
2017 (Jan -
June) 9,986
3,074
14,675
10,255
7,665
8,026
% Chg. -4%
0%
0%
1%
1%
0%
Source: Ministry of Internal Affairs and Communication Bureau
2012 1,920 1,860 5,626 3,059 7,076 5,466
2013 1,952 1,848 5,630 3,007 7,211 5,524
% Chg. -3% -2% 0% 1% 0% 1%
2014 2,256 1,912 5,833 2,891 7,467 5,371
% Chg. 16% 3% 4% -4% 4% -3%
2015 2,430 1,871 5,807 2,863 7,189 5,132
% Chg. 8% -2% 0% -1% -4% -4%
2016 Total 2,487 1,941 5,504 2,769 7,387 5,226
% Chg. 2% 4% -5% -3% 3% 2%
Source: Ministry of Internal Affairs and Communication Bureau
Bacon Yakitori Cutlet
% Chg. 2% 0% 7%
7%
2016 2,600 1,472 1,862
2,248
% Chg. -2% -1% -14%
20%
Bacon Cutlet Yakitori
Expenditure (JP Yen)
Source: Ministry of Internal Affairs and Communication Bureau
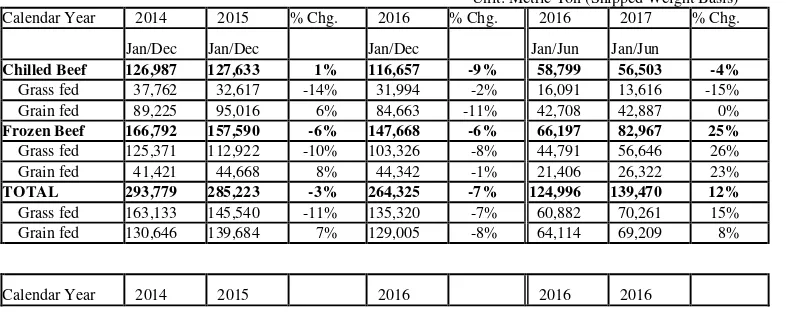
Table 2: Australian Beef Exports to Japan
Unit: Metric Ton (Shipped Weight Basis) Calendar Year 2014 2015 % Chg. 2016 % Chg. 2016 2017 % Chg.
Jan/Dec Jan/Dec
Jan/Dec
Jan/Jun Jan/Jun
Chilled Beef 126,987 127,633 1% 116,657 -9% 58,799 56,503 -4%
Grass fed 37,762 32,617 -14% 31,994 -2% 16,091 13,616 -15% Grain fed 89,225 95,016 6% 84,663 -11% 42,708 42,887 0%
Frozen Beef 166,792 157,590 -6% 147,668 -6% 66,197 82,967 25%
Grass fed 125,371 112,922 -10% 103,326 -8% 44,791 56,646 26% Grain fed 41,421 44,668 8% 44,342 -1% 21,406 26,322 23%
TOTAL 293,779 285,223 -3% 264,325 -7% 124,996 139,470 12%
Grass fed 163,133 145,540 -11% 135,320 -7% 60,882 70,261 15% Grain fed 130,646 139,684 7% 129,005 -8% 64,114 69,209 8%
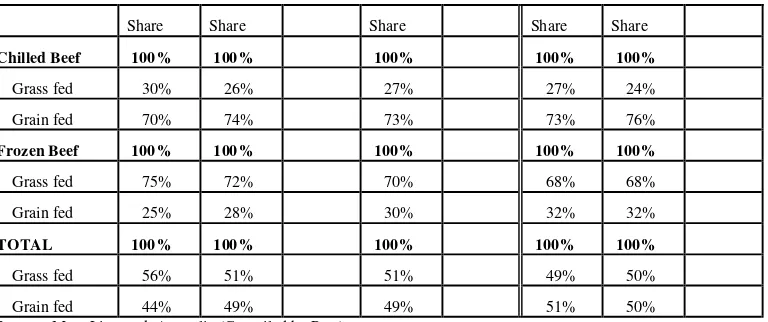
Share Share
Share
Share Share
Source: Meat Livestock Australia (Compiled by Post)
Table 3-A: Beef Safeguard Monitor, Frozen Beef
1) Safeguard Trigger Condition 1: Based on Imports from All Trade Partners Year to Date
Unit: Metric Ton (Customs Clearances Basis)
Frozen Beef
Trigger Level Actual Actual
Trigger
Level Actual
1st Qtr. (Apr. - Jun.) 87,702 100,130 85,581 76,187 -11% 89,140 89,253 17%
2) Safeguard Trigger Condition 2: Based on Imports from Non-EPA Countries Year to Date
Frozen Beef
Trigger Level Actual Actual
Trigger
Level Actual
1st Qtr. (Apr. - Jun.) 37,776 31,952 27,309 30,314 11% 35,468 37,823 25%
Source: Ministry of
Finance
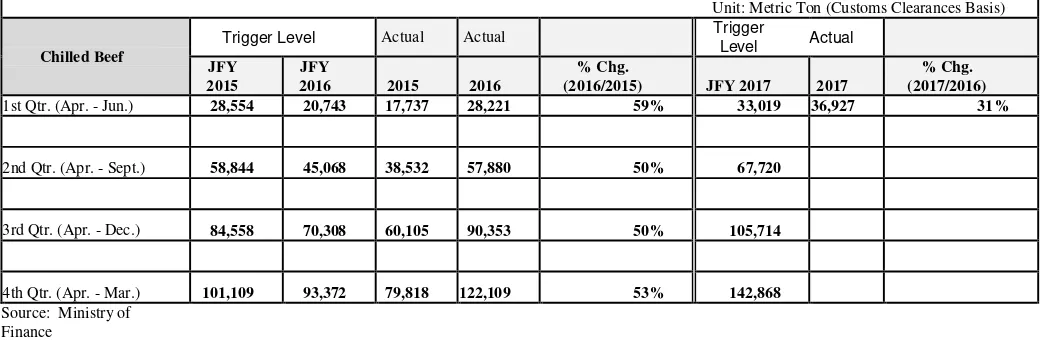
Table 3-B: Beef Safeguard Monitor, Chilled Beef
1) Safeguard Trigger Condition 1: Based on Imports from All Trade Partners Year to Date
Unit: Metric Ton (Customs Clearances Basis)
Chilled Beef
Trigger Level Actual Actual
Trigger
Level Actual
1st Qtr. (Apr. - Jun.) 74,339 74,339 53,594 61,724 15% 74,339 68,826 12%
2) Safeguard Trigger Condition 2: Based on Imports from Non-EPA Countries Year to Date
Unit: Metric Ton (Customs Clearances Basis)
Chilled Beef
Trigger Level Actual Actual
Trigger
Level Actual
1st Qtr. (Apr. - Jun.) 28,554 20,743 17,737 28,221 59% 33,019 36,927 31%
Source: Ministry of
Finance
Note: With the January 15, 2015 implementation of the Japan-Australia Economic Partnership Agreement (JAEPA), Japan
adjusted the beef safeguard trigger mechanism such that the beef safeguard is triggered only if the following two conditions
are met (Ref: see
JA4049 dated 09/24/2014
for more details):
Condition 1: When cumulative quarterly imports for chilled and for frozen beef (each calculated separately) from the world
exceed 117 percent of the previous year’s imports (Table 3
-A, 1 and 2),
AND
Condition 2: When cumulative quarterly imports for chilled and for frozen beef (each calculated separately) from all
non-EPA partner countries (including imports from the United States, Canada and New Zealand plus imports from non-EPA partner
countries in excess of EPA beef tariff rate quota [TRQ] limits) excee
d 117 percent of the previous year’s imports (see Table
3-B, 1 and 2)
Exceeding the trigger level for only one of the above conditions will not trigger the beef safeguard.
In the event that the trigger levels for both conditions are exceeded, then the import duty for non-EPA trade partners would
revert to 50 percent (from the current 38.5 percent).
Table 3-C:
Safeguard Trigger for Australian Beef under JAEPA for JFY 2016 and JFY 2017 YTD
Annual Safeguard
JFY 2017 (April - March) April - June Entry YTD Room for April - March
Chilled Beef: 135,000 31,470 103,530
Frozen Beef: 200,000 49,853 150,147
Source: Ministry of Finance
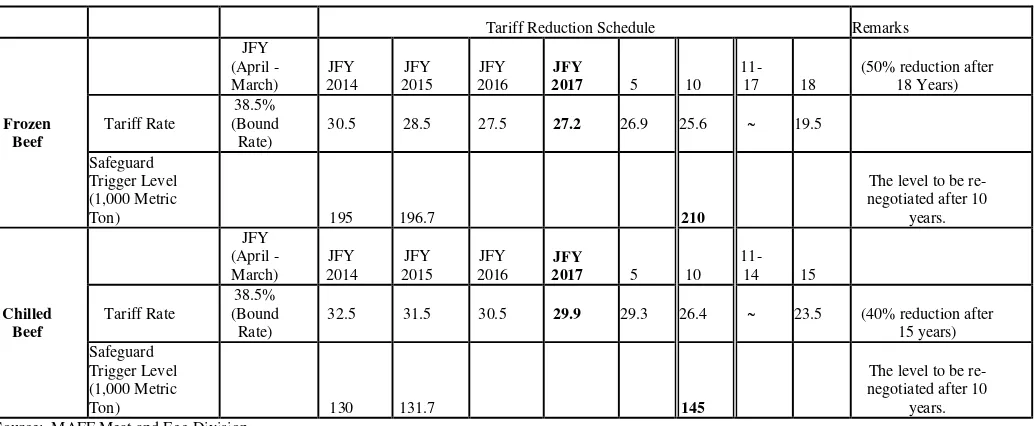
Tariff Reduction and Annual Safeguard Schedule for Australian Beef under JAEPA
Tariff Reduction Schedule Remarks Source: MAFF Meat and Egg Division
Note: Preferential import duties are applied for EPA countries, packaged with the annual safeguard for Australia and TRQs
for Mexico and Chile.
Table 3-C
–
1) represents annual safeguard monitoring results for Australian beef under JAEPA and below Table 3-C -2)
represents the tariff reduction schedule and the annual safeguard levels set for Australian beef under JAEPA. Tariff
reductions for Australian chilled and frozen beef were substantially front-loaded in the first two years of the agreement, after
which annual tariff reductions will slow considerably (roughly 0.6 percent per annum for chilled beef; roughly 0.3 percent
per annum for frozen beef from years 3-12 and 0.9 percent per annum for years 13-18). The import duty for Australia would
climb to 38.5 percent from EPA preferential duty duties (27.2 percent in JFY 2017) in an event that total imports exceeds the
annual trigger level.
For Chile and Mexico, the import duty will revert to 38.5 percent from the preferential EPA duty in the event that imports
exceed the TRQ level set separately for each (if imports exceed the TRQ level during safeguard implementation period for
non-EPA countries, then the duty will revert to 50 percent for the period (treated as imports from non-EPA countries).
The TRQ for Mexico is 15,000 MT (chilled and frozen beef combined) with in-quota duty at 30.8 percent and for Chile at
4,000 MT (frozen beef only) with in-quota duty at 30.8 percent in JFY 2017.
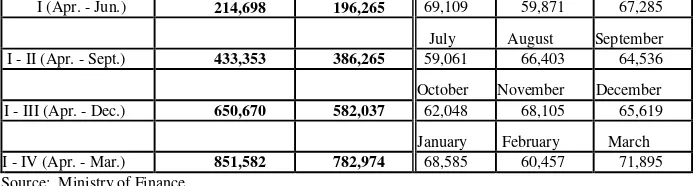
Table 3-D: Pork Safeguard Monitor JFY 2016 and JFY 2017
Pork Safeguard Trigger Levels for JFY 2016 and Actual Imports Year to Date
Unit: Metric Ton
Trigger Level Cum. Total
I (Apr. - Jun.) 214,698 196,265 69,109 59,871 67,285
July August September
I - II (Apr. - Sept.) 433,353 386,265 59,061 66,403 64,536
October November December I - III (Apr. - Dec.) 650,670 582,037 62,048 68,105 65,619
January February March
I - IV (Apr. - Mar.) 851,582 782,974 68,585 60,457 71,895 Source: Ministry of Finance
Pork Safeguard Trigger Levels for JFY 2017 and Actual Imports Year to Date
Unit: Metric Ton
Trigger Level Cum. Total
Quarterly Cum. Actual Entry April May June
I (Apr. - Jun.) 227,647 208,219 69,042 67,833 71,344
July August September
I - II (Apr. - Sept.) 455,999 208,219
October November December
I - III (Apr. - Dec.) 683,525 208,219
January February March
I - IV (Apr. - Mar.) 898,613 208,219
Source: Ministry of Finance
Table 4-A: Average Wholesale Domestic Beef Carcass Price, Tokyo Market
Unit: Yen/Kg.WAGYU STEER A-3 GRADE
Year/Quarter 1st Qtr. 2nd Qtr. 3rd Qtr. 4th Qtr. Yearly Ave. 2013 1,608 1,729 1,705 1,821 1,716 2014 1,645 1,687 1,739 1,965 1,759
% chg. 2% -2% 2% 8% 3%
2015 2,106 2,148 2,185 2,436 2,219
% chg. 28% 27% 26% 24% 26%
2016 2,520 2,504 2,373 2,435 2,446
% chg. 20% 17% 9% -0% 10%
2017 2,204 2,205
% chg. -13% -12%
WAGYU STEER A-2 GRADE
Year/Quarter 1st Qtr. 2nd Qtr. 3rd Qtr. 4th Qtr. Yearly Ave. 2013 1,453 1,579 1,552 1,646 1,557 2014 1,486 1,538 1,578 1,821 1,606
% chg. 2% -3% 2% 11% 3%
2015 1,944 1,992 2,003 2,271 2,052
% chg. 31% 29% 27% 25% 28%
2016 2,380 2,364 2,123 2,147 2,232
% chg. 22% 19% 6% -5% 9%
2017 1,929 1,924
% chg. -19% -19%
WAGYU Heifer A-3 GRADE
Year/Quarter 1st Qtr. 2nd Qtr. 3rd Qtr. 4th Qtr. Yearly Ave. 2013 1,590 1,696 1,687 1,788 1,690 2014 1,647 1,670 1,696 1,927 1,735
% chg. 4% -2% 1% 8% 3%
2015 2,487 2,084 2,133 2,380 2,159
% chg. 51% 25% 26% 24% 24%
% chg. -2% 18% 8% 0% 10%
2017 2,261 2,136
% chg. -7% -13%
Holstein Steer B-2 GRADE
Year/Quarter 1st Qtr. 2nd Qtr. 3rd Qtr. 4th Qtr. Yearly Ave.
2013 716 768 773 813 767
Year/Quarter 1st Qtr. 2nd Qtr. 3rd Qtr. 4th Qtr. Yearly Ave.
2013 378 486 538 536 484
F1 Cross Breed Heifer B-3 GRADE
Year/Quarter 1st Qtr. 2nd Qtr. 3rd Qtr. 4th Qtr. Yearly Ave. 2013 1,084 1,177 1,209 1,283 1,188
F1 Cross Breed Heifer B-2 GRADE
Year/Quarter 1st Qtr. 2nd Qtr. 3rd Qtr. 4th Qtr. Yearly Ave.
2013 970 1,081 1,090 1,176 1,079
F1 Cross Breed Steer B-3 GRADE
% chg. -3% -11%
F1 Cross Breed Steer B-2 GRADE
Year/Quarter 1st Qtr. 2nd Qtr. 3rd Qtr. 4th Qtr. Yearly Ave. 2013 1,000 1,100 1,139 1,207 1,112
Source: ALIC Monthly (Quarterly average price is compiled by Post based on ALIC monthly data)
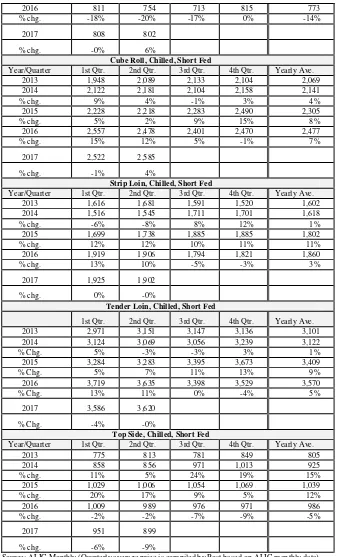
Table 4-B: Average Wholesale Price of Imported Beef, Australia, Short Grain Fed, Chilled Cuts
Unit: JP Yen/Kg.Full-set, Chilled, Short Fed
Year/Quarter 1st Qtr. 2nd Qtr. 3rd Qtr. 4th Qtr. Yearly Ave.
2013 923 956 931 962 943
Chuck Roll, Chilled, Short Fed
Year/Quarter 1st Qtr. 2nd Qtr. 3rd Qtr. 4th Qtr. Yearly Ave.
2013 820 859 833 894 852
Point-end Brisket, Chilled, Short Fed
Year/Quarter 1st Qtr. 2nd Qtr. 3rd Qtr. 4th Qtr. Yearly Ave.
2013 693 709 688 740 708
Navel-end Brisket, Chilled, Short Fed
Year/Quarter 1st Qtr. 2nd Qtr. 3rd Qtr. 4th Qtr. Yearly Ave.
2013 676 691 697 711 694
2014 757 792 873 963 846
% chg. 12% 15% 25% 36% 22%
2015 989 939 854 814 899
2016 811 754 713 815 773
% chg. -18% -20% -17% 0% -14%
2017 808 802
% chg. -0% 6%
Cube Roll, Chilled, Short Fed
Year/Quarter 1st Qtr. 2nd Qtr. 3rd Qtr. 4th Qtr. Yearly Ave. 2013 1,948 2,089 2,133 2,104 2,069
Strip Loin, Chilled, Short Fed
Year/Quarter 1st Qtr. 2nd Qtr. 3rd Qtr. 4th Qtr. Yearly Ave. 2013 1,616 1,681 1,591 1,520 1,602
Tender Loin, Chilled, Short Fed
1st Qtr. 2nd Qtr. 3rd Qtr. 4th Qtr. Yearly Ave.
Top Side, Chilled, Short Fed
Year/Quarter 1st Qtr. 2nd Qtr. 3rd Qtr. 4th Qtr. Yearly Ave.
2013 775 813 781 849 805
Source: ALIC Monthly (Quarterly average price is compiled by Post based on ALIC monthly data)
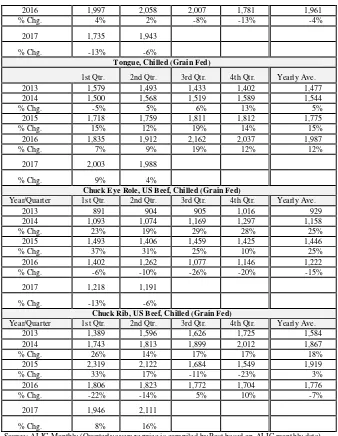
Table 4-C: Average Wholesale Price of Imported Beef, U.S., Grain Fed, Chilled Cuts
Unit: Yen/Kg.Rib Eye Roll (No 112A), US Beef, Chilled (Grain Fed)
Year/Quarter 1st Qtr. 2nd Qtr. 3rd Qtr. 4th Qtr. Yearly Ave.
2013 2,099 2,141 2,198 2,399 2,210
2014 2,402 2,431 2,639 2,842 2,579
2015 3,123 3,375 3,504 3,408 3,353
Strip Loin (No 180), Chilled (Grain Fed)
Year/Quarter 1st Qtr. 2nd Qtr. 3rd Qtr. 4th Qtr. Yearly Ave.
2013 1,819 2,099 2,083 1,926 1,982
2014 2,023 2,436 2,511 2,308 2,320
Full Tender Loin (No. 189A), Chilled (Grain Fed)
Year/Quarter 1st Qtr. 2nd Qtr. 3rd Qtr. 4th Qtr. Yearly Ave.
2013 3,153 3,094 3,134 3,446 3,207
2014 3,645 3,562 3,619 4,061 3,722
Boneless Short Rib, Chilled (Grain Fed)
Year/Quarter 1st Qtr. 2nd Qtr. 3rd Qtr. 4th Qtr. Yearly Ave.
2013 2,172 2,474 2,543 2,677 2,467
2014 2,826 2,939 3,199 3,412 3,094
Hanging Tender, Chilled (Grain Fed)
1st Qtr. 2nd Qtr. 3rd Qtr. 4th Qtr. Yearly Ave.
Outside Skirt, Chilled (Grain Fed)
Year/Quarter 1st Qtr. 2nd Qtr. 3rd Qtr. 4th Qtr. Yearly Ave.
2013 1,391 1,414 1,333 1,299 1,360
2014 1,341 1,542 1,727 1,808 1,604
% Chg. -4% 9% 30% 39% 18%
2015 1,913 2,022 2,189 2,046 2,042
2016 1,997 2,058 2,007 1,781 1,961
2013 1,579 1,493 1,433 1,402 1,477
2014 1,500 1,568 1,519 1,589 1,544
Chuck Eye Role, US Beef, Chilled (Grain Fed)
Year/Quarter 1st Qtr. 2nd Qtr. 3rd Qtr. 4th Qtr. Yearly Ave.
2013 891 904 905 1,016 929
Chuck Rib, US Beef, Chilled (Grain Fed)
Year/Quarter 1st Qtr. 2nd Qtr. 3rd Qtr. 4th Qtr. Yearly Ave.
2013 1,389 1,596 1,626 1,725 1,584
2014 1,743 1,813 1,899 2,012 1,867
Source: ALIC Monthly (Quarterly average price is compiled by Post based on ALIC monthly data)
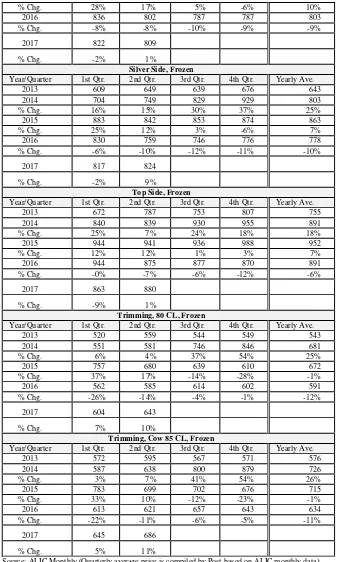
Table 4-D: Average Wholesale Price of Imported Beef, Australia, Grass Fed, Frozen Cuts
Navel End Brisket (Short Plate), Frozen
Year/Quarter 1st Qtr. 2nd Qtr. 3rd Qtr. 4th Qtr. Yearly Ave.
2013 541 590 589 606 581
Year/Quarter 1st Qtr. 2nd Qtr. 3rd Qtr. 4th Qtr. Yearly Ave.
2013 625 685 639 673 655
2014 710 747 835 917 802
% Chg. 13% 9% 31% 36% 22%
% Chg. 28% 17% 5% -6% 10%
Year/Quarter 1st Qtr. 2nd Qtr. 3rd Qtr. 4th Qtr. Yearly Ave.
2013 609 649 639 676 643
Year/Quarter 1st Qtr. 2nd Qtr. 3rd Qtr. 4th Qtr. Yearly Ave.
2013 672 787 753 807 755
Year/Quarter 1st Qtr. 2nd Qtr. 3rd Qtr. 4th Qtr. Yearly Ave.
2013 520 559 544 549 543
Trimming, Cow 85 CL, Frozen
Year/Quarter 1st Qtr. 2nd Qtr. 3rd Qtr. 4th Qtr. Yearly Ave.
2013 572 595 567 571 576
Source: ALIC Monthly (Quarterly average price is compiled by Post based on ALIC monthly data)
Table 4-E: Average Wholesale Price of Imported Beef, U.S., Grain Fed, Frozen Cuts
Unit: Yen/Kg.Short Plate, US Beef, Frozen
Year/Quarter 1st Qtr. 2nd Qtr. 3rd Qtr. 4th Qtr. Yearly Ave.
2013 611 577 564 568 580
% Chg. 2% 32% 71% 87% 47%
Short Rib, US Beef, Frozen
Year/Quarter 1st Qtr. 2nd Qtr. 3rd Qtr. 4th Qtr. Yearly Ave.
2013 1,928 2,297 2,379 2,550 2,289
2014 2,697 2,827 3,015 3,259 2,949
Chuck Eye Roll, US Beef, Frozen
Year/Quarter 1st Qtr. 2nd Qtr. 3rd Qtr. 4th Qtr. Yearly Ave.
2013 763 814 803 815 799
Chuck Rib, US Beef, Frozen
Year/Quarter 1st Qtr. 2nd Qtr. 3rd Qtr. 4th Qtr. Yearly Ave.
2013 1,215 1,440 1,428 1,481 1,391
2014 1,578 1,714 1,879 1,920 1,773
Shoulder Clod, US Beef, Frozen
Year/Quarter 1st Qtr. 2nd Qtr. 3rd Qtr. 4th Qtr. Yearly Ave.
2013 623 676 661 659 655
Source: ALIC Monthly (Quarterly average price is compiled by Post based on ALIC monthly data)
Table 5-A: Average Wholesale Price of Domestic Hog Carcasses by Grade, Tokyo Market
Unit: Yen/Kg.Excellent Grade
2013 419 496 521 501 484
Year/Quarter 1st Qtr. 2nd Qtr. 3rd Qtr. 4th Qtr. Yearly Ave.
2013 370 459 487 475 448
Source: ALIC Monthly (Quarterly average price is compiled by Post based on ALIC monthly data)
Table 5-B: Average Wholesale Price of Fresh/Chilled Domestic Pork Cuts
Unit: JPY per Kg.Full-set: Chilled
Year/Quarter 1st Qtr. 2nd Qtr. 3rd Qtr. 4th Qtr. Yearly Ave.
2013 584 700 742 703 682
Year/Quarter 1st Qtr. 2nd Qtr. 3rd Qtr. 4th Qtr. Yearly Ave.
2013 425 536 551 531 511
Year/Quarter 1st Qtr. 2nd Qtr. 3rd Qtr. 4th Qtr. Yearly Ave.
Loin: Chilled
Year/Quarter 1st Qtr. 2nd Qtr. 3rd Qtr. 4th Qtr. Yearly Ave.
2013 796 877 961 926 890
Year/Quarter 1st Qtr. 2nd Qtr. 3rd Qtr. 4th Qtr. Yearly Ave.
2013 852 961 1,027 990 958
Year/Quarter 1st Qtr. 2nd Qtr. 3rd Qtr. 4th Qtr. Yearly Ave.
2013 763 806 851 934 839
Year/Quarter 1st Qtr. 2nd Qtr. 3rd Qtr. 4th Qtr. Yearly Ave.
2013 451 571 583 563 542
Source: ALIC Monthly (Quarterly average price is compiled by Post based on ALIC monthly data)
Table 5-C: Average Wholesale Price of Imported Chilled Pork Cuts
Unit: JP Yen/Kg.Loin, US: Chilled
Year/Quarter 1st Qtr. 2nd Qtr. 3rd Qtr. 4th Qtr. Yearly Ave.
% Chg. -2% -3%
Loin, Canada: Chilled
Year/Quarter 1st Qtr. 2nd Qtr. 3rd Qtr. 4th Qtr. Yearly Ave.
2013 599 601 604 599 601
Tender Loin, US: Chilled
Year/Quarter 1st Qtr. 2nd Qtr. 3rd Qtr. 4th Qtr. Yearly Ave.
2013 681 687 759 769 724
Tender Loin, Canada: Chilled
Year/Quarter 1st Qtr. 2nd Qtr. 3rd Qtr. 4th Qtr. Yearly Ave.
2013 727 727 815 816 771
Year/Quarter 1st Qtr. 2nd Qtr. 3rd Qtr. 4th Qtr. Yearly Ave.
2013 598 605 641 657 625
Year/Quarter 1st Qtr. 2nd Qtr. 3rd Qtr. 4th Qtr. Yearly Ave.
2013 618 625 655 665 641
Table 6-A: Monthly Ending Beef Stock Estimate
Unit: Metric Ton (CWE converted)
Month/Year 2013 2014 % Chg. 2015 % Chg. 2016 % Chg. 2017 % Chg.
Jan. 128,838 166,335 29% 184,775 11% 177,155 -4% 147,329 -17% Feb. 120,344 155,893 30% 176,648 13% 168,689 -5% 144,337 -14% Mar. 119,699 150,046 25% 178,385 19% 162,392 -9% 143,910 -11% Apr. 117,029 149,295 28% 188,873 27% 160,255 -15% 143,895 -10% May 135,064 145,508 8% 196,265 35% 167,520 -15% 147,473 -12% Jun. 145,328 154,976 7% 202,262 31% 171,811 -15% 151,698 -12% Jul. 172,175 161,944 -6% 202,241 25% 177,565 -12%
Source: ALIC Monthly Statistics
Table 6-B: Monthly Ending Pork Stock Estimate
Unit: Metric Ton (CWE Converted)
Month/Year 2013 2014 % Chg. 2015 % Chg. 2016 % Chg. 2017 % Chg. Source: ALIC Monthly Statistics
Table 7-A: Japanese Total Beef Imports YTD, Chilled and Frozen Cuts Combined/CIF Price
Unit: Metric Ton (Customs Clearance Basis)
Partner Country
Calendar Year Year To Date
2013 2014 Share 2015
World 534,255 518,708 -3% 493,986 -5% 503,226 2% 234,362 276,951 18% Australia 285,923 280,842 -2% 288,581 3% 272,824 -5% 129,746 137,323 6% United States 186,056 188,675 1% 165,427 -12% 192,122 16% 86,698 115,696 33% New Zealand 29,429 24,112 -18% 16,652 -31% 16,393 -2% 7,726 9,511 23%
Canada 12,691 14,104 11% 9,941 -30% 13,458 35% 5,554 9,132 64%
Mexico 19,571 10,369 -47% 11,840 14% 7,352 -38% 4,020 4,167 4%
Chile 58 108 86% 40 -63% 13 -68% 7 1 -86%
Others 527 498 -6% 1,505 202% 1,064 -29% 611 1,121 83%
EPA (Australia, Mexico and
Chile Combined) 305,552 291,319 -5% 300,460 3% 280,188 -7% 133,772 141,492 6% Non-EPA (The United States,
Canada, New Zealand and
Source of Data: Global Trade Atlas (Japan Ministry of Finance)
Calendar Year Year To Date
2013 2014
Source of Data: Global Trade Atlas (Japan
Ministry of Finance)
Unit: U.S. Dollar per Metric Ton
Partne r Count
ry
Calendar Year Year to Date
201
11 5,055 1% 5,827 15% 10,372 78% 8,220 11,622 41%
Source of Data: Global Trade Atlas (Japan Ministry of Finance)
Table 7-B: Japanese Beef Imports YTD, Chilled Cuts/CIF Price
Unit: Metric Ton (Customs Clearance Basis)
Partner Country
Calendar Year Based Year To Date
2013 2014
World 212,305 219,253 3% 204,668 -7% 229,110 12% 107,548 125,300 17% Australia 115,650 125,457 8% 127,704 2% 116,978 -8% 58,774 55,712 -5% United States 86,297 83,528 -3% 67,592 -19% 101,725 50% 43,921 64,365 47%
New Zealand 6,610 5,541 -16% 4,870 -12% 5,441 12% 2,658 2,778 5%
Canada 1,486 1,832 23% 1,743 -5% 2,452 41% 1,021 1,377 35%
Mexico 2,204 2,843 29% 2,712 -5% 2,422 -11% 1,124 1,024 -9%
Chile 0 0 n/a 2 n/a 0 -100% 0 0 n/a
Others 58 52 -10% 45 -13% 92 104% 50 44 -12%
EPA (Australia, Mexico and
Chile Combined) 117,854 128,300 9% 130,419 2% 119,400 -8% 59,898 56,736 -5% Non-EPA (The United States,
Canada and New Zealand) 94,451 90,953 -4% 74,249 -18% 109,710 48% 47,650 68,564 44% Source of Data: Global Trade Atlas (Japan Ministry of Finance)
Share Chart
Partner Country
Calendar Year Based Year To Date
2013 2014 Share
Growth 2015
Share
Growth 2016
Share
Growth 06/2016 06/2017
Share
Source of Data: Global Trade Atlas (Japan Ministry of Finance)
Unit: U.S. Dollar per Metric Ton
Partner Country Calendar Year Based Year To Date
2013 2014 % Chg. 2015 % Chg. 2016 % Chg. 06/2016 06/2017 % Chg.
World 6,827 7,260 6% 7,358 1% 7,247 -2% 7,292 7,163 -2%
Australia 6,477 6,705 4% 7,206 7% 7,491 4% 7,358 7,481 2%
United States 7,195 8,010 11% 7,553 -6% 6,912 -8% 7,133 6,825 -4% New Zealand 7,981 7,999 0% 8,298 4% 8,314 0% 8,190 8,776 7%
Canada 6,786 7,102 5% 7,081 0% 6,440 -9% 6,933 6,200 -11%
Mexico 6,858 7,968 16% 7,898 -1% 7,356 -7% 7,636 7,354 -4%
Chile 0 0 n/a 12,351 n/a 0 -100% 0 0 n/a
Source of Data: Global Trade Atlas (Japan Ministry of Finance)
Table 7-C: Japanese Beef Imports YTD, Frozen Cuts/CIF Price
Unit: Metric Ton (Customs Clearance Basis)
Partner Country
Calendar Year Year To Date
2013 2014
United States 99,758 105,147 5% 97,835 -7% 90,397 -8% 42,777 51,331 20%
Canada 11,205 12,272 10% 8,198 -33% 11,006 34% 4,533 7,755 71%
New Zealand 22,819 18,570 -19% 11,782 -37% 10,953 -7% 5,068 6,733 33%
Mexico 17,367 7,526 -57% 9,128 21% 4,930 -46% 2,896 3,144 9%
Chile 58 108 86% 38 -65% 13 -66% 7 1 -86%
Others 469 20 -96% 0 -100% 0 n/a 0 0 n/a
EPA (Australia, Mexico and
Chile combined) 187,698 163,019 -13% 170,041 4% 160,788 -5% 73,874 84,756 15% Non EPA (The United States,
Canada, New Zealand and
Others Combined) 134,251 136,437 2% 119,276 -13% 113,328 -5% 52,940 66,894 26%
Source of Data: Global Trade Atlas (Japan Ministry of Finance)
Share Chart
Partner Country
Calendar Year Year To Date
2013 2014 GrowthShare 2015 GrowthShare 2016 GrowthShare 06/2016 06/2017 GrowthShare
Non EPA (The United States, Canada, New Zealand and Others
Combined) 42% 46% 4% 41% -4% 41% 0% 42% 44% 2%
Source of Data: Global Trade Atlas (Japan Ministry of
Finance)
Unit: U.S. Dollar per Metric Ton
Partner Country Calendar Year Based Year To Date
2013 2014 % Chg. 2015 % Chg. 2016 % Chg. 06/2016 06/2017 % Chg.
World 3,942 4,324 10% 4,420 2% 3,644 -18% 3,540 3,752 6%
Chile 5,011 5,055 1% 5,424 7% 10,372 91% 8,220 11,622 41%
New Zealand 4,528 5,010 11% 5,730 14% 5,389 -6% 5,592 4,613 -17% Australia 3,720 4,045 9% 4,108 2% 3,651 -11% 3,473 3,889 12% Mexico 3,929 4,992 27% 4,925 -1% 3,703 -25% 3,831 3,627 -5% United States 4,206 4,592 9% 4,758 4% 3,442 -28% 3,394 3,515 4%
Canada 3,734 4,052 9% 4,100 1% 3,273 -20% 3,288 3,112 -5%
Source of Data: Global Trade Atlas (Japan Ministry of Finance)
Table 7-D: Japanese Beef Imports YTD, Prepared and Processed Products/CIF Price
Unit: Metric Ton (Customs Clearance Basis)
Partner Country Calendar Year Year To Date
2013 2014 % Chg. 2015 % Chg. 2016 % Chg. 06/2016 06/2017 % Chg.
World 6,503 7,272 12% 8,551 18% 8,018 -6% 3,907 3,746 -4% Australia 4,847 5,279 9% 4,958 -6% 4,649 -6% 2,320 2,072 -11% United States 0 138 n.a. 2,006 1354% 2,392 19% 1,134 1,189 5%
Others 1,656 1,855 12% 1,587 -14% 977 -38% 453 485 7%
Share Chart
Partner Country
Calendar Year Year To Date
2013 2014 Share
Source of Data: Global Trade Atlas (Japan Ministry of Finance)
Unit: U.S. Dollar per Metric Ton
Partner Country Calendar Year Year To Date
2013 2014 % Chg. 2015 % Chg. 2016 % Chg. 06/2016 06/2017 % Chg.
World 6,719 6,785 1% 5,462 -19% 5,427 -1% 5,271 5,755 9%
Australia 5,678 5,577 -2% 5,561 0% 5,501 -1% 5,405 5,786 7% United States 0 2,766 n.a. 2,882 4% 3,343 16% 3,162 3,115 -1% Source of Data: Global Trade Atlas (Japan Ministry of Finance)
Table 7-E: Japanese Beef Edible Offal Imports YTD/CIF Price
Unit: Metric Ton (Customs Clearance Basis)
Partner Country Calendar Year Year To Date
2013 2014 % Chg. 2015 % Chg. 2016 % Chg. 06/2016 06/2017 % Chg.
World 59,164 61,317 4% 61,187 0% 67,329 10% 32,685 34,821 7% United States 30,794 32,926 7% 31,072 -6% 35,535 14% 16,526 19,773 20% Australia 19,246 19,554 2% 20,795 6% 18,186 -13% 9,447 8,288 -12% New Zealand 3,900 4,369 12% 4,733 8% 5,054 7% 2,977 2,389 -20%
Canada 2,469 2,307 -7% 2,598 13% 4,662 79% 2,114 2,092 -1%
Mexico 1,997 1,444 -28% 1,202 -17% 1,748 45% 874 656 -25%
Others 758 717 -5% 787 10% 2,144 172% 747 1,623 117%
Source of Data: World Trade Atlas (Japan Ministry of Finance)
Share Chart
Partner Country
Calendar Year Year To Date
2013 2014 Share
Source of Data: World Trade Atlas (Japan Ministry of Finance)
Unit: U.S. Dollar per Metric Ton
Partner Country Calendar Year Year To Date
2013 2014 % Chg. 2015 % Chg. 2016 % Chg. 06/2016 06/2017 % Chg.
World 8,977 9,313 4% 9,474 2% 11,515 22% 10,588 11,344 7%
United States 10,229 10,770 5% 11,486 7% 13,077 14% 12,185 12,677 4% Australia 7,710 7,593 -2% 7,538 -1% 10,174 35% 9,338 9,891 6% New Zealand 6,925 6,803 -2% 5,726 -16% 8,619 51% 7,757 8,358 8%
Canada 8,445 8,979 6% 9,432 5% 11,331 20% 10,486 11,453 9%
Mexico 7,201 8,383 16% 8,168 -3% 7,962 -3% 7,269 7,614 5%
Source of Data: Global Trade (Japan Ministry of Finance)
Unit: Metric Ton (Customs Clearance Basis)
Partner Country Calendar Year Year To Date
2013 2014 % Chg. 2015 % Chg. 2016 % Chg. 06/2016 06/2017 % Chg.
World 738,451 829,382 12% 790,650 -5% 861,179 9% 428,797 458,935 7% United States 281,144 276,033 -2% 259,475 -6% 264,071 2% 128,837 134,525 4% Canada 142,241 148,016 4% 165,828 12% 178,628 8% 86,460 103,273 19% Denmark 113,951 135,346 19% 110,055 -19% 118,339 8% 56,989 58,092 2% Spain 33,986 65,515 93% 73,925 13% 88,664 20% 47,089 52,692 12% Mexico 59,379 63,041 6% 69,642 10% 75,143 8% 36,890 42,717 16% Chile 29,522 26,847 -9% 22,412 -17% 27,485 23% 14,293 11,976 -16% Netherlands 13,082 19,921 52% 19,299 -3% 23,962 24% 11,988 12,369 3% Hungary 11,332 17,898 58% 21,392 20% 21,822 2% 12,785 11,035 -14% Germany 4,618 12,668 174% 9,011 -29% 15,170 68% 6,477 8,840 36% Others 49,196 64,097 30% 39,611 -38% 47,895 21% 26,989 23,416 n/a
EU-28 225,530 312,318 38% 270,063 -14% 313,749 16% 161,381 165,458 3%
Source of Data: Global Trade Atlas (Japan Ministry of Finance)
Calendar Year Year To Date
2013 2014 GrowthShare 2015 GrowthShare 2016 GrowthShare 06/2016 06/2017 GrowthShare
Source of Data: Global Trade Atlas (Japan Ministry of
Finance)
Unit: U.S. Dollar per Metric Ton
Partner Country Calendar Year Year To Date
2013 2014 % Chg. 2015 % Chg. 2016 % Chg. 06/2016 06/2017 % Chg.
World 5,414 5,226 -3% 4,442 -15% 4,847 9% 4,728 4,683 -1% United States 5,404 5,356 -1% 4,491 -16% 4,850 8% 4,725 4,681 -1% Canada 5,397 5,252 -3% 4,473 -15% 4,853 9% 4,733 4,687 -1% Denmark 5,379 5,027 -7% 4,337 -14% 4,831 11% 4,698 4,665 -1% Spain 5,604 5,210 -7% 4,408 -15% 4,851 10% 4,736 4,694 -1% Mexico 5,462 5,410 -1% 4,501 -17% 4,861 8% 4,756 4,695 -1% Chile 5,418 5,173 -5% 4,427 -14% 4,837 9% 4,721 4,683 -1% Netherlands 5,323 4,955 -7% 4,338 -12% 4,816 11% 4,701 4,671 -1% Hungary 5,535 5,032 -9% 4,357 -13% 4,791 10% 4,666 4,657 0% Germany 5,333 5,023 -6% 4,350 -13% 4,856 12% 4,756 4,664 -2%
EU-28 5,423 5,069 -7% 4,360 -14% 4,838 11% 4,721 4,676 -1% Source of Data: Global Trade Atlas (Japan Ministry of Finance)
Table 8-B: Japanese Pork Imports YTD, Chilled Cuts/CIF Price
Unit: Metric Ton (Customs Clearance Basis)
Partner Country Calendar Year Year To Date
World 294,043 300,058 2% 322,207 7% 355,505 10% 175,477 189,956 8% United States 198,493 187,709 -5% 187,829 0% 206,386 10% 103,366 104,280 1% Canada 86,993 101,107 16% 121,124 20% 137,233 13% 66,174 79,912 21% Mexico 8,404 11,194 33% 13,167 18% 11,838 -10% 5,910 5,743 -3%
Others 153 48 -69% 87 81% 48 -45% 27 21 -22%
EU-28 50 48 -4% 88 83% 49 -44% 28 22 -21%
Source of Data: Global Trade Atlas (Japan Ministry of Finance)
Share Chart
Partner Country
Calendar Year Year To Date
2013 2014 Share
Source of Data: Global Trade Atlas (Japan Ministry of Finance)
Unit: U.S. Dollar per Metric Ton
Partner Country Calendar Year Year To Date
2013 2014 % Chg. 2015 % Chg. 2016 % Chg. 06/2016 06/2017 % Chg.
World 5,401 5,428 1% 4,529 -17% 4,850 7% 4,731 4,688 -1%
United States 5,402 5,449 1% 4,526 -17% 4,842 7% 4,724 4,683 -1%
Canada 5,389 5,377 0% 4,518 -16% 4,858 8% 4,737 4,691 -1%
Mexico 5,399 5,479 1% 4,636 -15% 4,863 5% 4,751 4,701 -1%
EU-28 22,027 20,762 -6% 10,652 -49% 15,872 49% 16,181 15,917 -2% Source of Data: Global Trade Atlas (Japan Ministry of Finance)
Table 8-C: Japanese Pork Imports YTD, Frozen Cuts/CIF Price
Unit: Metric Ton (Customs Clearance Basis)
Partner Country Calendar Year Year To Date
2013 2014 % Chg. 2015 % Chg. 2016 % Chg. 06/2016 06/2017 % Chg.
World 444,408 529,324 19% 468,443 -12% 505,675 8% 253,319 268,979 6% Denmark 113,951 135,344 19% 110,030 -19% 118,339 8% 56,989 58,092 2% Spain 33,960 65,487 93% 73,902 13% 88,632 20% 47,070 52,676 12% Mexico 50,975 51,847 2% 56,475 9% 63,306 12% 30,980 36,974 19% United States 82,651 88,324 7% 71,646 -19% 57,685 -19% 25,471 30,246 19% Canada 55,248 46,909 -15% 44,705 -5% 41,395 -7% 20,286 23,361 15% Chile 29,522 26,847 -9% 22,412 -17% 27,485 23% 14,293 11,976 -16% Netherlands 13,082 19,921 52% 19,275 -3% 23,962 24% 11,988 12,369 3% Hungary 11,329 17,898 58% 21,391 20% 21,822 2% 12,784 11,034 -14% Germany 4,618 12,668 174% 9,011 -29% 15,170 68% 6,477 8,840 36% Others 49,072 64,079 31% 39,596 -38% 47,879 21% 26,981 23,411 -13%
EU-28 225,480 312,271 38% 269,974 -14% 313,701 16% 161,354 165,436 3% Source of Data: Global Trade Atlas (Japan Ministry of Finance)
Share Chart
Partner Country
Calendar Year Year To Date
2013 2014 GrowthShare 2015 GrowthShare 2016 GrowthShare 06/2016 06/2017 GrowthShare
World 100% 100% 0% 100% 0% 100% 0% 100% 100% 0%
Denmark 26% 26% 0% 23% -2% 23% 0% 22% 22% -1%
Spain 8% 12% 5% 16% 3% 18% 2% 19% 20% 1%
United States 19% 17% -2% 15% -1% 11% -4% 10% 11% 1%
Source of Data: Global Trade Atlas (Japan Ministry of Finance)
Unit: U.S. Dollar per Metric Ton
Partner Country Calendar Year Year To Date
2013 2014 % Chg. 2015 % Chg. 2016 % Chg. 06/2016 06/2017 % Chg.
World 5,423 5,112 -6% 4,382 -14% 4,845 11% 4,726 4,679 -1%
Denmark 5,379 5,027 -7% 4,337 -14% 4,831 11% 4,698 4,665 -1%
Spain 5,591 5,203 -7% 4,404 -15% 4,847 10% 4,731 4,691 -1%
Mexico 5,473 5,395 -1% 4,469 -17% 4,861 9% 4,756 4,694 -1%
United States 5,409 5,158 -5% 4,400 -15% 4,877 11% 4,730 4,673 -1% Canada 5,409 4,982 -8% 4,350 -13% 4,835 11% 4,723 4,674 -1%
Chile 5,418 5,173 -5% 4,427 -14% 4,837 9% 4,721 4,683 -1%
Netherlands 5,323 4,955 -7% 4,338 -12% 4,816 11% 4,701 4,671 -1% Hungary 5,529 5,032 -9% 4,357 -13% 4,791 10% 4,666 4,657 0% Germany 5,333 5,023 -6% 4,350 -13% 4,856 12% 4,756 4,664 -2%
EU-28 5,420 5,067 -7% 4,358 -14% 4,836 11% 4,719 4,674 -1%
Source of Data: Global Trade Atlas (Japan Ministry of Finance)
Table 8-D: Japanese Pork Imports YTD, Prepared and Processed Products/CIF Price
Unit: Metric Ton (Customs Clearance Basis)
Partner Country Calendar Year Year To Date
2013 2014 % Chg. 2015 % Chg. 2016 % Chg. 06/2016 06/2017 % Chg.
World 202,189 195,599 -3% 185,921 -5% 185,738 0% 92,803 102,324 10% United States 129,339 122,525 -5% 112,507 -8% 110,410 -2% 54,261 64,265 18% China 25,079 26,285 5% 23,115 -12% 22,847 -1% 11,521 12,577 9% Canada 18,344 20,486 12% 17,466 -15% 15,029 -14% 8,356 6,367 -24% Netherlands 2,191 4,535 107% 7,355 62% 8,283 13% 4,185 4,920 18%
Germany 72 63 -13% 2,851 4425% 7,080 148% 3,479 3,434 -1%
Thailand 8,386 6,840 -18% 7,176 5% 6,002 -16% 3,217 2,661 -17%
Denmark 3,941 3,444 -13% 4,028 17% 4,855 21% 2,556 2,056 -20%
Mexico 5,419 4,297 -21% 4,842 13% 4,557 -6% 2,002 2,385 19%
Italy 2,507 2,953 18% 3,053 3% 3,299 8% 1,406 1,652 17%
Chile 5,324 2,622 -51% 1,976 -25% 2,043 3% 1,177 1,073 -9%
EU-28 9,449 11,731 24% 18,207 55% 24,477 34% 12,061 12,855 7%
Source of Data: Global Trade Atlas (Japan Ministry of Finance)
Share Chart
Partner Country
Calendar Year Year To Date
2013 2014 Share
Growth 2015
Share
Growth 2016
Share
Growth 06/2016 06/2017
Italy 1% 2% 0% 2% 0% 2% 0% 2% 2% 0%
Chile 3% 1% -1% 1% 0% 1% 0% 1% 1% 0%
EU-28 5% 6% 1% 10% 4% 13% 3% 13% 13% 0%
Source of Data: Global Trade Atlas (Japan Ministry of Finance)
Unit: U.S. Dollar per Metric Ton
Partner Country Calendar Year Year To Date
2013 2014 % Chg. 2015 % Chg. 2016 % Chg. 06/2016 06/2017 % Chg.
World 3,857 4,279 11% 3,758 -12% 3,539 -6% 3,454 3,418 -1%
United States 3,279 3,810 16% 3,273 -14% 2,983 -9% 2,900 2,966 2%
China 4,920 4,835 -2% 4,618 -4% 4,555 -1% 4,430 4,450 0%
Canada 2,819 3,413 21% 2,862 -16% 2,677 -6% 2,647 2,505 -5%
Netherlands 2,578 3,174 23% 2,560 -19% 2,275 -11% 2,256 2,273 1% Germany 8,581 10,213 19% 2,671 -74% 2,656 -1% 2,633 2,403 -9%
Thailand 8,150 8,463 4% 8,081 -5% 8,809 9% 8,495 8,687 2%
Denmark 3,898 3,947 1% 3,429 -13% 3,860 13% 3,773 3,682 -2%
Mexico 3,956 4,142 5% 3,591 -13% 3,394 -5% 3,542 3,401 -4%
Italy 15,172 14,325 -6% 12,120 -15% 11,848 -2% 12,327 11,662 -5%
Chile 2,405 3,418 42% 3,231 -5% 2,927 -9% 2,841 2,801 -1%
EU-28 7,704 7,184 -7% 4,905 -32% 4,379 -11% 4,238 4,053 -4%
Source of Data: Global Trade Atlas (Japan Ministry of Finance)
Table 9: Average Auction Price of Japanese Feeder Calf for Beef JFY YTD
JFY (April - March)
Black Wagyu
Number Auctioned Average Price (Steer/Heifer) Average Weight Average Age
Head % Chg. 1,000 Yen/Head % Chg. Kg Day
2010 346,596 -11% 390 8% 278 290
2011 359,503 4% 399 2% 277 283
2012 361,557 1% 420 5% 278 282
2013 351,119 -3% 503 20% 277 278
2014 333,995 -5% 571 13% 277 276
2015 322,608 -3% 688 21% 278 276
2016 309,802 -4% 815 19% 282 278
JFY 2016 (April - March)
Apr. 25,498 -5% 633 633%
May 26,946 -5% 640 24%
Jun. 23,748 -5% 643 22%
Jul. 28,858 -4% 642 22%
Aug. 19,523 -4% 657 23%
Sept. 27,310 -3% 668 22%
Oct. 23,578 -2% 672 22%
Nov. 26,608 -6% 693 20%
Dec. 26,679 -3% 727 17%
2017 Jan. 29,458 -2% 739 14%