1st REPORT OF
THE MALAYSIAN REGISTRY
of
RENAL BIOPSY
Editors: Rosnawati Yahya Wan Jazilah Wan Ismail
With contribution by:
1
st
REPORT OF
THE MALAYSIAN REGISTRY
of
RENAL BIOPSY
Sponsors:s:
Malaysian Society of Nephrology
The National Renal Registry is funded with grants from:
The Ministry of Health Malaysia Ain Medicare
Baxter Healthcare Fresenius Medical Care
Roche
December
© National Renal Registry, Malaysia
)SSN
-Published by:
The National Renal Registry
Malaysian Society of Nephrology
nd
Floor, MMA (ouse
, Jalan Pahang
Kuala Lumpur
Malaysia
Telephone. :
Direct Fax :
e-mail :
[email protected]
Web site :
http://www.msn.org.my/nrr
Cover illustration by Dr. Nik (asimah Nik Yahya (KL
Important information:
This report is copyrighted. (owever it may be freely reproduced without the permission
of the National Renal Registry. Acknowledgment would be appreciated. Suggested
citation is:
Rosnawati Yahya, Wan Jazilah W ) Eds First Report of the Malaysian Registry of Renal
Biopsy. Kuala Lumpur
This report is also published electronically on these websites
http://www.msn.org.my/
The National Renal Registry would like to thank the following:
All the nephrologists and staff of the participating hospitals
for their hard work and contribution,
The Ministry of Health, Malaysia for support seen and unseen,
For their generous support: -
Ain Medicare
Baxter Healthcare
Fresenius Medical Care
Roche
The staff of the Clinical Research Centre particularly Lim Jie Ying,
Hoo Ling Ping and Azizah Alimat
&
All who have in one way or another supported the National Renal
Registry.
NRR ADVISORY COMMITTEE MEMBERS
2008 to 2010
MSN Nominees
Chairman
Dato’Dr. Zaki Morad B Mohd Zaher
Members
Dr. Lim Teck Onn
Dr. Lim Yam Ngo
Dr. T. Thiruventhiran
Dr. Tan Hee Wu
Dr. Wong Hin Seng
ADMAN Nominees
Members
Tam Chong Chiang
Fauziah Nizamudin
Secretariat
Lee Day Guat
Clinical Registry Manager
Lee Day Guat
Clinical Research Assistant
Suhazelini Ali
Choo Cheh Loo
Anis Aizza Zainudin
Nur Hasliana Abdul Halit
MRRB SREERING COMMITTEE MEMBERS
MSN Nominees
Chairperson
Dato’ Dr Wan Shaariah Md Yusuf
Members
Dr Lim Soo Kun
Dr Rosnawati Yahya
Dr Sunita Bavanandan
Dr Wan Jazilah Wan Ismail
Dr Wong Hin Seng
Dr Yap Yoke Chin
CRC Technical Support Staff
Director
Dr. Lim Teck Onn
Epidemiologist
Dr. Jamaiyah Haniff
IT Manager
Celine Tsai Pao Chien
Database Administrator
Lim Jie Ying
Network Administrator
Kevin Ng Hong Heng
Adlan Ab Rahman
Scott Huang Li Surin
Statistician
Hoo Ling Ping
Siti Haryanie Abdul Aziz
Webmaster
Patrick Lum See Kai
ABOUT MALAYSIAN REGISTRY OF RENAL BIOPSY
Renal biopsy remains the main investigation in the diagnosis of renal diseases. In addition, it
plays a major role in determining the management and prognosis of parenchymal renal
disease. The collection of demographic, clinical and laboratory data at the time of biopsy and
the set up of a database are useful tools for studying renal parenchymal diseases.
The development of a renal biopsy registry in each country promotes many advantages and
these include comparison in incidence of renal diseases, identification of different policies
and practices in renal biopsy in different areas, linkage with other registries such as dialysis or
transplant registry and identification of rare renal diseases. Thus, the registry is a source of
epidemiological data and would provide useful information in the planning of health care and
in organizing prospective clinical studies.
The incidence of glomerular disease varies according to population, demographic
characteristics, environmental factors, socio-economic status and the prevalence of
infectious diseases. At present, there is limited information on the prevalence and incidence
of glomerular disease, its potential disease burden and the temporal trend in Malaysia.
Hence, the Malaysian Registry of Renal Biopsy (MRRB) was set up in 2005 to address this
deficiency.
The MRRB collects information about patients who undergo renal biopsy in Malaysia. The
MRRB is a new component of National Renal Registry (NRR), which has been operating the
Malaysian Dialysis and Transplant Registry (MDTR) since 1993.
Objectives
The objectives of the MRRB registry are to:
1. Determine the disease burden attributable to glomerular disease (GD) by quantifying its
incidence and prevalence, and its geographic and temporal trends in Malaysia.
2. Identify subgroups in the population at high risk of GD to whom preventive efforts should
be targeted.
3. Identify potential causal and risk factors involved in GD.
4. Describe the clinical presentation and spectrum of GD.
5. Stimulate and facilitate basic, clinical and epidemiological research on GD.
6. Identify causes of allograft failure in our renal transplant population.
Organization
The NRR organization is as follows:
Owner
Source Data Providers Target groups or Users
Owner
The Malaysian Society of Nephrology (MSN) is the owner of this registry.
Sponsors
The MRRB is sponsored by the Malaysian Society of Nephrology (MSN) and the Ministry of
Health, Malaysia.
NRR Advisory Committee
This is the committee established by the sponsors. The NRR Advisory Committee’s role is to
ensure that the MRRB stay focused on its objectives and to assure its continuing relevance
and justification.
MRRB Steering Committee
The MRRB Working Committee supervises its operations.
National Renal Registry Office
The NRR coordinating office is the designated coordinating center. It coordinates the data
collection among the Source Data Providers (SDPs). It collaborates with Clinical Research
Centre of Hospital Kuala Lumpur that provides epidemiological and statistical support for
MRRB.
Source Data Providers (SDP)
These are centres that contribute the required data for MRRB. The SDP collects and enters
data directly through the on-line web-base system. The pilot phase of the registry consists of
SDPs from Ministry of Health.
To Participate in MRRB
Centres interested to participate in this registry please write in to NRR officially via post or
[email protected]
.
The following documents need to be completed and returned to facilitate participation.
•Centre Participation Self Reply Form
•
Authorization Form
•
Information Security Policy/User Agreement . One form per nominee as listed in the
Au-thorization form. Users must have a personal mobile phone to received SMS
authentica-tion.
Upon receiving these documents, the centre shall be registered and each of the users of the
MRRB shall be notified via their e-mail address.
Methodology
All patients from participating centres who undergo any kidney biopsy (native or graft) are to
be enrolled into the registry.
PARTICIPATING CENTRES AT DECEMBER 2007
SDP Name
Adult
Nephrology
Paediatric
Nephrology
Kuala Lumpur Hospital
√
√
Sultanah Bahiyah Hospital, Alor Star
√
Pulau Pinang Hospital
√
√
Raja Permaisuri Bainun Hospital, Ipoh
√
Tengku Ampuan Rahimah Hospital, Kelang
√
Tuanku Ja'afar Hospital, Seremban
√
√
Melaka Hospital
√
Sultanah Aminah Hospital, Johor Bharu
√
Tengku Ampuan Afzan Hospital, Kuantan
√
√
Sultanah Nur Zahirah Hospital, Kuala Terengganu
√
Raja Perempuan Zainab II Hospital, Kota Bharu
√
Queen Elizabeth Hospital, Kota Kinabalu
√
Sarawak General Hospital
√
Selayang Hospital
√
√
Sultan Ismail Hospital, Pandan
√
CONTRIBUTING EDITORS
Chapter Title
Authors
Institutions
1
Overview of Renal Biopsy
in Malaysia
Wan Shaariah Md Yusuf
Tuanku Jaafar Hospital
Lee Ming Lee
Tuanku Jaafar Hospital
Lee Day Guat
National Renal Registry
2
Primary
Glomerulonephritis
Sunita Bavanandan
Kuala Lumpur Hospital
Lee Han Wai
Queen Elizabeth Hospital
Lim Soo Kun
University
Malaya
Medical Centre
3
Secondary
Glomerulonephritis
Rosnawati Yahya
Kuala Lumpur Hospital
Liew Yew Fong
Penang
Hospital
4
Lee Ming Lee
Tuanku Jaafar Hospital,
Seremban
Lim Yam Ngo
Kuala Lumpur Hospital
Lynster Liaw
Pulau Pinang Hospital
Susan Pee
Sultan Ismail Hospital,
Johor
Wan Jazilah Wan Ismail
Selayang
Hospital
Yap Yoke Chin
Kuala Lumpur Hospital
5
Renal Allograft Biopsy
Wong Hin Seng
Selayang
Hospital
Paediatric Renal Biopsy
Report Editors
Rosnawati Yahya
CONTENTS
1
1.1 Introduction 2
1.2 Renal biopsies from the participating centres 2
1.2.1 Ascertainment rate of total biopsy performed 2
1.2.2 Type of renal biopsy performed 3
1.2.3 Number of renal biopsy done on each individual patient 4
1.2.4 Demographic distribution of renal biopsy (Native and Graft) 5
1.2.4.1 Age distribution 5
1.2.4.2 Gender distribution 7
1.2.4.3 Racial distribution 7
1.2.5 Renal Biopsy Report Analysis 8
1.2.6 Histopathology specimen distribution to histopathology laboratories 9
1.3 Native kidney biopsy 10
1.3.1 Clinical Indications of renal biopsy 10
1.3.2 Histopathological Diagnosis 11
1.3.3 Histopathology findings in common clinical presentation 12
1.3.3.1 Histopathological diagnosis in patients with nephrotic syndrome 12
1.3.3.2 Histopathological diagnosis in patients with urinary abnormalities 12
1.3.3.3 Histopathological diagnosis in patients with nephritic-nephrotic
syndrome 13
1.3.3.4 Histopathological diagnosis in patients with nephritic syndrome 13
1.3.3.5 Primary GN according to various age group 14
CHAPTER 1 OVERVIEW OF RENAL BIOPSY IN MALAYSIA
15
2.1 Introduction 16
2.2 Minimal Change Disease 16
2.2.1 Introduction 16
2.2.2 Patient population and characteristics 16
2.2.3 Clinical presentation 17
2.2.3.1 Clinical presentation by age 17
2.2.3.2 Clinical presentation by gender 18
2.2.4 Renal function at presentation 18
2.3 Focal Segmental Glomerulosclerosis 19
2.3.1 Introduction 19
2.3.2 Patient population and characteristics 19
2.3.3 Clinical Presentation 20
2.3.3.1 Clinical presentation by age 21
2.3.3.2 Clinical presentation by gender 21
2.3.4 Renal function at presentation 22
2.3.4.1 Renal function at presentation by age 22
2.3.4.2 Renal function at presentation by gender 23
2.4 Idiopathic Membranous Nephropathy 24
2.4.1 Introduction 24
2.4.2 Patient population and characteristics 24
2.4.3 Clinical presentation 25
2.4.3.1 Clinical Presentation by age 26
2.4.3.2 Clinical presentation by gender 26
2.4.4 Renal function at presentation 27
2.5 IgA Nephropathy (IgAN) 28
2.5.1 Introduction 28
2.5.2 Patient population and characteristics 28
2.5.3 Clinical presentation 29
2.5.3.1 Clinical presentation by age 30
2.5.3.2 Clinical presentation by gender 30
2.5.4 Renal function at presentation 31
References 32
CHAPTER 3 SECONDARY GLOMERULONEPHRITIS 33
3.1 Lupus Nephritis 34
3.1.1 Introduction 34
3.1.2 Patient population and characteristics 34
3.1.2.1 Age at time of biopsy 34
3.1.2.2 Gender distribution 34
3.1.2.3 Racial prevalence 34
3.1.3 Clinical presentation 35
3.1.3.1 Clinical Presentation by age 36
3.1.3.2 Clinical presentation by gender 37
3.1.3.3 Clinical Presentations by histopathology 38
3.1.4 Renal function at presentation 39
3.1.4.1 Renal function at presentation by age group 39
3.1.4.2 Renal function at presentation by gender 40
3.1.4.3 Renal function at presentation by histopathology 40
3.1.5 Histopathological diagnosis 41
3.1.5.1 Histopathological diagnosis by age 42
3.1.5.2 Histopathological diagnosis by gender 43
3.1.5.3 Histopathological diagnosis by clinical presentation 43
3.1.6 Extra-renal involvement 44
3.1.6.1 American Rheumatological Association (ARA) criteria in lupus
ne-phritis. 44
3.1.6.2 ARA criteria in lupus nephritis by age 44
3.1.6.3 ARA criteria in lupus nephritis by gender 44
3.1.6.4 ARA criteria in lupus nephritis by histopathological findings 44
3.1.6.5 Extra-renal involvement. 45
CHAPTER 4 PAEDIATRIC RENAL BIOBSY 46
4.1 Introduction 47
4.2 Number of patients and renal biopsies 47
4.2.1 Total number of patients and native renal biopsies 47
4.2.2 Number of native renal biopsies from various hospitals 47
4.3 Outcome of renal biopsies 47
4.4 Patient characteristics 47
4.5 Clinical presentation 48
4.5.1 Clinical presentation at biopsy 48
4.5.2 Renal function at biopsy 48
4.6 Diagnosis of paediatric renal biopsies 48
4.7 Renal histopathology diagnosis of children presenting with nephrotic syndrome 49 4.8 Renal histopathology diagnosis of children presenting with nephritic syndrome. 49
4.10 Paediatric focal segmental glomerulosclerosis and minimal change disease 50 4.10.1 Characteristics of paediatric focal segmental glomerulosclerosis and minimal
change disease 50
4.10.2 Patient survival in focal segmental glomerulosclerosis and minimal change
disease 51 4.10.3 Renal survival of patient with focal segmental glomerulosclerosis and minimal
change disease 52
4.11 Paediatric lupus nephritis 53
4.11.1 Patient characteristics of paediatric lupus nephritis 53 4.11.2 Extra renal manifestation of paediatric SLE 53 4.11.3 Classification of paediatric lupus nephritis 53
4.12 Renal outcome 53
4.13 Biopsy failure and complication 54
4.13.1 Risk factors for biopsy failure 54
4.13.2 Complications 54
4.13.3 Risk factors for complication 55
References 56
CHAPTER 5 RENAL ALLOGRAFT BIOPSY 57
5.1 Introduction 58
5.2 Number of renal allograft biopsy 58 5.2.1 Number of renal allograft biopsy by year 58 5.2.2 Number of renal allograft biopsy by year and site 58 5.2.3 Number of renal allograft biopsy by year and age group. 59
5.3 Clinical presentation at biopsy 59
5.4 Timing of renal allograft biopsy 60
5.5 Biopsy Procedure 61
5.5.1 Biopsy method 61
5.5.2 Number of passes 61
5.5.3 Number of glomeruli obtained on biopsy 62
5.5.4 Type of complications 62
5.6 Histological diagnosis 63
L)ST OF TABLES
Page Table 1.2.1 Total number of reported and unreported renal biopsies by centres,
2005 - 2007 2
Table 1.2.2 Distribution of reported native and graft renal biopsies by centres,
2005-2007 3
Table 1.2.3 (a) Distribution of native renal biopsy in patients by number of episodes /
attempts 4
Table 1.2.3 (b) Distribution of renal allograft biopsy in patients by number of episodes /
attempts 4
Table 1.2.4.1 (a) Age distribution of native renal biopsy, 2005-2007 5 Table 1.2.4.1 (b) Age distribution of renal allograft biopsy, 2005-2007 5 Table 1.2.4.1 (c) Age group distribution of reported renal biopsies by state, 2005-2007 6 Table 1.2.4.2 (a) Gender distribution of native renal biopsy, 2005-2007 7 Table 1.2.4.2 (b) Gender distribution of renal allograft biopsy, 2005-2007 7 Table 1.2.4.3 (a) Racial distribution of native renal biopsy, 2005-2007 7 Table 1.2.4.3 (b) Racial distribution of renal allograft biopsy, 2005-2007 7 Table 1.2.5 Number of glomeruli obtained at each biopsy by centres, 2005-2007 8 Table 1.2.6 (a) Distribution of biopsy specimens to histopathology laboratories by
participating centres, 2005-2007 9
Table 1.2.6 (b) Histopathology laboratories receiving renal biopsy specimens,
2005-2007 10
Table 1.3.1 (a) Indications for native renal biopsies, 2005-2007. 10
Table 1.3.1 (b) Renal function at time of biopsy 10
Table 1.3.2 Histopathology of all native renal biopsies, 2005-2007 11 Table 1.3.3.1 Histopathological diagnosis in patients presenting with nephrotic
syndrome 12
Table 1.3.3.2 Histopathological diagnosis in patients presenting with urine
abnormalities, 2005-2007 12
Table 1.3.3.3 HPE diagnosis in patients presenting with nephritic-nephrotic syndrome,
2005-2007 13
Table 1.3.3.4 Histopathological diagnosis in patients presenting with nephritic
syndrome, 2005-2007 13
Table 1.3.3.5 Primary GN according to the various age group, 2005 -2007 14 Table 2.2.2 (a) Demographic characteristics for minimal change disease, 2005-2007 16 Table 2.2.2 (b) Age group at time of biopsy (years) for minimal change disease,
2005-2007 16
Table 2.2.3 (a) Overall clinical presentation for minimal change disease, 2005-2007 17 Table 2.2.3 (b) Presence of hypertension in minimal change disease, 2005-2007 17 Table 2.2.3.1 Clinical presentation by age group for minimal change disease,
2005-2007 17
Table 2.2.3.2 Clinical presentation by gender for minimal change disease, 2005-2007 18 Table 2.2.4 Renal function at presentation by age group for minimal change disease,
2005-2007 18
Table 2.3.4 (a) Impaired renal function in FSGS by year, 2005-2007 22 Table 2.3.4.1 Renal function at presentation by age group for FSGS, 2005-2007 22 Table 2.3.4.2 Renal function at presentation according to gender for FSGS, 2005-2007 23 Table 2.4.2 Demographic characteristics for idiopathic membranous nephropathy,
2005-2007 24
Table 2.4.3 (a) Overall clinical presentation for idiopathic membranous nephropathy,
2005-2007 25
Table 2.4.3 (b) Presence of hypertension in idiopathic membranous nephropathy,
2005-2007 25
Table 2.4.3.1 Clinical presentation by age group for idiopathic membranous
nephropathy, 2005-2007 26
Table 2.4.3.2 Clinical presentation by gender for idiopathic membranous nephropathy,
2005-2007 26
Table 2.4.4 (a) Renal function at presentation by age group for idiopathic membranous
nephropathy, 2005-2007 27
Table 2.4.4 (b) Renal function at presentation according to gender for idiopathic
membranous nephropathy, 2005-2007 27
Table 2.5.2 (a) Demographic characteristics of patients with IgA nephropathy,
2005-2007 28
Table 2.5.2 (b) Age group at time of biopsy (years) for IgA nephropathy, 2005-2007 28 Table 2.5.3 (a) Overall clinical presentation for IgA nephropathy, 2005-2007 29 Table 2.5.3 (b) Presence of hypertension in IgA nephropathy, 2005-2007 29 Table 2.5.3.1 Clinical presentation by age group for IgA nephropathy, 2005-2007 30 Table 2.5.3.2 Clinical presentation by gender for IgA nephropathy, 2005-2007 30 Table 2.5.4 (b) Renal function at presentation by age group for IgA nephropathy,
2005-2007 31
Table 2.5.4 (c) Renal function at presentation according to gender for IgA nephropathy,
2005-2007 32
Table 3.1.3 Clinical presentation by year, 2005-2007 35 Table 3.1.3.1 (a) Clinical presentation by age group, 2005-2007 36 Table 3.1.3.3 (a) Clinical presentations by histopathology, 2005-2007 38 Table 3.1.4.1 Renal function by age group, 2005-2007 39 Table 3.1.4.3 Renal function at presentation by histopathology, 2005-2007 40 Table 3.1.5 Histopathological diagnosis, 2005-2007 41 Table 3.1.5.1 Histopathological diagnosis by age group, 2005-2007 42 Table 3.1.5.2 Histopathological diagnosis by gender, 2005-2007 43 Table 3.1.5.3 Histopathological diagnosis by clinical presentation, 2005-2007 43 Table 3.1.6.1 ARA criteria in lupus nephritis, 2005-2007 44 Table 3.1.6.5 (a) Extra-renal involvement by gender, 2005-2007 45 Table 3.1.6.5 (b) Mucocutaneous involvement by gender, 2005-2007 45
Table 4.2.2 Number of renal biopsies 47
Table 4.4 Gender and racial distribution 47
Table 4.5.1 Clinical presentation at biopsy 48
Table 4.5.2 Renal function at biopsy 48
Table 4.6 Diagnosis of paediatric renal biopsies 48
Table 4.7 Renal histopathology diagnosis of children presenting with nephrotic
syndrome 49
Table 4.8 Renal histopathology diagnosis of children presenting with nephritic
syndrome 49
Table 4.9 Causes of acute renal failure in children who underwent renal biopsy 50
Table 4.10.1 Characteristic of paediatric focal segmental glomerulosclerosis and
minimal change disease 50
Table 4.10.2 Patient survival for focal segmental glomerulosclerosis and minimal
change disease 51
Table 4.10.3 Renal survival of patient with focal segmental glomerulosclerosis and
minimal change disease 52
Table 4.11.3 Classification of paediatric lupus nephritis 53 Table 4.12 Causes of end stage renal disease in children who underwent renal
biopsy 53
Table 4.13.1 Risk factors for biopsy failure 54
Table 4.13.2 Frequency of complication 54
Table 4.13.3 Risk factors for complication 55
Table 5.2.1 Number of renal allograft biopsy, 2004-2007 58 Table 5.2.2 Number of renal allograft biopsy by year and SDP, 2004-2007 58 Table 5.2.3 Renal allograft biopsy by year and age group, rate (per million
population), 2004-2007 59
Table 5.3 Indications for renal allograft biopsy, 2004-2007 59 Table 5.4 Timing of renal allograft biopsy, 2004-2007 60
Table 5.5.1 Biopsy method, 2004-2007 61
Table 5.5.2 Number of passes, 2004-2007 61
Table 5.5.3 Number of glomeruli obtained on biopsy, 2004-2007 62
Table 5.5.4 Type of complications, 2004-2007 62
Table 5.6 Histological diagnosis, 2004-2007 63
LIST OF
FIGURES
Page Figure 1.3.3.5 Primary GN according to the various age group, 2005 -2007 14 Figure 2.2.2 (b) Age at time of biopsy (years) for minimal change disease, 2005-2007 16 Figure 2.2.4 Impaired renal function by age group for minimal change disease,
2005-2007 18
Figure 2.3.2 (b) Age at time of biopsy (years) for FSGS, 2005-2007 19 Figure 2.3.3 (a) Overall clinical presentation for FSGS, 2005-2007 20 Figure 2.3.3.2 Clinical presentation by gender for focal segmental glomerulosclerosis,
2005-2007 21
Figure 2.3.4.1 (a) Renal function at presentation by age group for FSGS, 2005-2007 22 Figure 2.3.4.1 (b) Impaired renal function in FSGS by age group, 2005-2007 22 Figure 2.3.4.2 Renal function at presentation according to gender for FSGS, 2005-2007 23 Figure 2.4.2 Age at time of biopsy (years) for idiopathic membranous nephropathy,
2005-2007 24
Figure 2.4.3 (a) Overall clinical presentation for idiopathic membranous nephropathy,
2005-2007 25
Figure 2.4.3.2 Clinical presentation by gender for idiopathic membranous nephropathy,
2005-2007 26
Figure 2.4.4 (a) Renal function at presentation by age group for idiopathic membranous
nephropathy, 2005-2007 27
Figure 2.5.2 (b) Age at time of biopsy (years) for IgA nephropathy, 2005-2007 28 Figure 2.5.3 (a) Overall clinical presentation for IgA nephropathy, 2005-2007 29 Figure 2.5.4 (a) Impaired renal function by age group, 2005-2007 31 Figure 2.5.4 (b) Renal function at presentation by age group for IgA nephropathy,
2005-2007 31
Figure 3.1.2.1 Age group at time of biopsy (years), 2005-2007 34
Figure 3.1.2.2 Gender distribution, 2005-2007 34
Figure 3.1.2.3 Racial distribution, 2005-2007 34
Figure 3.1.3 (a) Hypertension by year, 2005-2007 35
Figure 3.1.6.3 ARA criteria in lupus nephritis by gender, 2005-2007 44 Figure 3.1.6.4 ARA criteria in lupus nephritis by histopathology, 2005-2007 44 Figure 3.1.6.5 (a) Extra-renal involvement by gender, 2005-2007 45 Figure 3.1.6.5 (b) Mucocutaneous involvement by gender, 2005-2007 45 Figure 4.10.2 Patient survival by focal segmental glomerulosclerosis and minimal
change disease 51
Figure 4.10.3 Renal survival by focal segmental glomerulosclerosis and minimal change 52 Figure 5.2.1 Number of renal allograft biopsy, 2004-2007 58 Figure 5.4 Timing of renal allograft biopsy, 2004-2007 60 Figure 5.5.1 Biopsy method (censored for missing data), 2004-2007 61
Figure 5.5.2 Number of passes, 2004-2007 61
Figure 5.5.3 Number of glomeruli obtained on biopsy, 2004-2007 62
REPORT SUMMARY
Chapter 1: Overview of Renal Biopsy in Malaysia
• A total of 2419 renal biopsies were done over 3 years (2005-2007). Twenty-one MOH centers contributed data and these were analyzed in this first MRRB report.
• However Paediatric Institute, HKL started data collection from 1999 and the Nephrology department HKL started data collection on renal allograft biopsies from 2004. This will be discussed in their respective chapters.
• The average ascertainment rate for 2005-2007 was 93.3%. • 281(11.6%) of these were graft biopsies.
• About a fifth (19%) was done in children under 15 years of age. Majority (75%) was done in patients between 15 – 55 years of age. Only 4% was done in patients older than 55 years of age. • 21.3% of the biopsies yielded less than 10 glomeruli; the cutoff number for an adequate biopsy. • More than half (55%) of the biopsies done were sent out to another (tertiary) centre for
processing and reporting.
• The main indications for biopsy were nephrotic syndrome (46%) and asymptomatic urinary abnormalities (26%).
• FSGS (26.1%) and minimal change disease (25.8%) were the commonest histopathological diagnosis in patients presenting with nephrotic syndrome.
• Lupus nephritis (52%) was the commonest histopathological diagnosis in patients who presented with acute nephritic syndrome.
• The commonest primary GN reported was FSGS (36%) followed by minimal change (32%) and IgA nephropathy (15%).
• The commonest secondary GN was lupus nephritis (87%).
Chapter 2: Primary Glomerulonephritis
• The commonest primary GN reported was focal segmental glomerulosclerosis (FSGS), followed by minimal change.
Minimal change disease
• Mean age at the time of biopsy was 28.6 + 12.5 years • Male to female ratio was 2:1
• Nephrotic syndrome was the commonest clinical presentation. • 22% had e-GFR <60 ml/min at time of biopsy.
• There is a higher risk of renal impairment with increasing age
Focal Segmental Glomerulosclerosis (FSGS)
• Mean age at the time of biopsy was 32.1 + 13.5 years. • Male to female ratio was 1.3:1
• Nephrotic syndrome was the commonest clinical presentation • 43% had e-GFR < 60 ml/min at time of biopsy
Idiopathic membranous nephropathy
• Accounts for only 8% of total primary GN • Mean age at biopsy was 46 + 15.5 years. • There was bimodal peak in incidence • Male to female ration was 1.1:1
• 71% presented with nephrotic syndrome • 38% had e-GFR < 60 ml/min at time of biopsy
• There is a higher risk of renal impairment with increase age and male gender.
IgA nephropathy
• Accountf for 1% of Total primary GN Accounts for only 8% of total primary GN • Mean age at biopsy was 33.7 + 12.4 years
• There was female prepondence with male to female ration was 0.8 : 1
• 50% presented with asymptomatic urine abnormalities and up to 25% presented with nephrotic syndrome
• 48% had e-GFR < 60 ml/min at time of biopsy
• There is a higher risk of renal impairment with increase age and male gender.
Chapter 3: Secondary Glomerulonephritis
Lupus nephritis
• Lupus nephritis was the commonest secondary GN.
• The mean age of lupus nephritis in adults (>15 years old) was 30.2 + 10.3. • The female to male ratio was 6.2:1.
• The most common clinical presentation of lupus nephritis was urine abnormalities (39%), followed by nephrotic syndrome (29%).
• The commonest histopathological finding was WHO or ISN/RPS class IV or IV+V. (59%)
• There were no clear correlation between histopathological findings and clinical presentation. However, class IV or class IV+V were more likely to present with symptomatic renal disease (52%), • The prevalence of hypertension was higher in class IV or class IV+V
• The prevalence of impaired kidney function correlated with histopathological findings. Class IV are more likely to have impaired function.
Chapter 4: Paediatric Renal Biopsy
• Paediatric Institute Hospital Kuala Lumpur contributed data from 1999. Subsequently 6 other MOH paediatric nephrology centers submitted data following the establishment of MRRB.
• 640 renal biopsies were performed in 579 children. 606 (94.7%) were assessed to be adequate for interpretation.
• More renal biopsies were performed in girls (52.2%) This was attributed to the higher number of biopsies performed on children with lupus nephritis.
• Nephrotic syndrome was the most frequent clinical presentation at biopsy.
• The commonest histopathological diagnoses were FSGS, lupus nephritis and MCD and this accounted for 27.2%, 26.1% and 17.8 % respectively.
• IgA nephropathy accounted for only 4.4%. This may not be an accurate indicator of incidence of IgA in Malaysian children due to differences in biopsy practices.
• Children who presented with acute renal failure at the time of biopsy had histopathological diagnoses of post infectious GN (29.8%), lupus nephritis
• (29.8%) FSGS (8.7%) and HUS/TTP (5.8%). In contrast HUS/TTP is the leading cause of acute renal failure in North America and Europe.
• Children with FSGS had significantly lower creatinine clearance at biopsy. There were also more Indian children in the FSGS group compared to the MCD group.
• Comparing FSGS and MCD groups there were no differences in the patients’ 3 and 5 years survival from the time of biopsy. However FSGS had poorer renal survival both at 3 years (92%) and 5 years (82%). Renal survival for the MCD group was 94% at both 3 and 5 years.
• In the paediatric lupus group class IV and V+IV was the commonest histopathological finding on biopsy at 65.7%.
• Complications post-renal biopsy was reported in 5.4%. Gross haematuria was the commonest complication at 4.5%.
• Risk of complication was highest in those who had dialysis dependant renal failure. Age, Hb, lupus nephritis and needle size were not found to have any significant impact.
Chapter 5: Renal Allograft Biopsy
• Department of Nephrology, Hospital Kuala Lumpur contributed data since 2004 and by 2005, submission of data were performed by other MOH hospitals.
• The number of renal allograft biopsy has almost doubled over the last 4 years despite a decreased in the number of new transplants. This was attributed to the changing trend in the management of renal transplant recipients.
• 92% of the renal allograft biopsies were performed in 4 centers in the Klang valley. Three of these centres were actively involved in the care of new recipients in the perioperative and immediate postrenal transplant period. A large number of transplant recipients were also followed up in these centers.
• The commonest indication for renal allograft biopsy was impaired renal allograft dysfunction and acute renal allograft dysfunction.
• There was a marked increased in the number of renal allograft biopsies performed after 1 year post transplant in both 2006 and 2007. This reflected the increasing importance of chronic allograft nephropathy.
• Most renal allograft biopsies were performed under ultrasound guidance and this accounted for 84% in 2007.
• Complications were uncommon and major complications requiring intervention occurred in less than 2%.
• Acute rejection (acute and borderline) has remained the commonest histological diagnosis. This accounted for 31-34% of all renal allograft biopsies.
1st Report of the
Malaysian Registry of Renal Biopsy 2007
OVERVIEW OF RENAL BIOPSY IN MALAYSIA
CHAPTER 1
Overview Of Renal Biopsy In Malaysia
Wan Sha’ariah Md Yusuf
Lee Ming Lee
OVERVIEW OF RENAL BIOPSY IN MALAYSIA
1st Report of the Malaysian Registry of Renal Biopsy 2007
1.1: Introduction
The Malaysian Registry of Renal Biopsy (MRRB) was first established on the 1st of January 2005. It started off as a pilot project involving centers with nephrology services within the Ministry of Health Malaysia. In its infancy, this registry was called GN Registry but subsequently changed to MRRB as it was deemed to be more appropriate.
Before MRRB, there were two known existing databases in MOH hospitals related to renal biopsy. They were the paediatric (Paediatric Institute, HKL) renal biopsy database (1993 – 2004) and adult HKL renal biopsy database (2004). This will be elaborated in their respective chapters subsequently.
The MRRB data collection is still on going. In 2008, the participation was opened to non-MOH nephrologists and renal physicians. Thus, the subsequent reports will include data from all the MOH centres, universities and private hospitals.
1.2: Renal biopsies from the participating centres
1.2.1 Ascertainment rate of total biopsy performedFrom 2005 to 2007, a total of 21 centres (15 adult and 6 paediatric) from the Ministry of Health (MOH) submitted data to the MRRB. These participating centres will be identified by their source document provider (SDP) number.
In 2005, a total 749 renal biopsies were performed and of these, 716 were reported. In 2006, 991 renal biopsies were performed and 927 were reported. In 2007, 853 renal biopsies were performed and of these 776 were reported. This gives an ascertainment rate of 95.6% for 2005, 93.5% for 2006 and 91% in 2007. The average ascertainment rate for 2005-2007 was 93.3% (Table 1.2.1)
Table 1.2.1: Total number of reported and unreported renal biopsies by centres, 2005 – 2007
1st Report of the
Malaysian Registry of Renal Biopsy 2007
OVERVIEW OF RENAL BIOPSY IN MALAYSIA
1.2.2 Type of renal biopsy performed
As expected, majority of the biopsies reported were from native kidneys: 90.2% in 2005, 87.5% in 2006 and 87.8% in 2007. The rest were from graft kidneys (Table 1.2.2).
Table 1.2.2: Distribution of reported native and graft renal biopsies by centres, 2005-2007
centre
2005 2006 2007 Total
Native Graft Native Graft Native Graft Native Graft
n n n n n n n % n %
1 69 28 57 50 58 43 184 9 121 43
2 2 0 10 0 24 0 36 2 0 0
3 85 12 93 11 63 2 241 11 25 9
4 13 0 17 1 19 0 49 2 1 0
5 27 1 36 2 42 2 105 5 5 2
6 26 5 34 10 43 13 103 5 28 10
7 27 0 27 1 23 1 77 4 2 1
8 10 0 5 0 11 0 26 1 0 0
9 21 0 25 2 20 1 66 3 3 1
10 68 0 79 2 61 0 208 10 2 1
11 0 0 42 0 4 0 46 2 0 0
12 0 0 2 0 7 0 9 0 0 0
13 18 0 6 0 0 0 24 1 0 0
14 15 0 24 0 27 0 66 3 0 0
15 35 4 48 3 44 0 127 6 7 3
16 72 2 99 2 61 2 232 11 6 2
17 41 1 38 13 33 9 112 5 23 8
18 73 17 122 18 87 22 282 13 57 20
19 16 0 23 1 14 0 53 3 1 0
20 28 0 24 0 37 0 89 4 0 0
21 0 0 0 0 3 0 3 0 0 0
OVERVIEW OF RENAL BIOPSY IN MALAYSIA
1st Report of the Malaysian Registry of Renal Biopsy 2007
1.2.3: Number of renal biopsy done on each individual patient
The data captured in MRRB is year based. New biopsies and patients with biopsy before 2005 were included. The number of biopsy episode/attempt per patient is recorded accordingly.
In the native biopsy group, from 2005 to 2007, 2071 patients had renal biopsy done. 1762 patients had renal biopsy for the first time, 263 patients had biopsy done twice, 43 patients had biopsy done thrice and 3 patients had four or more biopsy done on them. Therefore about 14.9% of patients had a repeat native biopsy done (table 1.2.3(a)).
In the allograft biopsy group; over the same period, 214 patients underwent a graft biopsy. 146 patients had biopsy done once, 46 patients had biopsy done twice, 16 patients had biopsy done thrice and 6 patients had biopsy done four times or more (Table1.2.3 (b)). As expected, there was a higher rate of repeat graft biopsies (31.8%).
Table 1.2.3(a): Distribution of native renal biopsy in patients by number of episodes /attempts
Total no of biopsy/ patient
Table 1.2.3(b): Distribution of renal allograft biopsy in patients by number of episodes /attempts
Total no of biopsy/
patient 2005 2006 2007 Total
1st Report of the
Malaysian Registry of Renal Biopsy 2007
OVERVIEW OF RENAL BIOPSY IN MALAYSIA
1.2.4: Demographic distribution of renal biopsy (Native and Graft)
1.2.4.1: Age distribution
Eighty one percent of native biopsies were done in patients older than 15 years old and in this group, 93.2% of the biopsies were done in patients less than 55 years age. Very few (6%) biopsies were done in patients older than 55 years old. (Table 1.2.4.1 (a))
In the graft biopsy group, 96.1% were done in patients older than 15 years old and of these, 85.4% were in the age group of 15 to less than 55 years. Only 10.7% of the graft biopsies were done in those above 55 years of age (Table 1.2.4.1(b)).
For adults (age > 15years old) the highest number of renal biopsy was reported in Selangor (23%), followed by WP Kuala Lumpur (16%) and Penang (13%). In the paediatric group (age < 15 years old), the highest number of renal biopsy were reported in WP Kuala Lumpur (29%), followed by Johor (24%) and Selangor (14%) (Table 1.2.4.1(c)).
Table 1.2.4.1(a): Age distribution of native renal biopsy, 2005-2007
Age group 2005 2006 2007 Total
Table 1.2.4.1(b): Age distribution of renal allograft biopsy, 2005-2007
O
Table 1.2.4.1(c): Age group distribution of reported renal biopsies by state, 2005-2007
1st Report of the
Malaysian Registry of Renal Biopsy 2007
OVERVIEW OF RENAL BIOPSY IN MALAYSIA
1.2.4.2: Gender distribution
In the native renal biopsy group, there were more females compared to males (ratio 3:2). This was probably due to the higher number of females among the patients biopsied for SLE (Table 1.2.4.2(a)). However, in the graft biopsy group, there were more males (ratio 2:1)(Table 1.2.4.2(b)). This is consistent with the trend of male predominance amongst the transplant patients as reported in the 15th Report of The Malaysian Dialysis and Transplant Registry.
Table 1.2.4.2(a): Gender distribution of native renal biopsy, 2005-2007
Gender 2005 2006 2007 Total
n n n n %
Male 231 332 265 828 40
Female 384 451 408 1,243 60
Total 615 783 673 2071 100
Table 1.2.4.2(b): Gender distribution of renal allograft biopsy, 2005-2007
Gender 2005 2006 2007 Total
Among the patients who had native kidney biopsy, majority were Malays (57%), followed by Chinese (24%)(Table 1.2.4.3(a)). In the allograft biopsy group, majority of patients were Chinese (56%) followed by Malays (29%) (Table 1.2.4.3(b))
Table 1.2.4.3(a): Racial distribution of native renal biopsy, 2005-2007
Race 2005 2006 2007 Total
Table 1.2.4.3(b): Racial distribution of renal allograft biopsy, 2005-2007
OVERVIEW OF RENAL BIOPSY IN MALAYSIA
1st Report of the Malaysian Registry of Renal Biopsy 2007
1.2.5: Renal Biopsy Report Analysis
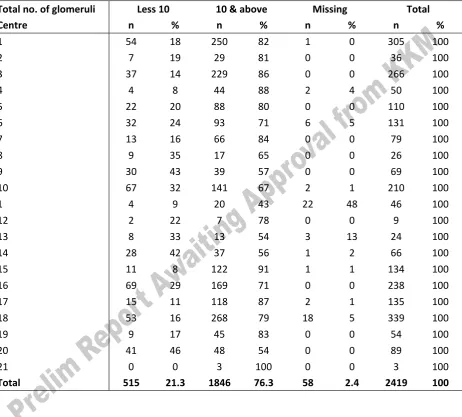
A total of 2419 renal biopsies were performed from 2005 to 2007. 515 (21.3%) of the biopsies yielded less then 10 glomeruli, which our pathologists felt was the minimum number of glomeruli required to label a biopsy as adequate. 58(2.4%) biopsies were classified as missing because the histopathology reports were not submitted to MRRB. The remaining 76.3% reported 10 or more glomeruli.
Table 1.2.5: Number of glomeruli obtained at each biopsy by centres, 2005-2007
1
1.2.6: Histopathology specimen distribution to histopathology laboratories
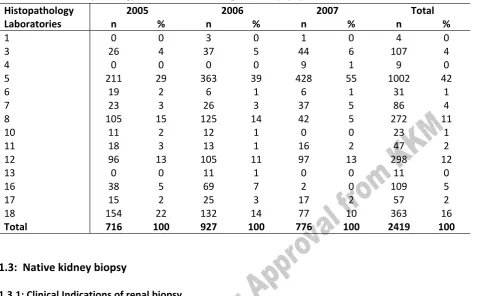
As shown in Table 1.2.6, not all biopsies performed at the centres were read by the local histo-pathologists. A number of the renal biopsy specimens were sent to other centre for processing and reporting. A total of 44.9% of HPE slides were read locally and 55.1% were sent to another laboratory (Table 1.2.6 (a))
The histopathology laboratories were coded by a number. (Table1.2.6 (b)).
Table 1.2.6(a): Distribution of biopsy specimens to histopathology laboratories by participating centres, 2005-2007
Centre
Local histopathology laboratories Outside histopathology laboratories
All 2005 2006 2007 Total 2005 2006 2007 Total
OVERVIEW OF RENAL BIOPSY IN MALAYSIA
1st Report of the Malaysian Registry of Renal Biopsy 2007
Table 1.2.6(b): Histopathology laboratories receiving renal biopsy specimens, 2005-2007
Histopathology Laboratories
2005 2006 2007 Total n % n % n % n %
1.3.1: Clinical Indications of renal biopsy
The main indications for native kidney biopsies were nephrotic syndrome (46%) followed by urinary abnormalities (26%) (Table 1.3.1 (a)). A total of 1157 (54%) patients had normal renal function at time of biopsy, 28% had impaired renal function and for the rest, renal function was either not available or unknown at time of biopsy.(Table 1.3.1 (b))
Table 1.3.1(a): Indications for native renal biopsies, 2005-2007
Indications 2005 2006 2007 Total
n % n % n % n %
Urinary abnormalities 166 26 215 27 184 27 565 26
Acute Nephritic syndrome 60 9 65 8 55 8 180 8
Patient may have more than one indication for renal biopsy
Table 1.3.1(b): Renal function at time of biopsy
Renal function 2005 2006 2007 Total
n % n % n % n %
Normal 362 56 410 51 385 57 1157 54
Impaired 149 23 236 29 216 32 601 28
Missing / unknown 135 21 165 20 80 12 380 18
1st Report of the
Malaysian Registry of Renal Biopsy 2007
OVERVIEW OF RENAL BIOPSY IN MALAYSIA
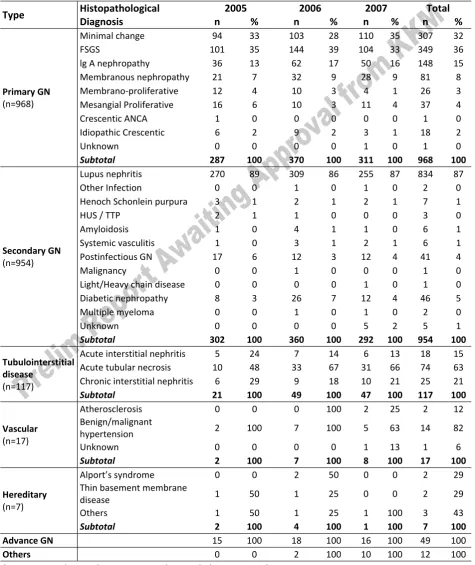
1.3.2: Histopathological Diagnosis
In the native kidney biopsy group, the three most common primary glomerulonephritis (GN) reported were focal segmental glomerulosclerosis (FSGS) (36%), minimal change disease (32%), followed by IgA nephropathy (15%). Membranous nephropathy only comprises 8% of the total primary GN subgroup. (Table 1.3.2).
Lupus nephritis was the commonest secondary GN contributing 87% of cases. (Table 1.3.2 )
The most common tubulointerstitial disease reported was acute tubular necrosis (63%). (Table1.3.2)
Table 1.3.2: Histopathology of all native renal biopsies, 2005-2007
OVERVIEW OF RENAL BIOPSY IN MALAYSIA
1st Report of the Malaysian Registry of Renal Biopsy 2007
1.3.3.1: Histopathological diagnosis in patients with nephrotic syndrome
In patients presenting with nephrotic syndrome, the commonest histopathology reported was focal segmental glomerulosclerosis (26.1%), followed by minimal change (25.7%) and lupus nephritis (23.9%) (Table 1.3.3.1)
Table 1.3.3.2: Histopathological diagnosis in patients presenting with urine abnormalities, 2005-2007
Histopathological Diagnosis n %
Primary GN
Minimal Change 28 5
FSGS 47 9
lg A nephropathy 69 13
Membranous nephropathy 15 3
Membrano-proliferative 3 1
Messangial Proliferative GN-non IgA 14 2 Idiopathic Crescentic 2 0
Sub total 178 33
Henoch Schonlein purpura 2 0
Amyloidosis 2 0
Post infectious GN 6 1
Diabetic nephropathy 5 1
Multiple myeloma 1 0
Sub total 333 61
Others 33 6
Total 544 100
* Patients may have either one or more histopathology or not have any histopathology
Histopathological Diagnosis n %
Primary GN
Minimal Change 260 25.7
FSGS 263 26.1
lg A nephropathy 40 4.0
Membranous nephropathy 59 5.9
Membrano-proliferative 16 1.6
Mesangial proliferative GN-non IgA 17 1.7
Crescentic 3 0
Systemic vasculitis 1 0.1 Post infectious GN 7 0.7 Diabetic nephropathy 20 2.0
Unknown 4 0.4
Sub total 278 28
Others 71 7
1008 100 Total
* Patients may have either one or more histopathology or not have any histopathology
Table 1.3.3.1: Histopathological diagnosis in patients presenting with nephrotic syndrome
1.3.3.2: Histopathological diagnosis in patients with urinary abnormalities
In patients presenting with urinary abnormalities, IgA was t h e c o m m o n e s t histopathology reported in the primary GN group was IgA (13%); while the most common secondary GN was lupus nephritis (59%).(Table 1.3.3.2).
1st Report of the
Malaysian Registry of Renal Biopsy 2007
OVERVIEW OF RENAL BIOPSY IN MALAYSIA
1.3.3.3: Histopathological diagnosis in patients with n e p h r i t i c - n e p h r o t i c syndrome
In patients presenting with n e p h r i t i c - n e p h r o t i c syndrome the commonest histopathology among the primary GN was IgA (9%) and among the secondary GN was lupus nephritis (49%) .(Table 1.3.3.3).
Histopathological diagnosis n %
Primary GN
Minimal Change 8 6
FSGS 9 8
lg A nephropathy 11 9
Membranous nephropathy 2 2
Membrano-proliferative 2 2
Messangial Proliferative GN-non IgA 2 2 Idiopathic Crescentic 1 1
Sub total 35 30
Secondary GN
Lupus Nephritis 58 49
Henoch Schonlein purpura 2 2 Systemic vasculitis 1 1
Post infectious GN 5 4
Diabetic nephropathy 2 2
Sub total 68 58
Others 14 12
Total 117 100
* Patients may have either one or more histopathology or not have any histopathology
Table 1.3.3.3: HPE diagnosis in patients presenting with nephritic-nephrotic syndrome, 2005-2007
1.3.3.4: Histopathological diagnosis in patients with nephritic syndrome
In patients presenting with acute nephritic syndrome, the commonest GN is lupus nephritis (Table 1.3.3.4)
Table 1.3.3.4: Histopathological diagnosis in patients presenting with nephritic syndrome, 2005-2007
Histopathogical Diagnosis n %
Primary GN
Minimal Change 7 4
FSGS 15 9
lg A nephropathy 12 6
Membranous nephropathy 2 1
Membrano-proliferative 3 2
Messangial Proliferative GN-non IgA 3 2 Idiopathic Crescentic 5 3
Sub total 47 27
OVERVIEW OF RENAL BIOPSY IN MALAYSIA
1st Report of the Malaysian Registry of Renal Biopsy 2007
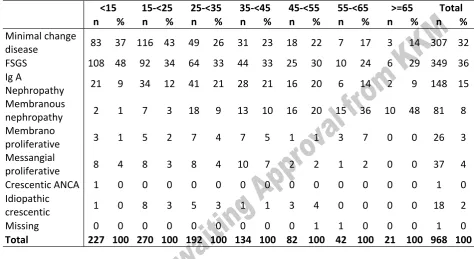
1.3.3.5 Primary GN according to various age group
FSGS was the commonest GN in the <15 year age group (48%) and also in adults between 25 - <55 years old(32%). This was followed by minimal change disease; <15 years (36%) and adults age (30.2%). However the commonest GN in the 15- 25 year age group was minimal change disease (43%). In patients above 55 years of age the commonest primary GN was membranous nephropathy (39.7%) (Table 1.3.3.5)
Table 1.3.3.5: Primary GN according to the various age group, 2005 -2007
<15 15-<25 25-<35 35-<45 45-<55 55-<65 >=65 Total n % n % n % n % n % n % n % n %
Figure 1.3.3.5: Primary GN according to the various age group, 2005 -2007
0
<15 15-<25 25-<35 35-<45 45-<55 55-<65 >=65
Age group
MCD FSGS lgA nephro Membranous Nephro Membrano prolife Messangial
1st Report of the
Malaysian Registry of Renal Biopsy 2007
PRIMARY GLOMERULONEPHRITIS
CHAPTER 2
Primary Glomerulonephritis
PRIMARY GLOMERULONEPHRITIS
1st Report of the Malaysian Registry of Renal Biopsy 2007
2.1: Introduction
This chapter covers the main primary glomerulonephritis that were reported to the MRRB from the years 2005-2007, namely minimal change disease, focal segmental glomerulosclerosis, idiopathic membranous glomerulonephritis and IgA nephropathy.
2.2: Minimal Change Disease
2.2.1: Introduction
Minimal change disease is defined by absence of histological glomerular abnormality. If electron microscopy were performed evidence of epithelial cell foot process fusion would be present.
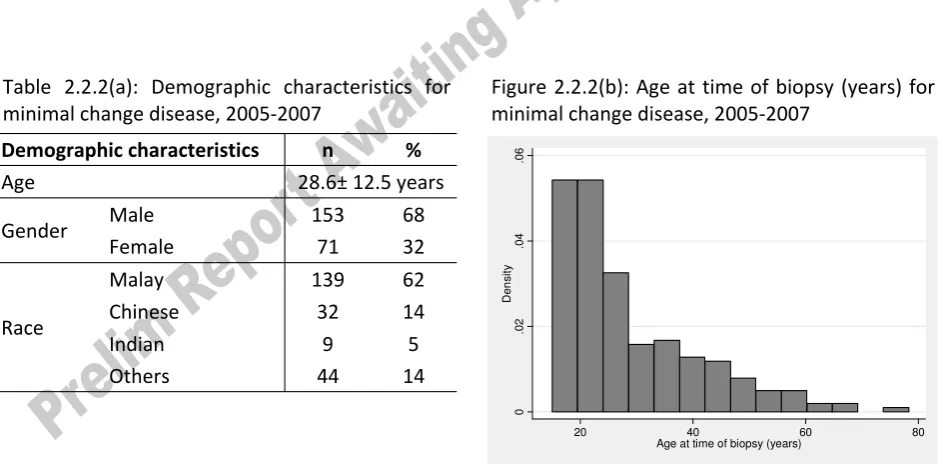
2.2.2: Patient population and characteristics
A total of 224 cases of minimal change disease were reported in 2005-2007. The mean age of the patients at the time of biopsy was 28.6 ± 12.5 (Table 2.2.2) with a clear predominance in second and third decades of life (Table & Figure 2.2.2 (b)). The frequencies of age groups 15 to <25, and 25 to <35 were 52%, 22% and 14% respectively, which is 88% when combined. The diagnosis of minimal change disease is relatively rare after 55 years of age and our reported frequency was less than 4% in this age group.
There is a higher incidence of minimal change disease in males, with a ratio of 2:1 in the three-year registry data (overall 68% as compared to 32% in the female group. The racial group distribution in Malay, Chinese and Indian was 62%, 14% and 5% respectively.
Table 2.2.2(a): Demographic characteristics for minimal change disease, 2005-2007
Demographic characteristics n %
Age 28.6± 12.5 years
Figure 2.2.2(b): Age at time of biopsy (years) for minimal change disease, 2005-2007
0
Age at time of biopsy (years)
Table 2.2.2(b): Age group at time of biopsy (years) for minimal change disease, 2005-2007 Age group
(years)
1st Report of the
Malaysian Registry of Renal Biopsy 2007
PRIMARY GLOMERULONEPHRITIS
2.2.3: Clinical presentation
Nephrotic syndrome, as expected, was the most common presentation (83%). Other presentations were asymptomatic urine abnormality (9%), nephritic syndrome (3%), nephritic-nephrotic syndrome (3%) (Table 2.2.3(a)) Only 6% of patients were hypertensive (Table 2.2.3(b)). The mean level of 24 hours urine protein was 3.1 ± 1.1g, with a range 0.2-13.4g/day.
Table 2.2.3(a): Overall clinical presentation for minimal change disease, 2005-2007
Clinical Presentation 2005 2006 2007 Total
n % n. % n. % n %
Table 2.2.3 (b): Presence of hypertension in minimal change disease, 2005-2007
Hypertension Total
2.2.3.1: Clinical presentation by age
Nephrotic syndrome consistently predominates as the clinical presentation throughout all age groups.
Table 2.2.3.1: Clinical presentation by age group for minimal change disease, 2005-2007
PRIMARY GLOMERULONEPHRITIS
1st Report of the Malaysian Registry of Renal Biopsy 2007
2.2.3.2: Clinical presentation by gender
There are basically no differences between genders in terms of clinical presentation.
Table 2.2.3.2: Clinical presentation by gender for minimal change disease, 2005-2007
2005 2006 2007 Total Male Female Male Female Male Female Male Female n. % n % n % n % n % n. % n % n %
2.2.4: Renal function at presentation
The majority (78%) of subjects had eGFR>60: 41% with eGFR>90 ml/min/1.73m2 and 37% with eGFR 60-89 ml/min/1.73m2. About a fifth of the subjects had eGFR < 60 ml/min/1.73m2 but the majority of these patients (17%) were in the region of estimated eGFR 30-59 ml/min/1.73m2 (Tables 2.2.4).However, we need to bear in mind the proportion with renal impairment is higher than expected for MCD, as one of the main indications for biopsy would have been renal impairment. In general, the older the patient the higher risk of renal impairment at presentation (Figure 2.2.4).
Table 2.2.4: Renal function at presentation by age group for minimal change disease, 2005-2007
eGFR
Figure 2.2.4: Impaired renal function by age group for minimal change disease, 2005-2007
Pe
1st Report of the
Malaysian Registry of Renal Biopsy 2007
PRIMARY GLOMERULONEPHRITIS
2.3: Focal Segmental Glomerulosclerosis
2.3.1: Introduction
Focal segmental glomerulosclerosis is defined on histological criteria by segmental capillary obliteration with increased mesangial matrix deposition, intracapillary hyaline deposits and focal adhesions of the capillary tuft to Bowman’s capsule.
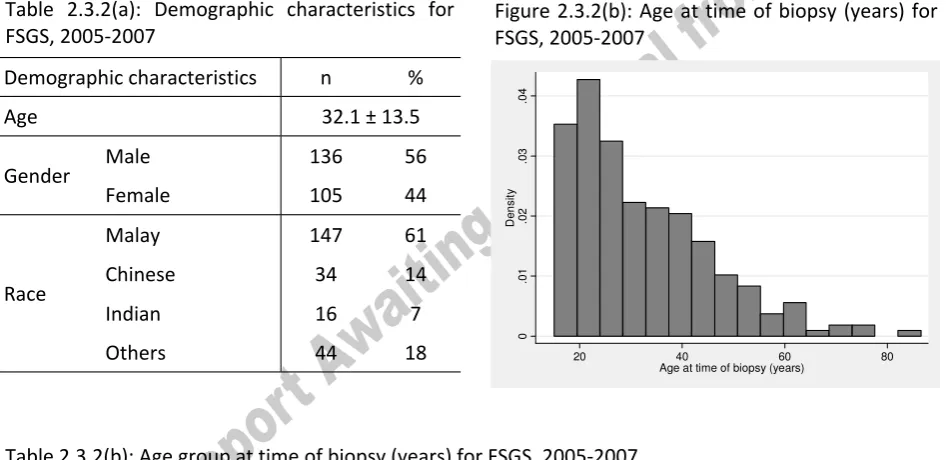
2.3.2: Patient population and characteristics
A total of 241 cases of FSGS were reported. The mean age at the time of biopsy was 32.1 ± 13.5. The first three decades of life were the predominant age groups in this type of renal disease. (Table 2.3.2 (b)). After the age of 55, the frequency rate was only 6% compared to other age groups (Table 2.3.2(b))
FSGS was slightly more common in males (56%) compared to females (44%). The distribution according to ethnicity was 61% in Malay, 14% in Chinese, 7% in Indian and 18% in others.
Table 2.3.2(a): Demographic characteristics for FSGS, 2005-2007
Demographic characteristics n %
Age 32.1 ± 13.5
Figure 2.3.2(b): Age at time of biopsy (years) for FSGS, 2005-2007
Age at time of biopsy (years)
Table 2.3.2(b): Age group at time of biopsy (years) for FSGS, 2005-2007
Age group (years) 2005 2006 2007 Total
PRIMARY GLOMERULONEPHRITIS
1st Report of the Malaysian Registry of Renal Biopsy 2007
2.3.3: Clinical Presentation
Nephrotic syndrome was the most common reported clinical presentation (69%). Other reported presentations were asymptomatic urine abnormality (18%), nephritic syndrome (5%), nephritic-nephrotic syndrome (3%) (Table & Figure 2.3.3(a)).Hypertension was present in 8% (Table 2.3.3 (b)) with a higher likelihood in older age groups .The mean level of 24 hours urine protein was 3.9 ± 1.0 with a range of 2.8 to 8.4g/day.
Table 2.3.3 (a): Overall clinical presentation for FSGS, 2005-2007
Clinical Presentation 2005 2006 2007 Total
n % n % n % n %
Figure 2.3.3 (a): Overall clinical presentation for FSGS, 2005-2007
Pe
A.urine abnormality Nephritic Nephrotic Nephritic-Nephrotic Missing
Table 2.3.3 (b): Presence of hypertension in FSGS, 2005-2007
1st Report of the
Malaysian Registry of Renal Biopsy 2007
PRIMARY GLOMERULONEPHRITIS
2.3.3.1: Clinical presentation by age
Nephrotic syndrome remains the commonest presentation across all age groups, accounting for 55-90% of presentations.
Table 2.3.3.1: Clinical presentation by age group for FSGS, 2005-2007
Age group (years)
15- <25 25-<35 35-<45 45-<55 55-<65 > 65 Total n % n % n % n % n % n % n %
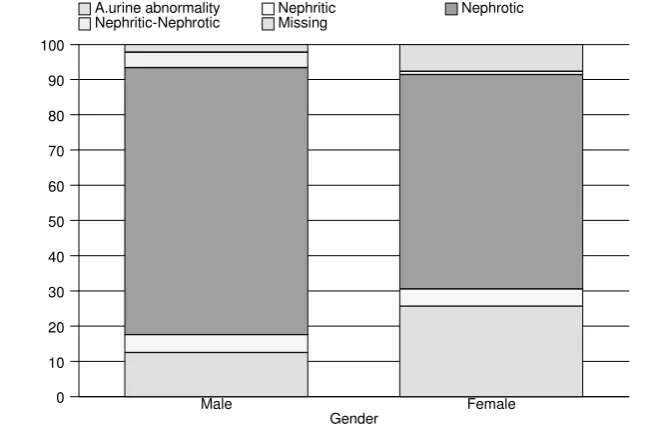
2.3.3.2: Clinical presentation by gender
From the 3 years of collected data, nephrotic syndrome appears more common in males while there are more females presenting as asymptomatic urine abnormality. The reason for this is unclear.
Table 2.3.3.2: Clinical presentation by gender for FSGS, 2005-2007
Clinical Presentation
2005 2006 2007 Total Male Female Male Female Male Female Male Female n % n % n % n % n % n % n % n %
Figure 2.3.3.2: Clinical presentation by gender for focal segmental glomerulosclerosis, 2005-2007
Pe
PRIMARY GLOMERULONEPHRITIS
1st Report of the Malaysian Registry of Renal Biopsy 2007
2.3.4: Renal function at presentation
Majority of cases (57%) had eGFR > 60 ml.min.1.73m2 at presentation (table 2.3.4 (a)). There were 28% of cases in the eGFR range of 30-59 ml/min/1.73m2; 12% were 15-29ml/min/1.73m2 and 3% were <15ml/min/1.73m2 (Table & Figure 2.3.4.1).
Table 2.3.4(a): Impaired renal function in FSGS by year, 2005-2007
Renal function 2005 2006 2007 Total
n % n % n % n %
eGFR ≥ 60 27 46 64 61 47 61 138 57
eGFR < 60 32 54 41 39 30 39 103 43
Total 59 100 105 100 77 100 241 100
2.3.4.1 Renal function at presentation by age
In general, there was a higher risk of renal impairment with increasing age (Table 2.3.4.1 & Figure 2.3.4.1 (a&b)).
Table 2.3.4.1: Renal function at presentation by age group for FSGS, 2005-2007
eGFR
Figure 2.3.4.1(a): Renal function at presentation by age group for FSGS, 2005-2007
P
15-<25 25-<35 35-<45 45-<55 55-<65 >=65
Figure 2.3.4.1(b): Impaired renal function in FSGS by age group, 2005-2007
Pe
1st Report of the
Malaysian Registry of Renal Biopsy 2007
PRIMARY GLOMERULONEPHRITIS
2.3.4.2 Renal function at presentation by gender
There were no significant gender differences with respect to renal function at presentation (Table & Figure 2.3.4.2).
Table 2.3.4.2: Renal function at presentation according to gender for FSGS, 2005-2007
eGFR
(ml/min/1.73m2)
2005 2006 2007 Total Male Female Male Female Male Female Male Female
n % n. % No. n n % n % n % n. % n %
Figure 2.3.4.2: Renal function at presentation according to gender for FSGS, 2005-2007
PRIMARY GLOMERULONEPHRITIS
1st Report of the Malaysian Registry of Renal Biopsy 2007
2.4: Idiopathic Membranous Nephropathy
2.4.1 Introduction
Membranous nephropathy is characterised by subepithelial immune deposits with spikes and thickening of the basement membrane. In Malaysia, this form of glomerulonephritis comprised only 8% of the total primary glomerulonephritis diagnosed, which is an unusually small number.
2.4.2: Patient population and characteristics
Over the three year period from 2005-2007, 79 cases of Idiopathic membranous nephropathy were reported. The mean age at biopsy was 46 + 15.5 years, with a range between 19 and 80.8 years. Similar to that described in literature(1,2), there is a bi-modal peak in incidence, the first peak seen at 25-<35 years and the second in the 45-<65 years age groups ( Figure 2.4.2).
Overall, there was slightly more male than female.(Table 2.4.2). The overall racial distribution was 39% in Malays, 43% in Chinese, 4% in Indians and 10% in others. Data were missing in 4% of cases.
Table 2.4.2: Demographic characteristics for idiopathic membranous nephropathy, 2005-2007 Demographic characteristics N=79 (%)
Age 46 ± 15.5
Figure 2.4.2: Age at time of biopsy (years) for idiopathic membranous nephropathy, 2005-2007
0
1st Report of the
Malaysian Registry of Renal Biopsy 2007
PRIMARY GLOMERULONEPHRITIS
2.4.3: Clinical presentation
A little over half of the patients (57%) presented with overt nephrotic syndrome. Asymptomatic urinary abnormalities, nephritic syndrome and nephritic-nephrotic syndrome were found in 19%, 3% and 3% respectively (Table and Figure 2.4.3 (a)). Hypertension was present in 13% (Table 2.4.3(b)). The mean level of proteinuria was 4.8 ± 2.7g/d with a range from 1.7-19.8 g/d.
Table 2.4.3(a): Overall clinical presentation for idiopathic membranous nephropathy, 2005-2007
Clinical Presentations 2005 2006 2007 Total
n % n % n % n %
Figure 2.4.3(a): Overall clinical presentation for idiopathic membranous nephropathy, 2005-2007
Pe
A.urine abnormality Nephritic Nephrotic Nephritic-Nephrotic Missing
Table 2.4.3 (b): Presence of hypertension in idiopathic membranous nephropathy, 2005-2007
Hypertension Total
n %
Present 10 13
Absent 69 87
PRIMARY GLOMERULONEPHRITIS
1st Report of the Malaysian Registry of Renal Biopsy 2007
2.4.3.1: Clinical Presentation by age
Nephrotic syndrome appeared to be the commonest clinical presentation in the younger age group. In the older patients, asymptomatic urine abnormality occurred at a higher frequency. (Table 2.4.3.1)
Table 2.4.3.1: Clinical presentation by age group for idiopathic membranous nephropathy, 2005-2007
Clinical Presentation 15- <25 25-<35 35-<45 45-<55 55-<65 >65 Total n % n % n % n % n % n n n %
2.4.3.2: Clinical presentation by gender
Nephrotic syndrome was the commonest presentation in both genders. (Table& Figure 2.4.3.2)
Table 2.4.3.2: Clinical presentation by gender for idiopathic membranous nephropathy, 2005-2007
Clinical Presentations Male Female
n % n %
Asymptomatic urine abnormality 8 20 7 19
Nephritic syndrome 1 2 1 3
Nephrotic syndrome 30 71 27 72
Nephritic-Nephrotic syndrome 1 2 1 3
Missing 2 5 1 3
Total 42 100 37 100
Figure 2.4.3.2: Clinical presentation by gender for idiopathic membranous nephropathy, 2005-2007
Pe
A.urine abnormality Nephritic Nephrotic Nephritic-Nephrotic Missing
1st Report of the
Malaysian Registry of Renal Biopsy 2007
PRIMARY GLOMERULONEPHRITIS
2.4.4: Renal function at presentation
Majority of cases (62%) had eGFR > 60 ml.min.1.73m2 at presentation. There were 25% of cases in the eGFR range of 30-59 ml/min/1.73m2; 10% were 15-29ml/min/1.73m2 and 3% were <15ml/min/1.73m2 (Table & Figure 2.4.4(a)).
There is an increased incidence of renal impairment with increasing age (Table & Figure 2.4.4(a)) and in the male gender .Up to 45% of males vs. 30% females had a eGFR < 60 ml.min.1.73m2 at presentation. (Table 2.4.4(b)).
Table 2.4.4 (a): Renal function at presentation by age group for idiopathic membranous nephropathy, 2005-2007
Figure 2.4.4 (a): Renal function at presentation by age group for idiopathic membranous nephropathy, 2005-2007
15-<25 25-<35 35-<45 45-<55 55-<65 >=65
PRIMARY GLOMERULONEPHRITIS
1st Report of the Malaysian Registry of Renal Biopsy 2007
2.5: IgA Nephropathy (IgAN)
2.5.1 Introduction
IgAN is defined by the predominant deposition of IgA in the glomerular mesangium although light microscopic appearances and clinical features can vary considerably due to the various patterns of histopathologic injury found in this type of glomerulonephritis.
2.5.2 Patient population and characteristics
One hundred and twenty seven cases of IgA nephropathy were reported to the registry over the 3 year period of data collection. The mean age at biopsy was 33.7 + 12.4 years but there was a wide age range from 15 to 85.3 years. The majority of cases biopsied clustered around the 15 to 45-year age groups, peaking at the 25-<35 age group (Table & Figure 2.5.2(b)). Unlike the male preponderance of IgAN reported in literature, our data suggests an opposite trend. This may be due to the limited time period of data collection. The overall ethnic distribution was 48% in Malays, 27% in Chinese, 9% in Indians and 16% in others. (Table 2.5.2)
Table 2.5.2 (a): Demographic characteristics of patients with IgA nephropathy, 2005-2007 Demographic characteristics N=127 (%)
Age 33± 12.4
Figure 2.5.2 (b): Age at time of biopsy (years) for IgA nephropathy, 2005-2007
0
Age at time of biopsy (years)
Table 2.5.2 (b): Age group at time of biopsy (years) for IgA nephropathy, 2005-2007
Age group (years)
2005 2006 2007 Total
1st Report of the
Malaysian Registry of Renal Biopsy 2007
PRIMARY GLOMERULONEPHRITIS
2.5.3: Clinical presentation
There is a wide range of clinical presentations in IgAN. Overall, 50% presented with some form of asymptomatic urinary abnormality. Up to 25% of those who were biopsied had nephrotic syndrome (Table & Figure 2.5.3 (a)). This figure is higher than the 5% quoted in literature(1) and may reflect relatively conservative local practices with regards to investigation of asymptomatic urinary abnormalities. Up to 25% of patients were hypertensive (Table 2.5.3 (b)). The mean level of proteinuria at biopsy was 3.8 + 0.9 g/d with a range from 2.8- 8.4 g/d.
Table 2.5.3 (a): Overall clinical presentation for IgA nephropathy, 2005-2007
Clinical presentation 2005 2006 2007 Total
n % n % n % n %
Figure 2.5.3 (a): Overall clinical presentation for IgA nephropathy, 2005-2007
Pe
A.urine abnormality Nephritic Nephrotic Nephritic-Nephrotic Missing
Table 2.5.3 (b): Presence of hypertension in IgA nephropathy, 2005-2007
Hypertension Total
n %
Present 31 24
Absent 96 76