4
UNIVERSITY OF
KWAZULU-NATAL
The Association of various HLA-A, -B and -DR loci with Membranous Glomerulonephritis , IgA Nephropathy and Focal Segmental Glomerulosclerosis in KwaZulu-Natal Renal
Patients
By Veronica Allen
Submitted in partial fulfillment of the requirements for the degree Master of Medical Science in the Department of Medicine, University of KwaZulu-Natal, Durban
December 2007
Gloria in excasis Deo
To Emmanuel and Elizabeth
Eternal- rest grant unto them 0 Lord And let perpetual- fight shine upon them
May their souls and the souls of all the faithful. departed Through the Mercy of God
Rest in Peace
In Nomine Patris, et Filii, et Spiritus Sancti. Amen.
Declaration
This study presents original work by the author and has not in any form been submitted to this or any other university. The research described here was carried out in the Department of Medicine, Faculty of Health Sciences, Nelson R Mandela School of Medicine, University of KwaZulu-Natal, Durban, under the Supervision of Professor AGH Assounga. Where use is made of the work of others, it has been appropriately documented in the text.
2 Date Veronica Allen
Acknowledgments
I first thank God for blessing, protecting and seeing me through everything especially these past three years.
I thank my Supervisor Professor AGH Assounga for his guidance, dedication and interest in my project and for his passion for immunology. Thank you for making me fall in love with immunology.
I thank my Parents for giving me life and bringing me up with love and good morals, for supporting in every way my entire life
I thank my Grandmother, my sister (Jerri-Lisa Jade Maria) and my Brother (Ashton Jude Tyler) for always being proud of me and supporting me.
I thank my fiancé Kurt for always encouraging me and believing in me.
I thank my best friend Saleha for being the best friend anyone could ever have, for being true to me and for everything she has ever done for me. I'm going to miss you more than you'll ever know my Solly. I will never forget you...EVER.
I thank Devi Sebastian for her assistance and for being a good friend.
I thank the NRF for granting me the Prestigious and Equity Scholarship for two years.
I thank the Department of Health for allowing me to conduct my study in KwaZulu- Natal.
I thank the management of Inkosi Albert Luthuli Central Hospital (IALCH) for allowing me to conduct my study at the hospital.
I thank the staff of Inkosi Albert Luthuli Central Hospital for assisting me with my sample collection and translating.
I thank Dr Madala for her assistance with my project.
I thank the South African National Blood Services for allowing me to use their tissue typing laboratory to conduct my IILA typing. I would especially like to thank Nomaphelo Sofute, Heidi Poplett, Debbie Anley, Jayce Govender and Maggie Naicker for their kind assistance.
Presentations Arising From This Thesis:
Oral
Allen V, 2007. HLA-B40 is significantly associated with hypertension in Indian KwaZulu-Natal Renal Patients, The South African Transplantation Society Congress, Sibaya Conference Centre, Durban, South Africa, 7th-
Poster/Oral
Allen V and Assounga AGH, 2007. HLA-B40 is significantly associated with hypertension in Indian KwaZulu-Natal Renal Patients, The College of Health Sciences- Astrazeneca Research Symposium, University of KwaZulu-Natal Westville Campus, Durban, South Africa, 11th-12th September 2007.
• -
u
September 2007.th
ABBREVIATIONS
A -
Angstrom UnitATP — Adenosine Triphosphate
(32-m — 132-microglobulin
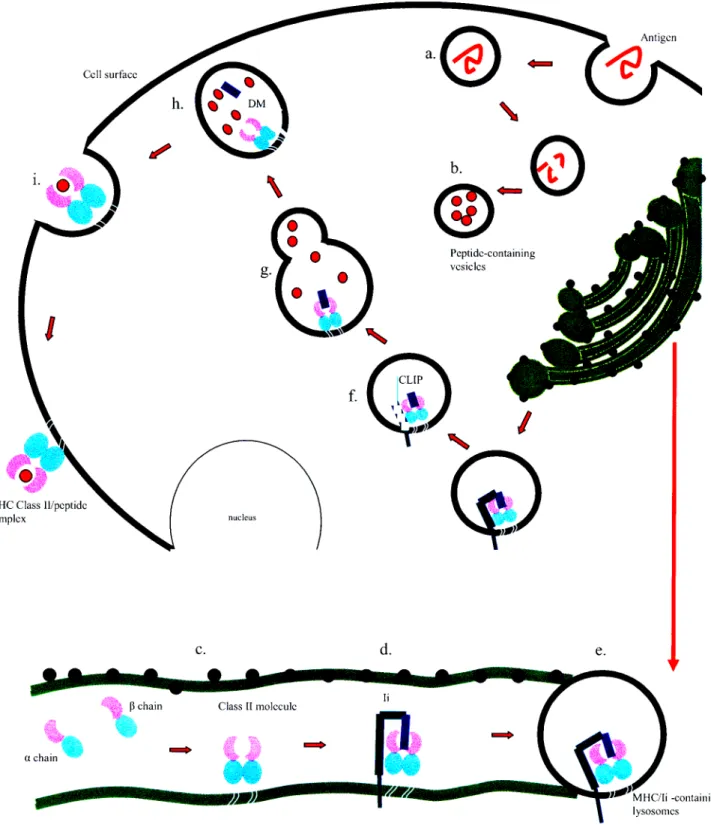
CLIP — Class II-associated invariant chain peptide
cm — Centimeter
CMV — Cytomegalovirus
COX-2 — Cyclooxygenase-2
CRF — Chronic Renal Failure
DNA — Deoxyribonucleic Acid
e.g. — For Example
EBV — Epstein-Barr Virus
EDTA — Ethylenediamine Tetra-Acetic Acid
ER — Endoplasmic Reticulum
ESRD — End Stage Renal Disease
FSGS — Focal Segmental Glomerulosclerosis
g — Gram
GBM — Glomerular Basement Membrane
GD — Glomerular Disease
GFR — Glomerular Filtration Rate
GN — Glomerulonephritis
H2O — Water
HBVMN — Hepatitis B Virus-Associated Membranous Nephropathy
HIV — Human Immunodeficiency Virus
HIVAN — HIV Associated Nephropathy
HLA — Human Leukocyte Antigen
hp — Hewlett-Packard
HSP — Henoch-SchOnlein purpura
HSV — Herpes Simplex Virus
Hy Regions — Hypervariable Regions
I ALCH — Inkosi Albert Luthuli Central Hospital
IgA — Immunoglobul in A
IgAD — IgA Deficiency
IgAN — IgA Nephropathy
IgG — Immunoglobulin G
IgM — Immunoglobulin M
Ii— Invariant Chain
KZN — KwaZulu-Natal
MCGN — Minimal Change Glomerulonephritis
MGN/MN — Membranous Glomerulonephritis/ Membranous Nephropathy
MHC — Major Histocompatibility Complex
mm — Millimeter
mmHg — Millimeter Mercury
NK Cells — Natural Killer Cells
nm — Nanometer
NS — Nephrotic Syndrome
P — Probability of error
P. — Corrected P value
PAS — Periodic Acid-Schiff
PCR — Polyrnerase Chain Reaction
PE — Plasma Exchange
pIgA I — Polymeric IgAl
PMP — Pattern Matching Program
PP — Plasmapheresis
RER Rough Endoplasmic Reticulum
SA-HRP — Streptavidin-Horseradish Peroxidase
SANBS — South African National Blood Services
SLE — Systemic Lupus Erythematous
SSO — Sequence Specific Oligonucleotide
STR — Single Tetranucleotide Repeat
TAP — Transporter associated with Antigen Processing
TAPBP — Tapasin
TB — Tuberculosis
Tc — Cytoxic T Cells (COO
TH - T Helper Cells (CD4+)
pm — Micrometer
viz. — Namely
VZV — Varice lla-Zorster Virus
WHO — World Health Organization
List of Tables
1.1.1 Classical HLA Class I Alleles and their Serological Designations. 15
1.1.2 Classical HLA Class II Alleles and their Serological Designations. 16
1.1.3 A Simplification of HLA Nomenclature. 18
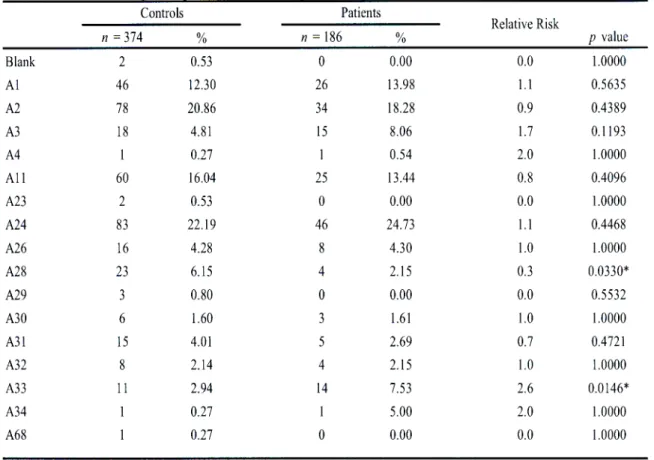
3.1.1 HLA-A antigen frequencies in Indian hypertensive patients and controls in
KwaZulu-Natal. 88
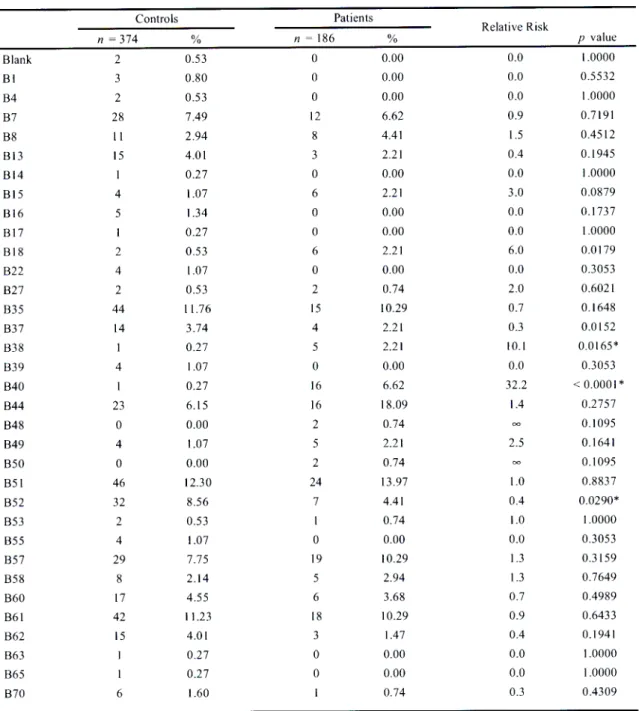
3.1.2 HLA-B antigen frequencies in Indian hypertensive patients and controls in
KwaZulu-Natal. 89
3.1.3 HLA-DR antigen frequencies in Indian hypertensive patients and controls
in KwaZulu-Natal. 90
3.1.4 HLA-A antigen frequencies in African hypertensive patients and controls in
KwaZulu-Natal. 92
3.1.5 HLA-B antigen frequencies in African hypertensive patients and controls ih
KwaZulu-Natal. 93
3.1.6 HLA-DR antigen frequencies in African hypertensive patients and controls
in KwaZulu-Natal. 94
3.1.7 HLA-A antigen frequencies in White hypertensive patients and controls in
KwaZulu-Natal. 96
3.1.8 HLA-B antigen frequencies in White hypertensive patients and controls in
KwaZulu-Natal. 97
3.1.9 HLA-DR antigen frequencies in White hypertensive patients and controls
in KwaZulu-Natal. 98
3.2.1.1 HLA-A antigen frequencies in Indian glomerulonephritides patients and
controls in KwaZulu-Natal. 100
3.2.1.2 HLA-DR antigen frequencies in Indian glomerulonephritides patients and
controls in KwaZulu- Natal. 101
3.2.2.1 HLA-A antigen frequencies in African glomerulonephritides patients and
controls in KwaZulu- Natal. 103
3.2.2.2 HLA-DR antigen frequencies in African glomerulonephritides patients and
controls in KwaZulu- Natal. 104
3.2.3.1 HLA-A antigen frequencies in White glomerulonephritides patients and
controls in KwaZulu- Natal. 106
3.2.3.2 HLA-B antigen frequencies in White glomerulonephritides patients and controls
in KwaZulu- Natal. 107
3.2.3.3 HLA-DR antigen frequencies in White glomerulonephritides patients and
controls in KwaZulu- Natal. 108
3.2.4.1 HLA-A antigen frequencies of combined Race group glomerulonephritides
patients and controls in KwaZulu-Natal. 110
3.2.4.2 HLA-DR antigen frequencies of combined Race group glomerulonephritides
patients and controls in KwaZulu-Natal. 111
Lists of Figures
1.1.1 Gene structure of the Class I, Class II and Class II regions of the HLA
complex present on the short arm of chromosome 6. 21
1.1.2 Diagrammatic representation of MHC Class I (a.) and Class II (b.)
molecules. 25
1.1.3 Diagrammatic representation of the crystal structures of HLA Class 1 (a.)
and HLA Class II (b.) molecules. 30
1.1.4 MIIC Class I presentation by the Cytosolic Pathway. 36
1.1.5 Diagrammatic representation of the MHC Class II pathway. 39
1.2.1 Diagrammatic representation of a human kidney. 50
1.2.2 Simplified diagrammatic representation of the nephron (a) and detailed
structure of a section of the glomerular tuft (b). 54
2.1 HLA-A positive control strip. 83
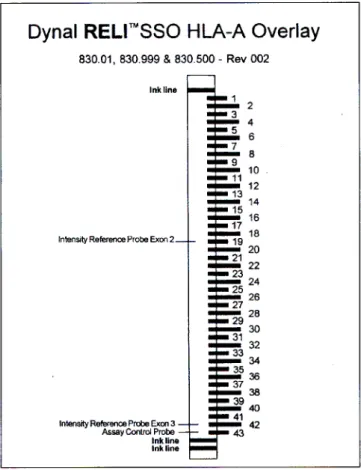
2.2 Transparent HLA-A locus template. 84
3.3.1 The prevalence of IgAN in three KZN populations viz. African, Indian and White
114 3.3.2 HLA-A combined (renal patients and normal controls) antigen
frequencies of Indians, Whites and Africans in KwaZulu-Natal. 115
3.3.3 HLA-B combined (renal patients and normal controls) antigen
frequencies of Indians, Whites and Africans in KwaZulu-Natal. 116
3.3.4 HLA-DR combined (renal patients and normal controls) antigen
frequencies of Indians, Whites and Africans in KwaZulu-Natal. 117
ABSTRACT
This KwaZulu-Natal (KZN) based study investigates hypertension, glomerulonephritides and the rarity of IgA Nephropathy (IgAN) in Africans in association with the Human Leukocyte Antigen (HLA). A retrospective hypertensive study found a positive association with HLA-B40 (Pc<0.05) and HLA-B15 (Pc<0.02) in Indians and Africans respectively. No association was found in Whites. A prospective study showed glomerulonephritides to be positively associated with HLA-A33 in Indians (Pc 0.049).
No associations were found with glomerulonephritides in Africans and Whites.
Combined Race groups show no HLA associations. HLA-A30; HLA-A34; HLA-A29;
HLA-B42; HLA-B58; HLA-B70 and HLA-DR11 were extremely significantly higher in Africans compared to Indians and Whites (all P<0.0001). In conclusion, HLA-B40 and I 1LA-B15 are possible disease susceptibility markers in Indian and African hypertensives; HLA-A33 is a possible disease susceptibility marker for glomerulonephritides in Indians and alleles in linkage might be responsible for the rarity of IgAN in Africans but further studies need to be employed.
Keywords: hypertension, glomerulonephritides, HLA
TABLE OF CONTENTS
ABSTRACT xvii
INTRODUCTION 1
I. LITERATURE REVIEW
1.1 General Introduction of the Major Histocompatibility Complex 7 1.1.1 General features of the Major Histocompatibility Complex 9
1.1.2 Nomenclature 10
1.1.2.1 Nomenclature in terms of species 11 1.1.2.2 Nomenclature in terms of the gene map 11
1.1.3 Inheritance of MHC In Humans 19
1.1.4 Structure of The Human Major Histocompatibility Complex
1.1.4.1 Gene Structure of Human MHC (HLA) 19 1.1.4.2 Physical Structure of HLA Class I and Class II Molecules 24 1.1.4.2.1 Structure of Class I Molecules 24 1.1.4.2.2 Structure of Class II Molecules 27 1.1.5 Crystal Structure of HLA Class I and Class 11 Molecules 28
1.1.5.1 Structure of Class I Molecules 29
1.1.5.2 Crystal Structure of Class II Molecules 31 1.1.6 Tissue Distribution and Expression of HLA Class l and Class II
Molecules 31
1.1.7 Function of The HLA Class I and Class II Molecules 33 1.1.7.1 Function of The Class I Molecule 33
1.1.7.1.1 Antigen Processing and Presentation by The Cytosolic
Pathway of Class I Molecules 34
1.1.7.2 Function of The Class II Molecules 37 1.1.7.2.1. Antigen Processing and Presentation by The Endocytic
Pathway of Class II Molecules 38
1.1.8 Linkage Equilibrium and Disequilibrium 41
1.1.9 MHC Polymorphism 43
1.1.10 HLA and Disease Associations 45
1.2 The Kidney 48
1.2.1 Functional Anatomy of The Kidney 49
1.2.2 Overview of Kidney Physiology 55
1.2.3 Glomenilar Disease 57
1.2.4 IgA Nephropathy 59
1.2.4.1 Aetiology 60
1.2.4.2 Morphology 60
1.2.4.3 Clinical Features 60
1.2.4.4 Diagnosis 62
1.2.4.5 Pathology 63
1.2.4.6 Pathogenesis 63
1.2.4.7 Treatment 64
1.2.4.8 Disease Association 65
1.2.5 Focal Segmental Glomerulosclerosis (FSGS) 66
1.2.5 1 Aetiology 67
1.2.5 2 Morphology 67
1.2.5.3 Clinical Features 67
1.2.5.4 Diagnosis 69
1.2.5.5 Pathology 70
1.2.5.6 Pathogenesis 70
1.2.5.7 Treatment 72
1.2.5.8 Disease Association 74
1.2.6 Membranous Glomerulonephritis 74
1.2.6.1 Aetiology 74
1.2.6.2 Morphology of MGN 75
1.2.6.3 Clinical Features 75
1.2.6.4 Pathogenesis 76
1.2.6.5 Treatment 76
1.2.6.6 Disease Association 76
2. PATIENTS AND METHODS
2.1 Ethical Approval 78
2.2 Patient and Control Recruitment 78
2.3 Sample Size 79
2.3.1 Patient Sample Size 79
2.3.1.1 Part A Sample Size 80
2.3.1.2 Part B Sample Size 80
2.3.1.3 Part C Sample Size 81
2.3.2 Control Sample Size 81
2.4 Sample Collection 81
2.5 Part A Method 82
2.6 Part B Method 82
2.6.1 DNA Extraction 82
2.6.2 DNA Quantification 82
2.6.3 DNA Amplification 82
2.6.4 Probe Hybridization 84
2.6.5 Allele Detection 85
2.7 Part C Method 85
2.8 Statistical Analysis 86
3. RESULTS
3.1 Part A: Hypertension and Renal Disease in KwaZulu-Natal 87 3.2 Part B: HLA allele frequencies in Renal Disease in KwaZulu-Natal 99
3.3 Part C: The rarity of IgAN in Africans 112
4. DISCUSSION 118
5. CONCLUSION 129
6. REFERENCES 130
7. APPENDIX 156
INTRODUCTION
Glomerular Disease (GD) (Remuzzi et. al., 2006) and hypertension (Agnani et. al., 2005) are the main contributors of end-stage renal disease (ESRD), requiring renal replacement therapy which is very expensive and, unlike the United Kingdom (Ellis et. al., 1998), not always guaranteed in South Africa. This is not feasible in a developing country like South Africa where majority of the diseased renal population are poor but priority goes to HIV/AIDS which is a social disease and tuberculosis.
Patients with delayed presentation of renal failure increase the numbers for renal replacement therapy as pharmacological options are futile at this stage where ESRD is inevitable (Ellis et. al., 1998). Kidney dysfunction is coupled with cardiovascular disease (Ritz, 2006) hence disease of the kidney will ultimately lead to disease of the heart.
Certain genes of the immune system are said to be disease susceptibility genes whereas certain genes are said to be protective (Mitchison et. al., 1996). This is a result of either the disease susceptibility alleles being present in a higher proportion of patients when compared to controls (in the case of disease susceptibility) or vice versa (in terms of protection). The human major histocompatibility complex (HLA) is used to determine possible disease susceptibility or protective alleles. Carrying either a disease susceptibility or protective allele will either predispose or initiate immunity to that particular disease in an individual (Lipsitch et. al., 2003).
Trowsdale (1995) described the major histocompatibility complex (MHC) as being the
`Centre of the Immune Universe' stimulating almost every immunological activity involving cell-to-cell interaction (Kimball, 1986). Genes of the human MHC are present on chromosome 6 and code for molecules that present processed antigens to cytotoxic T cells.
HLA differs between race and geographic location (Kukko et. al., 2004). This is due to polymorphic residues present in the peptide binding region of the HLA molecule.
Polymorphism is postulated to be a result of gene conversion and genetic drift (Parham and Ohta, 1996), infectious disease outcome (Jeffery and Bangham, 2000) as well as environmental factors (Kukko et. al., 2004). The MHC is extremely sensitive that even a single amino acid substitution due to mutation can alter the antigen it presents (Mellins et. al., 1988).
The aim of this study was to investigate associations between HLA and hypertension and glomerular diseases in this diverse KZN setting. Although there is an immunological genetic basis for each population responding differently to GD, a socio-economic racial predisposition also exists (Seedat et. al., 1984).
IgAN has been found to be uncommon amongst the African race group (Jennette et. al., 1985; Seedat et. al., 1984; Seedat et. al., 1988). No reason for this occurrence has been found to date. It could be argued that the rarity of IgAN in Africans could be due to late presentation with ESRD when diagnostic renal biopsies may not be available and this
could be true in poor settings however, IgAN has also been shown to be rare in an African American population (Jennette et. al., 1985). America is a first world, resource rich country with a greater standard of health care. Therefore another goal of this study was to attempt to find possible alleles present or absent in the HLA complex of the African population that protects them against IgAN.
Associations have been found between HLA and the diseases under investigation in this study in other settings (Freedman et. al., 1994a and b; Klouda et. al.. 1979; Kobayashi et.
al., 1985; Lagueruela et. al., 1990; Ruder et. al., 1990). In KZN, studies aiming to find associations between HLA and nephrotic syndrome (NS) (Adhikari et. al., 1985) as well as hepatitis B virus-associated membranous nephropathy (HBVMN) (Bhimma et. al., 2002) have been carried out in the pediatric patient population. Significant associations were found between the Class II HLA-DQB1*0603 and HBVMN in Black African children, HLA-Bw44 in Indian and HLA-Bw21 in African children with NS.
HLA associations with HIV in KZN have suggested insight into vaccine design (Kiepiela et.al., 2004). HLA studies may therefore provide the foundation on which other studies are built upon towards the development of therapeutic measures.
With regards to HLA studies it is difficult to build upon earlier investigations as each population (in terms of ethnicity as well as geographic location) has a unique HLA profile although HLA-B 15 has been shown to be associated with hypertension in various populations (Gudbrandsson et. al., 1980; Hilme et. al., 1993; Kristensen, 1981). It
therefore becomes feasible to rather aim to prove similar associations or detect novel disease susceptibility and protective alleles in populations where these studies have not been carried out.
Another difficulty presented is the fact that the HLA type of a population is determined by genetic recombination and environmental factors implying that each generation of the same population in the same geographic area might have a different HLA profile. This indicates that making use of information derived from HLA studies carried out in the past may not at present be valid in the development of therapeutic measures as the HLA type of a population is continually changing.
About the Study
The HLA alleles under investigation in this study viz. HLA-A, -B and -DR were chosen because they are they most polymorphic Class I and Class II HLA alleles. The importance of studying the association of HLA with hypertension and renal diseases stems from the fact that these are major contributors of ESRD. Detecting an allele that is highly represented in the patient population is not sufficient to make any conclusions. It is therefore important to compare the diseased individuals with healthy controls to determine possible disease susceptibility or protective alleles which either predispose or protect an individual from a particular disease. If a an allele is present in the diseased population in amounts that greatly exceed the normal population and a significant association is found after correcting the P value, that allele becomes a possible disease susceptibility marker. This information can now be used as a basis for various other studies including those towards the development of therapeutic measures.
This is primarily an aim driven study which is divided into three parts with distinct aims.
1. The first part of the study, Part A, aims to find associations (if any) of HLA alleles with hypertension amongst the African, Indian and White populations in KZN. In addition since HLA-B 15 has been shown to be associated with various hypertensive populations, it was hypothesized that a similar association would be found in KZN.
2. The second part of the study, Part B, aims to find associations between HLA alleles and glomerulonephritides in KZN. These diseases include IgA
nephropathy (IgAN), membranous glomerulonephritis (MGN) and focal segmental glomerulosclerosis (FSGS). These diseases were chosen for the following reasons. IgA nephropathy is the most prevalent primary glomerulonephritides worldwide, FSGS is very common especially in African males and MGN is known to be one of the most common causes of NS
3. The third part of the study, Part C, aims to investigate the reason for the rarity IgAN in the African population by observing the genetic profile of the African Race as a whole (combining diseased and normal populations) and comparing it to the White and Indian populations.
CHAPTER 1
LITERATURE REVIEW
In order for the adaptive immune system to destroy a foreign antigen it first needs to detect its presence (Turka, 1997). The body does not destroy its own antigens or that of an identical twin (Jawetz et al., 1982) because they are recognized as "self' (except for autoimmune disorders such as systemic lupus erythematosis) but when a foreign cell enters the body by organ transplant (Wolfe, 1995) for example, its proteins are degraded either cytosolically or endocytically and presented to the T Cell Receptors of T lymphocytes bound to cell surface glycoproteins called the Major Histocompatibility Complex proteins (Brodsky, 2001).
1.1 General Introduction of the Major Histocompatibility Complex
All nucleated (Barrett, 1988) vertebrate (Austyn and Wood, 1993) somatic (Hughes and Yeager, 1998) cells have a set of molecules present on its surface which are responsible for lymphocyte recognition (Schwartz, 1987) and antigen presentation (Brodsky, 2001;
Zacharias and Springer, 2004) termed The Major Histocompatibility Complex (MHC) molecules. These molecules are polymorphic glycoproteins (Austyn and Wood, 1993) which can be found in serum, saliva and urine (Braun, 1979) and are encoded by a closely linked set of genes (Sayegh et al., 2000) that form a "complex" on chromosomes called the MHC. The human MHC is present on the short arm of chromosome 6 (Williams, 2001), the rat MHC on chromosome 20 and the mouse MHC on chromosome 17 (Barrett, 1988; Margulies, 1999). The molecules of the MHC include the highly
polymorphic class I and class II molecules (Pattison et al., 1997; Rees, 1997) and "the not so polymorphic" class III molecules (Rees, 1997). Class I and class II molecules arc specialized membrane proteins that facilitate T cells to recognize antigen (Austyn and Wood, 1993) thus playing a vital role in graft rejection.
MHC was christened as such due to its discovery during initial transplant studies (Gorer, 1936a, b) and was acknowledged as an important ("Major") set of genes ("Complex") which predispose the regulation of the acceptance of grafts between individuals whose tissues are genetically similar ("Histcompatible") or rejected by individuals that are not ("Histoincompatible") (Austyn and Wood, 1993). In addition, minor histocompatibility antigens which arc derived from polymorphic cellular proteins (Simpson et. at., 2002) do not mount a rapid rejection response as MHC but play a role in tissue compatibility ( Austyn and Wood, 1993).
Discovery of the MHC antigens initially occurred during tumour transplant studies between different strains of inbred mice (Gorer, 1936b) and were thus characterized as transplant antigens (Hoecker, 1986). MHC antigens are the strongest and most important transplant antigens as they provide the strongest incompatibilities for any type of tissue and organ transplant in both animals and humans and are able to stimulate a primary immune response without being sensitized (Sayegh et al., 2000). Other transplant antigens include the minor histocompatibility antigens, ABO blood group antigens and monocyte/endothelial cell antigens (Sayegh et al., 2000).
Inbred strains, unlike outbred populations (e.g. humans) which are made up of a great number of MHC haplotypes (Heise, 1984), are composed of genetically identical individuals hence tissue transplantation between the same inbred strain was possible without risk of rejection (Gorer, 1936a). Thus the tissues of one inbred strain are deemed histocompatible in relation to each other but histoincompatible with another inbred strain (Austyn and Wood, 1993).
In 1958, Dausset discovered agglutinating antibodies as a result from a reaction between the sera of multi-transfused individuals as well as that of multiparous women and leukocytes from blood donors. These serological studies demonstrated that agglutination does not occur between the sera and leukocytes of the same individual or between those of individuals who produce similar antibodies. It also demonstrated that leukocyte antigens are genetically determined by Dausset's observation that the pattern of agglutination from a series of antisera was identical in monozygotic twins but not in dizygotic twins.
1.1.1 General features of the Major Histocompatibility Complex
Three different families of glycoproteins are coded for by the MHC viz. Class I, class II and class III molecules (Austyn and Wood, 1993). Co dominant expression (Buckley, 2003), polygenicity and polymorphism are prominent features of the MHC (Janeway et.
al., 2005) which work together to prevent pathogens from invading the host cell. Class and class II molecules are alloantigens which are expressed on the cell surface as
membranous glycoproteins (Austyn and Wood, 1993). Class III molecules are soluble proteins which include soluble effector molecules (Austyn and Wood, 1993) such as enzyme steroid 21-hydroxylase (Hauptmann and Bahram, 2004), heat shock proteins HSP70 (Porto et. al., 2005) and components of the complement system (Barrett, 1998).
The genes of the MHC are most common, divergent, evenly distributed (Parham and Tomoko, 1996) and are highly polymorphic (Turka, 1997). In fact they are known to be the most polymorphic cluster of genes that exist in the mammalian genome (Just, 1995;
Wooley and David, 1984).
Class I and Class II molecules are involved in antigen processing and presentation of peptides within the cell or those from extracellular space (Stevanovia, 2002) via the cytosolic and endocytic pathways respectively (Brodsky, 2001).
1.1.2 Nomenclature
MHC nomenclature is extremely complicated due to the presence of different nomenclature systems between species and not as a result of any fundamental distinctions between the structure and function of the MHC molecules (Austyn and Wood, 1993).
Due to the rapid increase of new alleles (Braun, 1979) and novel findings (Margulies, 1999) further complications are discovered bringing about a need for greater precision from historical systems (Margulies, 1999).
1.1.2.1 Nomenclature in terms of species
MHC in the mouse is designated H-2 (Panayi and David, 1984) and is maintained for historical reasons as it was the second of the four blood group antigens that Gorer discovered to have an association with tumour transplants. Except for B used to describe the chicken MHC (GOtze, 1981) and RTI, which replaces the old nomenclature AgB used to describe the rat MHC, most of the nomenclature systems were designed around that assigned to humans — HLA which represents human leukocyte antigen or more specifically human leukocyte associated antigen A (Austyn and Wood, 1993). Hence ChLA is used to describe the chimpanzee leukocyte antigen (Margulies, 1999); RLA, the rabbit leukocyte antigen (Austyn and Wood, 1993); BoLA, the cattle (bovine) leukocyte antigen (GOtze, 1981) DLA, the dog leukocyte antigen (Margulies, 1999); GPLA, the guinea pig leukocyte antigen (Austyn and Wood, 1993); SLA, the swine (pig) leukocyte antigen (Margulies, 1999) and RhLA, the rhesus monkey leukocyte antigen (van Rood et c.d., 1981).
1.1.2.2 Nomenclature in terms of the gene map
The earliest genes of the MHC that were recognized are classified as MHC genes because the cell surface molecules they encode can be detected by antibodies and transplantation responses (Margulies, 1999). At present there are hundreds of mouse and human MHC genes but MHC molecules refer distinctively to MHC-I and MHC-11 structurally and functionally related molecules (Margulies, 1999).
As of April 2007, the international ImMunoGeneTics (IMGT) Database currently contains 545 Class I HLA-A alleles, 894 Class I HLA-B alleles, 307 Class I HLA-C alleles, 3 Class II HLA-DRA alleles, 577 Class II HLA-DRB alleles, 34 Class II HLA- DQA1 alleles, 83 Class II HLA-DQB1 alleles, 23 Class II HLA-DPA1 alleles and 126 Class II DPB1 alleles.
Specific MHC genes are denoted by a letter for the locus after the prefix e.g., for the mouse MHC, H-2K where H-2 is the prefix and K is the locus (Margulies, 1999). An example of the human MHC is HLA-A where HLA is the prefix and A is the locus (Margulies, 1999).
Alleles of the mouse MHC have been designated by adding a subscript to the locus for e.g., H-2Kb and H-2Kd where Kb and Kd are two different alleles present at the same locus (Margulies, 1999). Human MHC class II genes are designated HLA-D but murine MHC class II genes are denoted as H-2IAa, H-2IAb, H-2IEa, H-2IEb where a and b respectively denote the alpha (a) and beta ((3) coding chains (Margulies, 1999).
The nomenclature system for the human MHC is developed by the HLA Nomenclature Committee of the World Health Organization (WHO) (Schwartz, 1987). The classical HLA MHC class I genes officially recognized by the WHO are HLA-A, HLA-B and HLA-C (Schwartz, 1987) and the MHC class II region is HLA-D which comprises HLA- DR, HLA-DP and HLA-DQ loci (Austyn and Wood, 1993). Non classical MHC genes
with limited immune functions and a low degree of polymorphism and expression are the MHC-Ib genes viz. HLA-E, HLA-F and HLA-G (Williams, 2001).
Provisionally accepted antigens have a "w" placed between the locus and the number e.g., HLA-Bw22 (Braun, 1979) and is a result of inaccurate serological assignments (Margulies, 1999). When it becomes officially recognized and accepted the 'w', which stands for workshop, is eliminated (Schwartz, 1987) and the allele becomes HLA-B22.
MHC Class I loci only encompass a single gene (Austyn and Wood, 1993) whereas the Class II region contains the A and B genes which may confer antigen variability (Williams, 2001) e.g., HLA-DRA and HLA-DRB1 (Austyn and Wood, 1993).
The Human MHC is known to be the predominantly investigated (Janer and Geraghty, 1998) and most polymorphic set of genes present in the human genome (Jeffery and Bangham, 2000; McCluskey and Peh, 1999) and initial serological methods used to resolve alleles proved to be inadequate in detecting the variation of the alleles that antibodies were unable to gain access to thus bringing about a need for modern molecular methods (McCluskey and Peh, 1999). For example alleles identified by serology is denoted as HLA-A2 and those identified by DNA typing, HLA-A *0201.
In order to fully understand the way the human designation works, a conversion table (Table 1.1.1 and Table 1.1.2) which aligns the alleles that have been resolved
serologically with those that have been resolved by modern DNA typing methods needs to be consulted (Margulies, 1999).
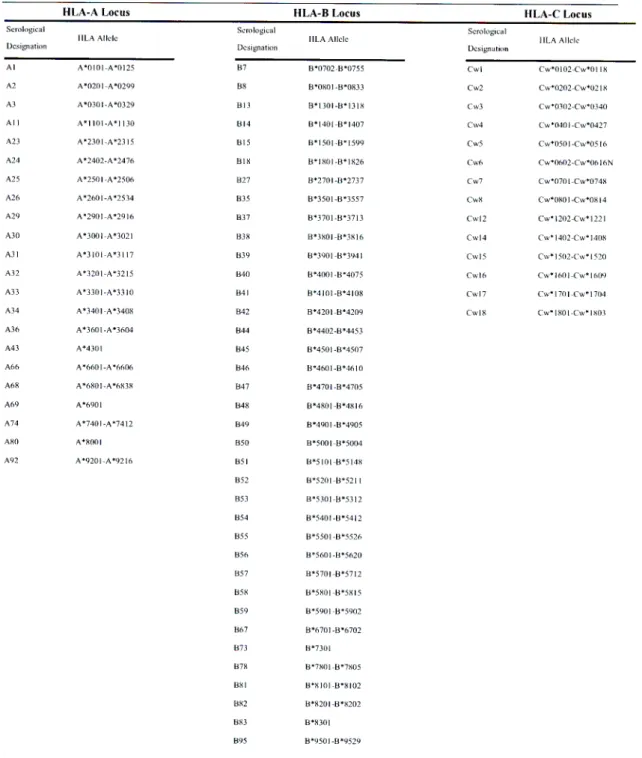
Table 1.1.1 Classical HLA Class I Alleles and their Serological Designations.
HLA-A Locus HLA-B Locus HLA-C Locus
Serological Designation
IILA Allele
Serological Designation
I I LA Allele
serological Designation
!ILA Allele
Al A*0101-A*0125 87 8*0702 -B*0755 Cwl Cw*0102-Cw*0118
A2 A*020I-A*0299 88 13*0801-B*0833 Cwt Cw.0202-Cw*02 I 8
A3 A*0301-A*0329 813 13*1301-8*1318 Cw3 Cw•0302-Cw*0340
All A*110I-A*1130 B14 8*I401 -B*1407 Cw4 Cw*0401-Cw*0427
A23 A*2301-A*2315 B15 B*1501 -B*1599 Cw5 Cw*0501-Cw*0516
A24 A*2402-A•2476 B18 B*180I-B*1826 Cw6 Cw.0602-Cw*O6 ION
A25 A*2501-A*2506 B27 8*2701-8*2737 Cw7 Cw*0701-Cw*0748
A26 A*260 I -A*2534 B35 B*3501-B*3557 Cw8 Cw*080 I -Cw*0814
A29 A*2901-A*2916 B37 B*370143.3713 Cw12 Cw*1202-Cw*1221
A30 A.3001-A.3021 1338 13.3801-B*3816 Cw I 4 Cw.1402-Cw. I 408
A31 A*3101-A*3117 B39 8*390I -B*394 I Cwl 5 Cw*1502-Cw*1520
A32 A*3201-A*3215 1340 8*4001-13.4075 Cwl 6 Cw* I 601-Cw*I609
A33 A*3301-A*3310 B41 13*4101-8.4108 Cwl 7 Cw*1701-Cw*1704
A34 A.3401 -A*3408 B42 B.4201 -B.4209 Cw 1 8 Cw. 180 I -Cw.I803
A36 A*3601 -A*3604 1344 B*4402-B*4453
A43 A*4301 1345 8*4501 -B*4507
A66 A*6001 -A*6606 B46 8*4601-8*4610
A68 A.6801 -A.6838 847 B.4701 -B.4705
A69 A*6901 B48 B*4801-8*4816
A74 A*7401 -A*7412 1349 8*4901 -B*4905
A80 A*8001 B50 B*500143.5004
A92 A.9201-A.9216 851 8.5101 -B*5148
B52 8*5201-B*5211
B53 B*5301-13*5312
1354 8*5401439412
B55 8*550I -B*5526
1356 B*5601 -B*5620
B57 B*5701 -B*57I2
B58 B*5801 -B*5815
B59 B*5901 -B*5902
1367 13.6701-13*6702
B73 B*7301
B78 B*7801 -B*7805
881 8*810I-8*8102
1382 8*8201-B*8202
1383 B*830I
1395 B.950 I -B.9529
Adapted from httn://www.anthonynolan.org.uk/HIG/lists/classllist.html
HLA-DR Locus HLA-DQ Locus
Serological
Designation [ILA Allele
HLA-DP locus
Serological
I I LA Allele Designation
Serological
Designation IILA Allele
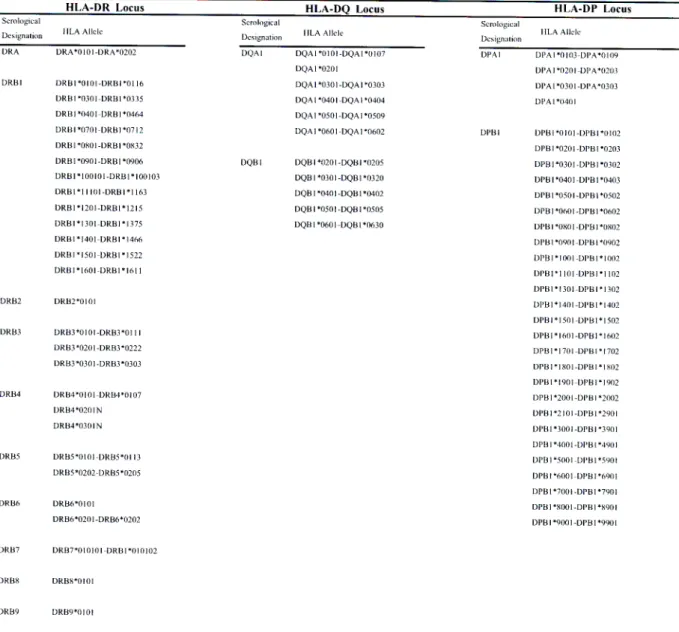
Table 1.1.2 Classical HLA Class II Alleles and their Serological Designations.
DRA DRA*010 I -DRA*0202 DQAI DQA I *0101-DQAI*0107 DPAI DPA1*0103-DPA*0109
DQA I *0201 DPA I *020I-DPA*0203
DRB1 DRBI*0101-DRBI*0116 DQAI*0301-13QA1.0303 DPA1*0301-DPA*0303
DRI31.0301-DRBI*0335 DQAI *040 I -DQA I *0404 DPAI *0401
DRBI*0401-DRB1*0464 DQA1.0501-DQA1*0509
DRB1*0701-DRBI *0712 DQA1*0601-DQAI*0602 DPB I DPB1.0101-DPB1.0102
ORB 1 *0801-DRB1*0832 DPB1*0201-DPB1.0203
ORB 1.0901-DR B I *0906 DQB I DQB I *0201-DQBI*0205 DPB I *0301-DPLII *0302
DREII*100101-DRBI*100103 DQB I *030 I -DQB I *0320 DP131*0401-DPB1*0403
DRBI *11101-DRB I *1163 DQB1*0401-DQB I *0402 00131•0501-DPB I *0502
ORBI*1201-DRBI*1215 DQB I *050 I - WEI I *0505 DP B I *0001 -DI'B1*0602
DR BI *1301-DRB1 * 1375 DQB1*0601-DQ131*0630 DI'B I *0001 -DI'B I *0802
DRBI*1401-DRBI*1466 DPBI*090 I -DP B I *0902
DRBI *150I-DRBI*1522 DPB1.1 001-DPB1•1002
DRBI*1601-DR/31.1611 DPBI*1101-DPBI*1102
DPB1.1301-DP131.1302
DRB2 DRB2*0101 DPB1.1 401-DPB1.1402
DPB1.1501-DPB1*1502
DRB3 DRB3*0101-DRB3*0111 DPBI *1601 -DPB1*1602
DRB3*0201-DRB3*0222 DPB I *1701-DPBI*1702
DRE3*0301-DRB3.0303 DRBI*1801-DPB1*1 802
DPBI*1901-DPB1.1902
DRB4 DRB4*0101-DRB4•0107 DPBI *2001-DPBI *2002
DR134*0201N DPB1*2101 -DPBI *2901
DRB4*030 IN DPB I •3001-DPBI *3901
01 131.4001 -DP13 I *4901
ORBS DRB5*0101-DR135*0113 DPI31*5001-DPB1*5991
DRB5•0202-DRB5*0205 DI131.6001-DPB I *6901
DPB1*7001-DPBI *7901
DRB6 DRB6*0101 DIIB I *8001-DPBI*8901
DRI36.0201-DRB6*0202 DPB1.9001-DPB1*9901
DRB7 DRB7*01010 I -DRBI*010102
DRB8 DRI38*0101
DRB9 DRB9*0101
Adapted from htto://www.anthonynolan.org.uk/HIG/lists/class2.html
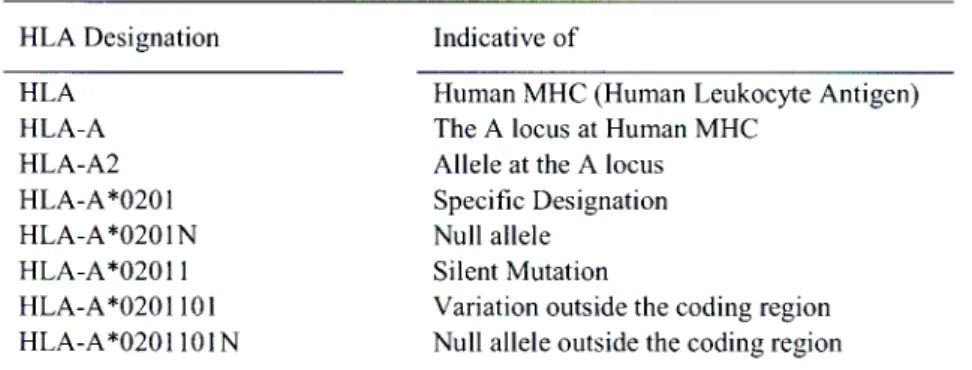
In the human MIIC, alleles are denoted by adding a letter and a number e.g., HLA-A2 where 2 is the allele at locus A (Margulies, 1999). Human MHC genes can be more specifically denoted by adding a superscripted asterisk (McCluskey and Peh, 1999) to the prefix-locus combination followed by a four digit number (Margulies, 1999) to the locus which corresponds to a specific allele e.g., HLA-A*0201 (McCluskey and Peh, 1999).
The first two digits following the locus represent the fundamental serological specificity of the allele and the following two a specific allele sequence but the addition of a fifth digit indicates a silent polymorphism (Leffell, 2002; Williams, 2001). Variations that take place outside the coding region result in the addition of a sixth and seventh digit ( Williams, 2001). The presence of a null allele sequence is denoted by the addition of an N to the allele number (Williams, 2001). A simplified illustration can be seen by Table
1.1.3.
Private antigens are HLA antigens which are resolved by a single allele alone as opposed to public antigens which are familiar to a number of HLA molecules and which bears its own private antigen (Schwartz, 1987). Excellent examples of HLA public antigens are HLA-Bw4 and HLA-Bw6 (Schwartz, 1987). HLA antigens that were originally considered to be single private antigens were identified as being part of a group of 2 to 3 closely related antigens, each of narrow specificity and characterized as 'splits' of the original antigen of broad specificity (Schwartz, 1987).
Nomenclature of split antigens occurs as follows. The broad antigen of which the split is made follows the split in parenthesis (Schwartz, 1987) for example, HLA-DR15(2) and HLA-DR16(2) implies that both HLA-DR15 and HLA-DR16 are splits of the broad antigen HLA-DR2 (Margulies, 1999) indicating that HLA-DR2 could possibly be regarded as a public HLA antigen which bears HLA-DR15 and HLA-DR16 as private antigens (Schwartz, 1987).
Blank alleles are indicative of homozygous alleles or alleles that cannot be defined by the available reagents (Schwartz, 1987). This could be due to the great polymorphism of the MHC whereby reagents produced in one country for a certain allele may not be able to detect alleles of an entirely different population. Blank alleles present with resolved alleles may be defined by family studies (Schwartz, 1987).
Table 1.1.3 A Simplification of HLA Nomenclature.
HLA Designation Indicative of
HLA Human MHC (Human Leukocyte Antigen)
HLA-A The A locus at Human MHC
HLA-A2 Allele at the A locus
HLA-A*0201 Specific Designation
HLA-A*0201N Null allele
HLA-A*02011 Silent Mutation
HLA-A*0201101 Variation outside the coding region HLA-A*0201101N Null allele outside the coding region
* Adapted from McCluskey and Peh, 1999.
1.1.3 Inheritance of MHC In Humans
Humans inherit their HLA genes by a Mendelian-dominant method (Buckley, 2003;
Sayegh et. al., 2000; Sullivan and Amos, 1986). Inheriting a specific combination of the six MHC loci (viz. Class I and Class II) is referred to as a haplotype (Brodsky, 2001) which is passed on to the offspring by one of the parents (Payne, 1977) due to linkage of the HLA genes and low crossover rates (Buckley, 2003; Sayegh et. al., 2000). Each individual has two haplotypes each inherited from one parent (Buckley, 2003; Sullivan and Amos, 1986) thus constituting the genotype (Payne, 1977).
1.1.4 Structure of The Human Major Histocompatibility Complex 1.1.4.1 Gene Structure of Human MHC (HLA)
The genes which encode the HLA are present on the short arm of autosome (Buckley, 2003) chromosome 6 (Williams, 2001) in the distal portion (Rees, 1997) of the 6p21.3 (Alper et. al., 2006; Rees, 1997) band between 6p21.31 and 6p21.32 (Margulies, 1999).
The HLA complex comprises more than 200 genes, extends over 4 x 10 6 nucleotides (Janeway et. al., 2005) inhabiting a segment of about 4 centimorgans (cM) (Schwartz, 1987) and forms a linkage complex with phosphoglucomutase-3 (PGM-3), glyoxalase (GLO) and urine-pepsinogen-5 (Pg-5) (GOtze, 1981).
The genes are divided into three regions (see Figure 1.1.1) and are arranged from the centromeric to the telomeric end (Porto et. al., 2005) as Class II, Class III and Class I
genes respectively (Rees, 1997). Class I genes are strictly a-chain genes whereas Class II genes are heavy a- and light 13-chain genes (Janeway et. al., 2005).
I
1 U
U
•
7c •
a. •
CC
CC I
O /
❑
0❑
z
❑
`O"
1=0
CO1
❑
CO0
CO
C4
CtCO
U
I
0
I
-ac
I
CACA
C- I
U
U U
U
=::=
V) cf) 0
= -0 t
C) 16' CO
r:"
•",.'' -0 6„,- II) o, z 66., o, ..0 0,
< CS, vi . V_ CO ,...1 CO ,., z al))..
o[1] 3-4 O 0 ,;•.,- E 'F c>
2 cu o -.0 -=
o C...)
<•.- - CO o ci,
-.;,-:,
! —c's >.,- .--,• CO .., as cx, o -"
•
":- = c'N .=v, ,-;•:, ct --.:—, z
tu v)
Y — ,:-.... •••.:
Z 0, ',) CO = 0., -o o 4
u — CO
"a. c9- (2c4'
°,;,) 66 E C 0.) 00 ,/, >
ca _, a; vi.'n
N - co
a.) r, © -6., -0, , E ' Fa a;
e:, CC ,-- C.) = CCS
c,-;" 1) 71
< CJ E ''
a CT (... 0
• .--. . •-, '-'
C) ,.0 —100
,-- ° CT I'0 .1 00:---
46 0,
i . --' 0 c', c_
Le, "0 N:.0i CO
6,() 0
'-' 01
O
.-= < 7:3 ri) 4.
C.)
0 i. CO .--1
,--, © .-CS
C...) ca „ia, <NC)
_ .-cs'),
,., > cc ,,;-
CO oE CO'9 , co E'.
- ,;t-- to
• C co C.)
u> C--:
z d cr,
CO
N CS 2
„.,,- g cr., z g .> 0.,E
(-4 cC-J . CO
o,
>
c.r>
-g ,::::,- c=
c)
>-, .•
• 4-
Q ..,-.) -6,
a ,,°-, z o 4,7> -7:” -,-
i.> <( "" ..a C 66 • R.,
c..a) -r<
st.,,
t)„, ,-. =,x`. ,;-,- 1n1 . ° C,Id 6
•
1' 7.) "
h. . Ri x
= CO
la 13'., 0
4: CO t
The HLA Class II region is divided into three subregions viz. HLA-DR, HLA-DP and HLA- DQ (Austyn and Wood, 1993). HLA-DP and HLA-DQ both have two a (a1 and a2) and two (13i and (32) genes (Austyn and Wood, 1993) whereas HLA-DR has only one monomorphic a gene (Sayegh et al., 2000) and three 13 132 and (33) genes whose product is able to couple with the a chain resulting in four MHC Class 11 molecules from the three subregions (Janeway et. al., 2005; Schwartz, I 987).
The position of the genes are ordered as follows, the HLA-D (Class II) region (Giitze, 1981) closest to the centromere (van Rood et. al., 1981) followed by the diverse Class III region which spans 120kb (Rees, 1997) thereafter HLA-B, HLA-C, HLA-E, HLA-A, HLA-H, HLA-G and HLA-F (Margulies, 1999) respectively followed approximately 4 megabases telomerically from HLA-A by HFE (Gruen and Weissman, 1997; Janeway et. al., 2005;
Porto et. al., 2005 ) which is a hemochromatosis related gene (Porto et. al., 2005).
HLA-A, -B and -C are classical Class I MHC antigens (Schwartz, 1987) and non-classical Class I antigens include HLA -E, -F, -G (Hviid et. al., 1999; Pozzi et. al., 1998). In addition to the Class III region, the genes controlling the expression of DR molecules are present between the HLA-D and HLA-B region (GOtze, 1981).
Proteins that are responsible for antigen processing and presentation of Class I molecules (LMP2; LMP7 and TAP1; TAP2) as well as Class II molecules (HLA DM) have the genes that encode them in the Class II region (Bennetts et. al., 1999; Chevrier et. al., 1998; Rees, 1997). TAP genes lie between DQB1 and DPA1 (Alvarado-Guerri et. al., 2005). In close
proximity to the centromere lies TAPBP which codes for tapasin (Janeway et. al., 2005).
Also present in the Class II region encoding the DO molecule, are the DNa and D013 genes (Janeway et.al., 2005).
The Class III region, centromeric to the Class I region (Kimball, 1986), known as the Central MHC (Gruen and Weissman, 1997; Hauptmann and Bahram, 2004; Noble et. al., 2006) is located between the Class II and Class I regions (Wright et. al., 2001) and contains genes unrelated to the Class I and Class II regions viz. complement protein genes C4; Factor B (Bf) and C2 (Barret, 1988; Janeway et. al., 2005), extracellular matrix protein genes (Tenascin [TNX]) and Immunoglobulin superfamily gene proteins (1C7; G6f; G6b) (Hauptmann and Bahram, 2004), hormonal synthesis genes (steroid 21-hydroxylase; CYP21), cytokine encoding genes (Tumor Necrosis Factor a (TNF-a) and lymphotoxins; LTA (TNF-(3) and LTB) (Gruen and Weissman, 1997; Janeway et. al., 2005 and Makhatadze, 1998), cellular stress genes (MICA; MICB) (Janeway et. al., 2005) and Heat Shock Proteins (HSPAIA;
HSPA1B and HSPA 1 L) (Hauptmann and Bahram, 2004). Other cellular stress genes (MICC; MICD and MICE) are located in the MHC Class I region (Janeway et. al., 2005).
Other genes involved in inflammatory responses are B144, AIF-1, I is B-like and SKI2W (Gruen and Weissman, 1997). In 1997, Gruen and Weissman suggested that genes which are involved in inflammation, stress and infection be categorized into a distinct region called the Class IV region.
MHC-X lies between HLA-C and HLA-E (Edwards and Hedrick, 1998 and Trowsdale, 2005), occupies 7.6 megabases and is an extension of the Class I and Class II regions and contains genes that encode histones and tRNA (Trowsdale, 2005).
1.1.4.2 Physical Structure of HLA Class I and Class II Molecules
Chapter 1.1.4.1 focused on the genes which encoded the MHC in humans. I will now concentrate on the products of the Class I and Class II region of the HLA complex. Class I and Class II molecules are cell surface receptors (Maenaka and Jones, 1999) which are structured differently to facilitate different functions in antigen presentation, peptide binding and T-cell activation (Janeway et. al., 2005).
Both Class I and Class II molecules are heterodimeric (Maenaka and Jones, 1999) glycoproteins (Austyn and Wood, 2003) which both span the cell membrane (Brodsky, 2001 and Turka, 1997) are composed of four domains which are paired (Janeway et. al., 2005) into proximal constant and distal variable regions (Wolfe, 1997) and possess a single peptide binding groove which is able to accommodate a variety of peptides (Abbas and Lichtman, 2003).
1.1.4.2.1 Structure of Class I Molecules
The Class I molecules are made up of two chains, a heavy a chain (Bettinotti et. al., 2003) with a molecular weight of 44 kDa (Anonymous, 2007b; Rees, 1997) and a light [3 chain with
Transmcmbranc Domain
a molecular weight of 12 kDa (Sayegh et.al., 2000). The a chain is encoded by Exons 2, 3 and 4 of the MHC and can be distinguished into 5 structural domains, al - a5 (Austyn and Wood, 1993; Barret, 1988).
PBR PBR
Extraccllular Domain
a b
Cytoplasmic Tail
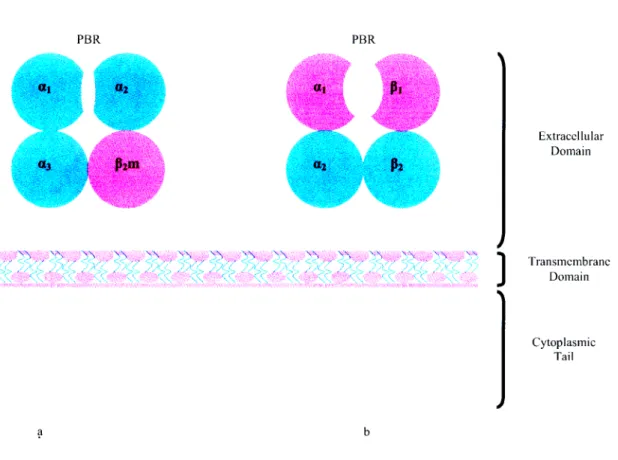
Figure 1.1.2 Diagrammatic representation of MHC Class I (a.) and Class II (b.) molecules. PBR= Peptide Binding Region. Adapted from Austyn and Wood, 1993; Brodsky, 2001; Sayegh et. al., 2000.
Three of these domains al, a2 and a3 present as folded (Brodsky, 20001) extracellular domains (Hughes and Yeager, 1998) and form a noncovalent association (Kimball, 1986;
Trinh et. al., 2002) with a soluble (Maenaka and Jones, 1999) polypeptide 132-microglobulin
((32-m) (Brodsky, 2001) which is encoded by a gene present on chromosome 15 (Janeway et.
al., 2005) (Figure 1.1.2a).
The a chain of the Class I molecule is comprised of three regions (Schwartz, 1987). The first region is a hydrophobic extracellular region (Schwartz, 1987) which is comprised of al, a2 and a3 domains (Brodsky, 2001) each comprised of approximately 90 amino acids (Rees,
1997; Schwartz, 1987). The second and third regions are comprised of the a4 and a5 domains (Austyn and Wood). These regions are the hydrophobic transmembrane region made up of about 25 amino acids (Schwartz, 1987) which spans the lipid bilayer (Ausytn and Wood, 1993) and an intracellular, hydrophilic (Schwartz, 1987) cytoplasmic tail made up of about 30 to 40 amino acids (Austyn and Wood, 1993) attached to the a3 domain. The a3 domain is the only Class I molecule chain that spans the membrane (Janeway et. al., 2005) thus anchoring the molecule to the membrane by a carboxy-terminus (Brodsky, 2001).
As documented in Chapter 1.4.2, MHC Class I and Class II molecules are made up of four domains which are paired. In Class I molecules the relatively conserved (Rees, 1997) a3 and (32-m domains are paired, placed closest to the cell membrane (membrane proximal domain) (Austyn and Wood, 1993) and have a structure similar to that of an immunoglobulin domain (Janeway et. al., 2005; Nikolich-ugich et. al., 2004). The highly polymorphic (Rees, 1997), variable (Sayegh et. al., 2000; Williams, 2001) a, and a2 domains are paired, placed distal to the membrane surface (Nikolich-k' ugich et. al., 2004) and folded in a particular way to form a cleft on the molecule surface (Janeway et. al., 2005). This cleft is the site of peptide
binding (Williams, 2001) and is designated the peptide binding cleft/groove/region, the ends of which are closed up by specific hydrophobic residues (Maffei and Harris, 1998).
1.1.4.2.2 Structure of Class II Molecules
Class II molecules are heterodimers (Rees, 1997) comprised of two glycosylated (Austyn and Wood, 1993) polypeptide (Giitze, 1981) chains (Janeway et. al., 2005; Varney et. al., 1999) viz. a heavy a chain made up of 229 amino acids (Schwartz, 1987) with a molecular weight of 34kDa (Sayegh et. al., 2000) and a light 13 chain made up of 237 amino acids (Schwartz,
1987) with a molecular weight of 28kDa (Sayegh et. al., 2000). Both chains of Class II molecules are encoded within the MHC (Janeway et. al., 2005; Laurent and Welsh, 1984) by different genes (Varney et. al., 1999) and are linked noncovalently (McCluskey and Peh, 1999).
Class II molecules are made up of three regions viz. an extracellular hydrophilic portion (Schwartz, 1987) where both the a and
p
chains fold to form two pairs of extracellular domains (Brodsky, 2001) each made up of about 100 amino acids (Austyn and Wood, 1993), a hydrophobic (Schwartz, 1987) transmembrane region made up of about 20-25 residues (Austyn and Wood) and an intracellular hydrophilic (Schwartz, 1987) cytoplasmic tail of about 3-15 residues in the a chain and 8-20 residues in the 13 chain (Austyn and Wood, 1993) (Figure 1.1.2b).The a chain domains are designated ai and a2 and the
p
chain domains are designated PI and 132 (Brodsky, 2001). Unlike the Class I molecule, there is no association with a 132-m domain (GOtze, 1981); instead al pairs with 131 and a2 pairs with (Austyn and Wood, 1993).Membrane proximal, Immunoglobulin-like (Schwartz, 1987) domains are a2 and 132 (Austyn and Wood, 1993). Both these chains span the membrane (Janeway, et. al., 2005) and are anchored to the membrane by their carboxy termini (Brodsky, 2001).
Membrane distal domains are the al and 131 variable (Williams, 2001) domains. These domains fold in a specific way to form a peptide binding groove (Schafer et. al., 1995) which appears open-ended (Maffei and Harris, 1998) and wider in the Class II molecule due to the type of peptide it binds (Janeway et. al., 2005). Both 13 chain domains as well as the membrane proximal a domain encompass intrachain disulfide bridges (Sullivan and Amos,
1986).
1.1.5 Crystal Structure of HLA Class I and Class II Molecules
In order to determine HLA structures by x-ray crystallography at a resolution of 3.5A (Bjorkman et. al., 1987) and 3.3A (Brown et. al., 1993) for Class I and Class II molecules respectively, the extracellular domains of the molecule had to first be cleaved with papain from the cell surface before purification (Margulies, 1999). These experiments made it possible to determine the way the chains fold into a 3-Dimensional structure (Sayegh et. al., 2000).
1.1.5.1 Structure of Class I Molecules
Bjorkman et. al. (1987) resolved an HLA Class I molecule (HLA-A2) by X-ray crystallography. Later a refined structure was determined by Saper et. al. (1991) at a resolution of 2.6A. Briefly, the peptide binding groove occurs at the surface of the Class I molecule (Sayegh et. al., 2000) at the NH2 domains, al and a2 (Margulies, 1999) which have a similar tertiary structure (Austyn and Wood, 1993). External view of the cell indicates the a3 and 132-m domain pair asymmetrically (Margulies, 1999) proximal to the membrane surface (comparable to the constant domain of an immunoglobulin molecule) and the al and a2 domain pair distal to the membrane surface (Austyn and Wood, 1993) with the peptide binding site facing the exterior (Sayegh et. al., 2000).
The a3 and 132-m domains are made up of two anti-parallel 13-pleated sheets linked by a disulfide bond, one containing four 13-strands and the other three 13-strands (Bjorkman et. al., 1987) (See Figure 1.1.3a). The al and a2 domains fold almost symmetrically (Sayegh et. al., 2000) to form the peptide binding groove. The boundaries of this groove are formed by two segmented a-helices (Janeway et. al., 2005) and is supported by the floor of the groove (Margulies, 1999) which is composed of eight anti-parallel 13-strands (Janeway et. al., 2005;
Margulies, 1999; Zacharias and Springer, 2004).
1.1.5.2 Crystal Structure of Class II Molecules
X-ray crystallography indicates that the Class II molecules are folded almost identically to the Class I molecules (Brown, 1993) (See Figure 1.1.3b). The difference lies in the heavy and light chains of the Class II molecule which are joined symmetrically (Nikolich-2ugich et.
al., 2004) as opposed to an asymmetrical association between the Class I molecule domains (Margulies, 1999) and the space between the ends of the peptide binding groove being more ajar in the Class II molecules than the Class I molecules (Janeway et. al., 2005; Sayegh et.
al., 2000). The antigenic peptides are bound to the MHC Class II molecules via hydrogen bonds (Stern et. al., 1994).
1.1.6 Tissue Distribution and Expression of HLA Class I and Class II Molecules
Class I molecules are found on almost every (Schwartz, 1987) somatic (Austyn and Wood, 1993) nucleated (Barrett, 1988) cell as well as platelets (Sayegh et. al., 2000; Williams, 2001). The degree of expression of Class I antigens is determined by the type of cell it appears on (Austyn and Wood, 1993; Janeway et. al., 2005). For example, muscle cells;
neurons (Austyn and Wood, 1993); kidney cells and even red blood cells display lower or no levels of expression than cells found in the immune system (Janeway et. al., 2005). The level of expression however can be elevated by an immune response (Austyn and Wood) usually during inflammation and induced by cytokines Interferon-y (INF-y) and tumor necrosis factor (TNF) (Turka, 1997).
Class II antigens are found predominantly on antigen-presenting cells; B cells and their precursors (Laurent and Welsh, 1984) immunocompetent cells such as macrophages/monocytes (Schwartz, 1987) and dendritic cells (Germain, 1994) as well as endothelial (not generally expressed) (Sayegh et. al., 2000) and epithelial cells (Laurent and Welsh, 1984), resting (Schwartz, 1987) and activated T cells (Turka, 1997). Cells expressing Class II molecules are involved in extracellular uptake of antigens as well as triggering immune responses (Austyn and Wood, 1993).
Expression of Class II molecules are increased in B cells, other antigen presenting cells and epithelial cells of the thymus but are found to be MHC II-negative in cells of the kidney, neutrophils and the brain although microglia of the brain are found to be MHC II positive (Janeway et. al., 2005). The level of expression of Class II molecules are also increased by inflammatory responses by antigen (Turka, 1997) or cytokines such as INF-y (Austyn and Wood, 1993). Cells that do not generally express Class II molecules, such as endothelium;
renal proximal tubules and keratinocytes (Turka, 1997) can be stimulated to do so during inflammation (Sayegh, et. al., 2000; Williams, 2001).
Cells that express both Class I and Class II molecules contain three Class I antigens and three or more Class II heterodimers (Buckley, 2003). Both MHC Class I and Class II molecules exist in the serum of healthy individuals and during disease are elevated (Zavazava and Eggert, 1997).