Mathematics and Informatics ICTAMI 2005 - Alba Iulia, Romania
A STATISTICAL SUPERVISED CLASSIFICATION USING A PERCEPTRON CRITERION FUNCTION
Iuliana Florentina Iatan
Abstract. In this paper we project a statistical classifier, based on per-ceptron criterion function. To this aim we use a statistical model to set up a programming code in order to test the ECG signal classification for ischemic heart disease diagnosis. This programm uses the database [2] of 40 prototypes (2 classes). The programm recognition score has been of 100% for the training lot and of 95% for the test lot, for almost all the considered variants of feature selection with KLT( Karhunen- Loeve Transformation).
2000 Mathematics Subject Classification: 68-xx, 68Txx, 68T10. 1. Introduction
The most of all classification or pattern recognition methods is to decide to which class an unknown pattern belongs. Pattern recognition specially uses mathematical methods of statistical decision theory and this approach one named statistical pattern recognition. In the field of statistical recognition,the classification decision one based on a similarity measure or a discriminant function.
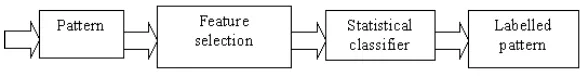
The statistical pattern recognition system is shown in Fig.1 and consists of the following two stages:
Figure 1: The statistical pattern recognition system
The feature selection strongly affects the statistical classification perfor-mances and for this reason it is thought to be one of the main stages of the statistical pattern recognition process.
At this point, it should be mentioned that some of the classification algo-rithms are more efficient on spaces of low dimension and fail to be practical when applied on spaces of higher dimension; transformations of the original n-dimensional feature space into a space of lesser dimension are therefore strongly recommended.
In this respect, we choose here the Karhunen- Loeve transformation = KLT [1] or Principal Component Analysis= PCA in order to achieve the passing from the initial observation space to a lesser dimension space.
2. Architecture of the statistical perceptron classification model.
We suppose that we have a set of N vectors{X1, X2, . . . , XN} ⊆ ℜn which
belong in two classes ω(Xk) ∈ {ω1, ω2},where ω(Xk), k = 1, N represents the
class whose belongs the vectorXk. Namely, each vectorXk, k = 1, N is labelled
either in the class ω1 or in the classω2.
The projection of a classifier based upon the perceptron criterion function consists in the following stages:
1. the training stage when we adjust the weight vectorWt
= (w1, w2, . . . , wn),
2. the test stage when we realize the choice of the class which will be allotted the vector Xk, k = 1, N, proceeding from the decision rule
g(Xk) =W t
Xk (
>0 if Xk∈ω1
≤0 if Xk∈ω2 (1)
after we calculated the discriminant function valuesg(Xk) =WtXk, k =
1, N.
A simple way of determining W is [1] to make the variable change Y =X for X ∈ω1 and Y =−X forX ∈ω2 in order to have a restriction in (1) with a single sign.Then (1) become
Wt
In this case, we will choice the following perceptron criterion function for solving the inequation system Wt
Xk >0
J(W) = X Yk∈G(W)
(−WtYk) (3)
which will be minimized, where G(W) is the wrong classified vector set of W (J(W) = 0 if none sample was wrong classified).
The recursive estimation equation of the weight vector, upon the negative gradient method [1]is:
Wk+1=Wk−c· ∇WJ|W=WK, c > 0 (4)
where ∇WJ|W=WK = (∂J/∂W)W=WK is the gradient vector.
From (3) results
∇WJ =− X Yk∈G(W)
Yk (5)
and the recursive equation of the negative gradient become Wk+1 =Wk+c·
X
Yk∈G(Wk)
Yk (6)
where G(Wk) is the wrong classified vector set ofWk.
If we assume that the samples are sequential observed then the algorithm (6) become:
(
Wk+1 =Wk if WktYk >0, k = 1, N ,
Wk+1 =Wk+c·Yk if WktYk ≤0, k= 1, N (7)
3.Experimental results
with ischemic heart disease.The ECG database consists of the training lot and the test lot, each of them having 20 subjects from the both categories: 10 normal (fig.2) and 10 with ischemic heart disease (fig.3).
We will present a part of the Matlab program which realizes the classifica-tion of the ECG signals in one of the two classes, upon the statistical model from [1].
At first, one assume w∈ ℜm+1 a weight random vector in [-1,1], thus: w=rand(m+ 1,1);
w= 2∗w−1;
where m is the number of features extracted with PCA. We will consider the following two stages:
1. the training stage when we will adjust the weight vector, on the basis of (7);
2. the test stage of a training lot and of the test lot when we will not modify the weight vector, obtained from the first stage.
The both stages will finish in a finite number of epochs N max(an epoch means the crossing of all the vectors).
We consider {Y1, Y2, . . . , Y20} ⊆ ℜm+1
the vector set of the first class, re-spectively {X1, X2, . . . , X20} ⊆ ℜm+1 the vector set from the second class. i= 1;
% beginning of the first stage while(i <=N max)
p=1;
while(p <= 20) if p==k H =Y k;
elseif p== k+ 1 H =Xk;
end V=H(:);
z=fi’*V; % fi is the matrix of the eigenvectors if mod(k,2) = 0
z = [1 z′
]; else
z = [−1−z′
]; end
if w′∗z <= 0
w=w+ 0.1∗z; end
p=p+ 1; end
% beginning of the second stage (the test stage of the test lot) p= 1;
while(k <= 20) if p==k H=Yk;
elseif p== k+ 1 H =Xk;
end
V =H(:); z =f i′
∗V; z = [1 z′
]; z=z′
; if w′∗z >= 0
et(k) = 1; elseif w′
∗z <0 et(k) = 2; end p=p+ 1; end er = 0; for k = 1 : 20 if et(k) ==ett(k) er =er+ 1; end
end
rt(i) = (er∗100)/20; i=i+ 1;
end
We denoted by et(k) the real label, by ett(k) the ideal label of the k- the vector and by rt(i) the recognition score over the test lot at the epoch i.
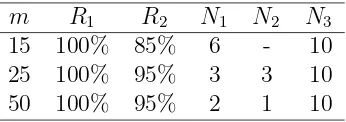
One obtain the results from the Table 1.
• m is the number of features selected with PCA,
• R1 -recognition score over the training lot,
m R1 R2 N1 N2 N3
15 100% 85% 6 - 10
25 100% 95% 3 3 10
[image:6.612.210.383.88.149.2]50 100% 95% 2 1 10
Table 1: The performances of the statistical model based on perceptron crite-rion function, experimented to ECG signals classification, with PCA.
• N1-the number of epochs after which the recognition score over the train-ing lot becomes 100%,
• N2-the number of epochs after which the recognition score over the test lot becomes ≥ 90%,
• N3-the total crossing epochs number with a view to obtaining an as good as possible recognition score over the test lot.
The next figures present the recognition score over the training lot (fig.2) and, respectively over the test lot, for m = 15,m = 25,m = 50 features ex-tracted with PCA (fig.3).
Figure 2: Recognition score over the training lot form = 15, m= 25, m = 50
Figure 3: Recognition score over the test lot for m= 15, m= 25, m= 50 4.Conclusion
The aim of this paper is to realize a programming code in order to test the ECG signal classification using a statistical model of type perceptron [1].
From Table 1, one can observe that our programming recognition score is the best (of 95%) for the test lot the both for m= 25 and for m= 30 selected features with PCA.
In [2] we obtained the best recognition score of 100% over the test lot, using a neuro- fuzzy classifier (called Fuzzy Gaussian Neural Network), in the case of m= 50 features extracted with PCA.
References
[1] V. E. Neagoe, O. St˘anasil˘a,Teoria recunoa¸sterii formelor [The theory of pattern recognition, Ro], Bucharest, Academia Romˆan˘a Publishers, 1992.
[2] V. E. Neagoe, I.F. Iatan, S. Grunwald,A Neuro- fuzzy Approach to Clas-sification of ECG Signals fos Ischemic Heart Disease Diagnosis,the American Medical Informatics Association Symposium (AMIA 2003), Nov. 8- 12 2003, Washington DC, pp. 494-498.
[3] V. E. Neagoe, O. St˘anasil˘a, Recunoa¸sterea formelor ¸si ret¸ele neurale [Pattern recognition and neural networks, Ro]. Bucharest, Matrix Rom Pub-lishers, 1999.
[4] R. Fuller, Introduction to Neuro- Fuzzy Systems, Heidelberg, Physica-Verlag, 2000.
Iuliana Florentina Iatan
Department of Mathematics and Informatics