MACRO-ECONOMIC DEVELOPMENT
The economic growth of Indonesia has indicated a rapid expansion particularly under
the reign of United Indonesia Cabinet (within a period of 1 year). If the economic growth
during the period of 2001-2004 improved by around 3.8% to 5.1%, then that indicator
reached 5.6% in 2005 (Table 1). The slow down of economic growth which took place in
the previous periods, from 0.5% (4.3% - 3.8%) during 2001-2002 to 0.5% (4.8%-4.3%)
in the period of 2002-2003, and finally to 0.2% (5.1% - 4.9%) during 2003-2004, could
be well-handled. This can be seen by the addition of 0.5% to the growth of economic in
2004 (5.6%-5.1%). The growth by 5.6% in 2005 was the significant achievement to boost
the economic activities in the future.
However, according to Citigroup, the economic growth of Indonesia in 2006 will be
drop to 5.4%. The estimation is based on the assumption that there will be no more
significant jump in fuel price, and the condition of social politic remain stable in order to
revive domestic investment which is predicted to grow by around 10.3%. If then, the
investment growth is higher than 10.3% then the realization of Indonesia’s economic
growth in 2006 would most probably higher than that figure.
In terms of foreign trade activities, the export growth of Indonesia is estimated to be
deteriorated to the level of 3.0%, after reaching 19.5% in 2005. Meanwhile, the import
side also will be sharply declined to 23.7% in 2005 to 6.2% in 2006. This was in line with
the estimated slow down trend in economic growth, since almost all of the economic
activities is heavily dependent upon the imported processed raw materials, capital and
supporting goods, as well as services. However, the trade balance would likely to sustain
a relatively high growth since oil/gas sector as the primary sectors still play a significant
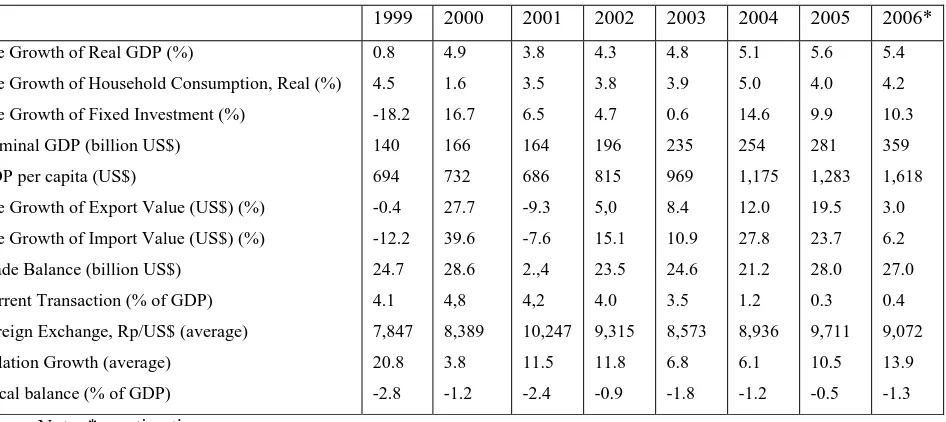
Table 1: The Realization of Macro Economic Performance in Indonesia in 1999-2005 and Estimated 2006
1999 2000 2001 2002 2003 2004 2005 2006*
The Growth of Real GDP (%)
The Growth of Household Consumption, Real (%)
The Growth of Fixed Investment (%)
Nominal GDP (billion US$)
GDP per capita (US$)
The Growth of Export Value (US$) (%)
The Growth of Import Value (US$) (%)
Trade Balance (billion US$)
Current Transaction (% of GDP)
Foreign Exchange, Rp/US$ (average)
Inflation Growth (average)
Fiscal balance (% of GDP)
0.8 4.5 -18.2 140 694 -0.4 -12.2 24.7 4.1 7,847 20.8 -2.8 4.9 1.6 16.7 166 732 27.7 39.6 28.6 4,8 8,389 3.8 -1.2 3.8 3.5 6.5 164 686 -9.3 -7.6 2.,4 4,2 10,247 11.5 -2.4 4.3 3.8 4.7 196 815 5,0 15.1 23.5 4.0 9,315 11.8 -0.9 4.8 3.9 0.6 235 969 8.4 10.9 24.6 3.5 8,573 6.8 -1.8 5.1 5.0 14.6 254 1,175 12.0 27.8 21.2 1.2 8,936 6.1 -1.2 5.6 4.0 9.9 281 1,283 19.5 23.7 28.0 0.3 9,711 10.5 -0.5 5.4 4.2 10.3 359 1,618 3.0 6.2 27.0 0.4 9,072 13.9 -1.3
Note: * = estimation.
Source: BPS and Citigroup for estimation of 2006
Following the decline to one digit after the year 2003, the inflation again surpassed
one digit in 2005 which was mainly attributable to the government act to cut down fuel
subsidy in the country, in October 2005. The mid-term accumulation impact of cutting
down subsidy will be endured in 2006, where the inflation rate is expected to pick up by
an almost 14%.
Two other indicators often used to measure the stability level of macro economic in
Indonesia is the development of Rupiah exchange rate over US$ as well as the composite
index of stock prices (IHSG) in the Jakarta Stock Exchange. Since the year 2003, Rupiah
exchange rate against US$ has been depreciated in a relatively slow growth per year. In
2006, the benchmark of Rupiah is expected to slightly strengthened compare to 2005.
Monthly movement of rupiah’s rate (blue line) and IHSG (red line) since October 2004 to
April 2006 may be looked at Figure 1. This trend indicated a tendency of stronger
rupiah’s rate as well as IHSG, based on the assumption that there will be no sudden
shocks, internally or externally, that might panicking the business player and provoking