IJG Vol. 47, No. 2, December 2015 (115 - 123) © 2015 Faculty of Geography UGM and he Indonesian Geographers Association
Impacts of Human Activities on Tree Species Composition Along
the Forest Savanna Boundary in Nigeria
Christiana Ndidi Egbinola
Received: 09 11 2015 / Accepted: 05 12 2015 / Published online: 15 02 2016 © 2015 Faculty of Geography UGM and he Indonesian Geographers Association
Abstract he study investigated the tree species composition along the forest-savanna boundary in Oyo state of Nigeria with the aim of assessing the impact of human activities on the loristic composition. A transect was placed along the study area and species data was collected from quadrats placed in study plots within diferent study sites. Detrended Correspondence Analysis (DCA) was used to determine vegetation assemblages, while both correlation and the analysis of variance (ANOVA) were used to show the relationship between species in the diferent study sites. Results of the DCA revealed three species assemblages, an area with only forest species, another with only savanna species and a third with both forest/savanna species. ANOVA results further revealed that within the forest and savanna assemblages, species in mature and successional sites were alike. he study therefore revealed that human activities’ within the region is leading to the establishment of savanna species and an elimination of forest species.
Abstrak Studi ini meneliti komposisi jenis pohon di sepanjang batas hutan-savana di negara bagian Oyo Nigeria dengan
tujuan menilai dampak dari kegiatan manusia pada komposisi lora. Sebuah transek ditempatkan di sepanjang wilayah studi dan data spesies yang dikumpulkan dari petak ditempatkan di plot penelitian dalam lokasi yang berbeda. Detrended Correspondence Analysis (DCA) digunakan untuk menentukan kumpulan vegetasi, sedangkan korelasi dan analisis vari-ans (ANOVA) digunakan untuk menunjukkan hubungan antara spesies di lokasi penelitian yang berbeda. Hasil dari DCA mengungkapkan tiga spesies kumpulan, daerah dengan spesies hutan saja, daerah dengan hanya spesies savana dan daerah dengan spesies savana dan hutan. Hasil ANOVA lebih lanjut mengungkapkan bahwa dalam kumpulan hutan dan savana, spesies di situs matang dan suksesi adalah sama. Oleh karena itu penelitian menunjukkan bahwa aktivitas manusia di kawasan ini mengarah ke pembentukan spesies savana dan penghapusan spesies hutan.
Keywords: Floristic composition, Forest-savanna boundary, Successional landuse
Kata kunci: Komposisi lora, Batas hutan-savana, Penggunaan lahan suksesi
Climatic variations have been reported as a major factor in changes in species composition along the forest/ savanna ecotones. Paleo-environmental reconstruction has shown that dry periods led to forest recession in favour of savanna in central Africa between 4000 and 1200 bp (Vincens et al., 1999). Paleo-environmental reconstruction further showed a trend towards the progression of forests over savanna’s ater the droughts, with a time response of vegetation to climate change of a few centuries (Vincens et al., 1999). Field studies of savanna-forest boundaries using remote sensing techniques also conirm the progression of forest over savanna in Cameroon and Congo (Youta, 1998; Guillet et al., 2001).
Anthropogenic disturbances however have become important agents of change of species along the forest savanna boundary. he study by Geiger et al. (2011) revealed ater 35 years of active ire suppression at a forest–savanna boundary in a Cerrado region near Brasilia, Brazil, forest and intermediate species has
Christiana Ndidi Egbinola
Faculty of the Social Sciences, Department of Geography,
been expanding into neighbouring savanna areas despite lower soil nutrient levels.
he forest savanna boundary in western Nigeria was described by Morgan and Moss (1965) as a zone of change consisting of islands, salient and enclaves of forest and savanna sharply separated from one another. Recent human activities may be leading to changes in this zone. he forest savanna boundary in Nigeria is an area of intense human activity, with agriculture as the main occupation and the traditional shiting cultivation is practiced. High rural population density has led to the reduction in the fallow period (Areola, 1991). Clear cutting of trees is also done for farming purposes leading to large scale deforestation. Fuel wood collection and charcoal production are other important economic activities in this area. he unavailability of clean energy sources has led to high dependency of people, especially in the rural areas on fuel wood. In Nigeria, rural areas serve as source areas for charcoal, which is mainly transported for use in urban centres or exported. Charcoal production is predominant towards the northern part of the study area and is the source area for large markets such as Ibadan. Annual bush burning especially during the dry season is another factor
some are deliberately lit for the purpose of gathering fauna (bush meat). hese activities may be leading to the elimination of susceptible forest trees within this boundary, leaving mainly ire tolerant savanna species (Adejuwon and Adesina, 1988) and causing a forceful change in the species composition of plant communities, with an extended destruction of natural vegetation (Egbinola et al, 2015)
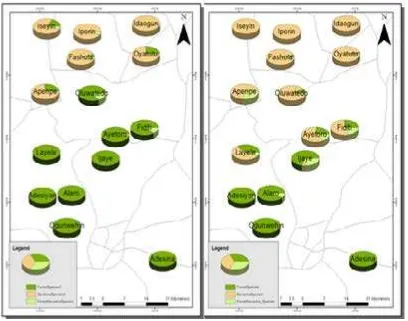
he study was carried out along a climatic gradient between the rainforest region and the southern fringe of the guinea savanna in Oyo state of Nigeria, located approximately between latitude 7°20 and 8°20’ north and longitude 3°40 and 4°00’ east. he area between Adesina in Egbeda local government area and Idaogun in Atiba local government area was chosen for the study. (Figure 1). It is a part of the western plains and ranges of Nigeria with much of it lying approximately between 300 and 600 meters above sea level (Iloeje, 1982). It lies within areas underlain by resistant crystalline rocks of varying degrees and regolith of deeply weathered sedimentary rocks. he region is well drained (apart from the large valleys whose broad loors are given to periodic water logging during the later part of the rainy season). he soils consist of ferruginous tropical soil groups, which are acidic but fertile with high clay content.
he region is located at the drier margin of the tropical rainforest climatic belt, with rainfall between 1000 to 1600mm, with rainfall decreasing as one move northwards. he area experiences a profound dry season which lasts 4 months, from November to February. he wet season lasts for eight months and usually brings regular, heavy precipitation. Temperatures are high throughout the year with mean monthly value of 27°C. here are three vegetal communities, namely; the rain forest, the forest/savanna mosaic and the guinea savanna vegetation belts in the study area.
2. he Methods
Figure 1 showed the map of study area. he study area was demarcated from the topographical map of Western Nigeria, from the forest through the derived savanna to the guinea savanna. Among the major considerations in the collection of the vegetation data was the need to choose all the sites on level ground so that the soil characteristic would be uniform. he
map of the study area was digitized into ArcGIS, the attribute data collected from the ield was then linked to the GIS database.
A transect was laid across the boundary area, this area was then divided into thirty-two, 10km² sub areas; this was done with the aid of the ‘GRID’ function in ArcView GIS (Emuh and Gbadegesin, 2009). hese areas were numbered serially, 1 to 32 from which 15 of the sub-areas were randomly chosen as study sites. Within each site, three plots were taken as sampling points including a mature plot, a seven to nine years (intermediate) fallow plot and a three to four years (young) fallow plot (Emuh and Gbadegesin, 2009). he sampling procedure at each plot was consistent throughout the sampling. First a quadrat of size 40m x 25m, in accordance with the range of quadrat sizes suggested by Westhof and Maarel (1978) for vegetation studies in the tropics was measured; the total numbers of trees as well as the number of trees belonging to each species were counted and recorded.
Detrended Correspondence Analysis (DCA) was used to explore loristic structures in the study area, this technique was implemented using the CANOCO sotware while the statistical analysis was done with the aid of the Statistical Package for Social Sciences (SPSS 17.0).
3. Result and Discussion
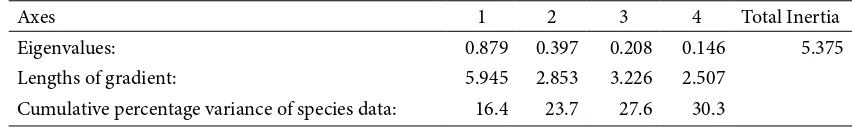
A total of eighty nine tree species were identiied in the study sites. A clear pattern of loristic composition was identiied through indirect gradient analysis using Detrended Correspondence Analysis (DCA). his was used to estimate the strength of the loristic gradient across levels of taxonomic organization. At the species level, the DCA returned a irst axis eigenvalues of 0.879 (Table 1). he irst axis of the DCA ordination distinguished the study sites with forest species from sites having savanna species, while the second axis distinguished the sites on the basis of their fallow ages.
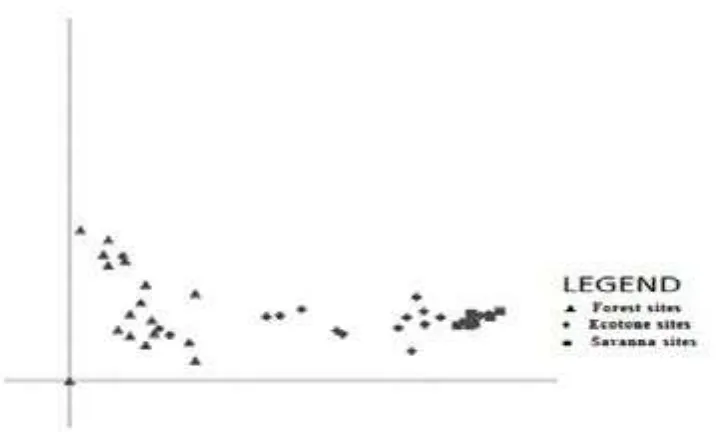
he ordination of the study sites, in relation to the irst two axis produced by DCA is shown in igure 2. he plots grouped together on the basis of their species characteristics, that is, whether they contained forest or savanna species. Plots at the higher end of the ordination scatter diagram are older than the plots at the lower end, while plots to the let are mainly forest
Table 1. Summary of DCA on 45 Plots
Axes 1 2 3 4 Total Inertia
Eigenvalues: 0.879 0.397 0.208 0.146 5.375
Lengths of gradient: 5.945 2.853 3.226 2.507
Cumulative percentage variance of species data: 16.4 23.7 27.6 30.3
plots and those to the right are the savanna plots. he plots with forests species only are shown on the extreme let, plots containing savanna species only on the extreme right while plots in-between contains a mixture of forest and savanna species. he group in-between having a mixture of forest and savanna species can be regarded as an ecotone community. Plots 14 and 18 although termed ecotone sites are more related to the forest plots than to the other ecotone plots, because they both contained only one savanna species, sp73 (Ficus ingens). he other plots 31, 32, 33, 34, 35, 36, and 40 were closely related to the savanna plots because they contained more savanna species than forest species. he ordination diagram from the DCA therefore revealed the presence of three diferent plant communities
including a forest, a savanna and an ecotone community within the study area.
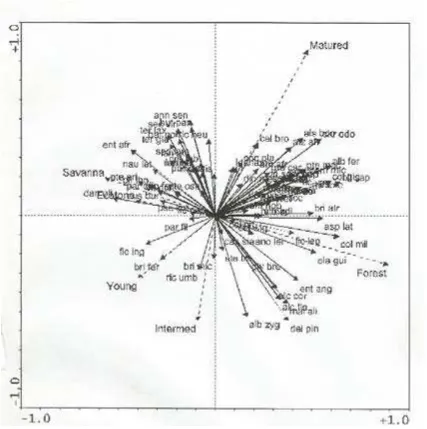
he relationship between species abundance and landuse was explored with the aid of canonical correspondence analysis and the results are presented in table 2.
Eigenvalues of axis 1 (horizontal) and axis 2 (vertical) are 0.562 and 0.277 respectively. Sixty-four percent of the total inertia (weighted variance) in the observed abundance was displayed. here was a positive correlation between age of plot (whether mature, intermediate or young) and species abundance, thus the older landuse had more species. As shown in igure 3, most of the species clustered around the mature landuse in both the savanna and the forest region, with fewer
Figure 2. DCA ordination of 45 study plots
Table 2. Summary of Eigenvalues of Canonical Correspondence Analysis of Species-Landuse Relation
Axes 1 2 3 4 Total Inertia
Eigenvalues: 0.562 0.277 0.549 0.462 5.375
Species-landuse correlations: 0.829 0.841 0.000 0.000
Cumulative % variance of species data: 10.4 15.6 25.8 34.4 Of species landuse relation: 67.0 100.0 0.0 0.0
Sum of all unconstrained eigenvalues: 5.375
Sum of all canonical eigenvalues: 0.839
****Summary of Monte Carlo Test****
Test of signiicance of irst canonical axis: eigenvalue = 0.562
F-ratio = 4.901
P-value = 0.005
species clustering around the intermediate and young fallow landuse. Chromolaena Odorata, Alstonia boonei, Aspilia laterifonia and Bligia sapida had the highest abundance value for the mature forest plots and Celtis
brownie is the most highly correlated species to the
mature landuse. Deinbollia pinnata, Malacanta alifonia
and Albizia zygia had the highest abundance value
for the intermediate fallow (7-9 years) landuse while Bridelia ferruginea was highly correlated to young plots in the forest and ecotone sites. Annona senegalensis, Entada Africana, Butryospernum paradoxa, Securinega
virosa had the highest abundance value for matured
savanna landuse. For the young fallow landuse, Briderlia ferruguinea was the most abundant.
Correlation of the species within the mature, intermediate and young fallow landuse suggested that within the forest regions there was little or no change in the species composition as re-growths had species similar to the mature plants, this was also the case for the savanna regions. However within the ecotone
regions there were marked diferences between species in mature and fallow plots as shown in Appendix 1 and igure 4.
he results also revealed a change in species composition from forest species in areas of mature vegetation to mainly savanna species in areas of vegetation succession within the ecotone regions. his change may be explained by the fact that this area is located in the drier margin of the rain forest, where reduction in rainfall together human disturbances (including farming and bush burning) leads to inability of forests species to easily establish themselves. his therefore leads to a change from the original vegetation type. Change in species composition from forest to savanna species has been reported in other studies for example, Dezzeo et al (2004) reported the replacement of tall and medium forests by low forest and savanna, relating the main triggering factor of change as ire. Ibanez et al (2013) showed that variations in the ire regime as a result of the interactions among climate, ire use by humans and vegetation are likely to drive the dynamics of the savanna-forest boundaries in New Caledonia.
4. Conclusion
Human activities within the forest savanna ecotone have had an adverse efect on the species composition within the region. Results from the vegetation data showed that in areas which are within the main
with mature vegetation. his could be attributed to the efects of high rainfall which aids the quick regeneration of the vegetation, and reduced impacts of ire. But as we move northwards rainfall reduces and the efect of the annual bush burning combined with over-cultivation and reduced fallow periods brings about the elimination of the forest species which are less tolerant of these conditions, leading to the establishment of savanna species. he study revealed that human activities’ within the forest savanna boundary is leading to the establishment of savanna species in forest regions.
References
Adejuwon, J.O. and Adesina, F.A., (1988), Vegetation patterns along the forest-Savanna boundary in Nigeria. Singapore Journal of Tropical Geography, 9(1), 18-31
Areola O. O., (1991), Ecology of Natural Resources in Nigeria. Avebury 270 pages.
Dezzeo N, Chacón N, Sanoja E and Picón G., (2004), Changes in soil properties and vegetation characteristics along a forest-savanna gradient in southern Venezuela. Forest Ecol. Manag., 200, 183-193.
Geograia (Londrinda), 23(1), 127-150
Emuh, C. N and Gbadegesin, A.S. (2009) Species Diversity Patterns along the Forest Savanna Boundary in Nigeria. Management of Environmental Quality: An International Journal, 20(1), 64 – 73. Geiger, E. L., Gotsch S. G., Damasco G., Haridasan
M., Franco A. C. and Hofmann W. A., (2011), Distinct roles of Savanna and Forest Tree Species in Regeneration under Fire Suppression in a Brazilian Savanna. Journal of Vegetation Science, 22, 312–321 Guillet, B., Achoundong, G., Youta H, J., Kamgang K.,
Beyala, V., Bonvallot, J., Riera, B., Mariotti, A., Schwartz, D., (2001), Agreement between losistic and soil organic carbon isotope (13C/12C, 14C) inidcators of forest invasion of savannas during the last century in Cameroon. J. Trop. Ecol. 17, 809–832.
Ibanez T., Munzinger J., Gaucherel C., Curt T. and Hély C., (2013), Inferring savannah–rainforest boundary dynamics from vegetation structure and composition: a case study in New Caledonia. Australian Journal of Botany, 61(2) 128-138
Iloeje, N.P., (1982), A New Geography of West Africa. New revised edition. Longman.
Morgan, W. B. and Moss, R. P.; 1965; Savanna and Forest in Western Nigeria. Africa: Journal of the International African Institute, 35(3), 286-294 Vincens, A., Schwartz, D., Elenga, H.,
Reynaud-Farrera, I., Alexandre, A., Bertaux, J., Mariotti, A., Martin, L., Meunier, J.D., Nguetsop, F., Servant, M., Servant-Vildary, S., and Wirrmann, D., (1999) Forest response to climate changes in Atlantic Equatorial Africa during the last 4000 years BP and inheritance on the modern landscapes. J. Biogeogr., 26, 879–885.
Westhof, V., and Maarel, E. van der. (1978), he Braun-Blanquet approach. 2nd ed. In: R. H. Whittaker (ed). Classiication of Plant Communities, 287-399. Junk, he Hague.
Appendix 1:
Correlation Between Species in Landuse Types Within Study Sites
Mature Intermediate Young
Site 1 (Adesina)
Mature 1 0.395** 0.326**
Intermediate 0.395** 1 0.326**
Young 0.322** 1
Site 2 (Ogunwehinde)
Mature 1 0.256** 0.296**
Intermediate 0.395** 1 0.411**
Young 0.296** 0.411** 1
Site 3 (Adesiyan)
Mature 1 0.256** 0.253**
Intermediate 0.256** 1 0.389**
Young 0.253** 0.389** 1
Site 4 (Alaro)
Mature 1 0.376** 0.018
Intermediate 0.376** 1 0.510**
Young 0.018 0.510** 1
Site 5 (Ijaye)
Mature 1 0.376** 0.018
Intermediate 0.376** 1 0.510**
Young 0.018 0.510** 1
Site 6 (Layele)
Mature 1 0.432** 0.168
Intermediate 0.432** 1 0.486**
Young 0.168 0.486** 1
Site 7(Ayetoro)
Mature 1 -0.108 -0.120
Intermediate -0.108 1 0.389**
Young -0.120 0.389** 1
Site 8 (Fiditi)
Mature 1 0.341** 0.010
Intermediate 0.341** 1 0.404**
Young 0.010 0.4404** 1
Site 9 (Apenpe)
Mature 1 0.331** 0.120
Intermediate 0.331** 1 0.265**
Young 0.120 0.265** 1
Site 10 (Oluwatedo)
Mature Intermediate Young Site 11 (Fashola)
Mature 1 0.546** 0.275**
Intermediate 0.371** 1 0.467**
Young 0.297** 0.467** 1
Site 12 (Oyatutu)
Mature 1 0.371** 0.297**
Intermediate 0.459** 1 0.653**
Young 0.282** 0.653** 1
Site 13 (Iseyin)
Mature 1 0.459** 0.282**
Intermediate 0.459** 1 0.389**
Young 0.282** 0.389** 1
Site 14 (Iporin)
Mature 1 0.705** 0.427**
Intermediate 0.705** 1 0.562**
Young 0.427** 0.562** 1
Site 15 (Idaogun)
Mature 1 0.328** 0.396**
Intermediate 0.328** 1 0.580**
Young 0.396** 0.580** 1