AGRITECH, Vol. 33, No. 3, Agustus 2013
320
ISOLATION OF ANTHOCYANIDIN FROM WORA-WARI FLOWERS (Hibiscus
rosa
sinensis
L.) AND ITS APPLICATION AS INDICATORS OF ACID-BASE
Siti Nuryanti, Indarini Dwi Pursitasari, Ratman
Faculty of Teacher Training and Education, University of Tadulako, Jl. Soekarno-Hatta, Palu Email: [email protected]
ABSTRACT
Wora-wari plants are easily cultivated and founded in Indonesia, also their bloomy is not seasonal. Isolation of anthocyanidin from Wora-wari was done by maceration using n-hexane, ethyl acetate and methanol-HCl 1.0% and isolation of anthocyanidin was performed by column chromatography. Identification for structure of anthocyanidin was done by UV-Vis spectrophotometer, FT-IR, 1H- and 13C-NMR along with color reagent. In the Wora-wari flowers, it has
been identified the existence of anthocyanidin pelargonidin. The color change of anthocyanidin pelargonidin results in acid solution was red and base solution was green.
Keywords:Wora-wari flower, anthocyanidin, acid-base indicator
INTRODUCTION
Acid-base indicators are needed for the chemical laboratory activities. Unfortunately, the price of synthetic indicators is relatively expensive and in some regions outside Java is difficult to obtain. Therefore, a substitute synthetic indicator is needed to overcome these problems. Weak organic acids or bases can be generally used as acid-base indicators. Organic compounds that can be used as indicator have characteristics that compounds provide the color changes along the pH changes (Day and Underwood, 2002).
Anthocyanidin is an organic compound and very unique, in acid solution is red, neutral colorless and blue under alkaline conditions (Torskangerspoll and Andersen, 2005). Anthocyanidin is currently used in the pharmaceutical and natural dyes food or beverages. In the health area, anthocyanidin is used as anticancer, antioxidant and prevented premature aging. According to Puckhaber (2002), Hibiscus flowers contain anthocyanidin pigments. Wora-wari flowers are included in the genus Hibiscus, so it is possible to contain the same pigment.
Wora-wari flowers usually become useless waste. Hence, the utilization of flowers can enhance the economic value. In spite of the benefits and the properties of anthocyanidins are very interesting, and then isolation of anthocyanidins from Wora-wari flowers and its application as acid-base indicator is very urgent to do.
RESEARCH METHODS
Materials
Materials used in this study were: n-hexane, methanol, ethanol, ethyl acetate, TLC plates,silica gel 60, 70-230 mesh, HCl 0.5, 1 and 1.5% (v/v methanol), sodium hydroxide, ammonia, ethanol, n-buthanol, Whatman filter paper no.1, buffer solution (pH 1 to 14), methyl orange indicator (mo), phenolphthalein indicator (pp), pH universal, and CH3COOH, Wora-wari flowers from Petobo, Sigi Biromaru, Palu, Sulawesi Tengah Indonesia.
Equipments
The instruments used in this study were: shaker for extraction (IKA ® KS 130 basic), Buchii evaporator (R-124), electric bath, dryers, Buchner funnel, micro pipettes (SOLOREK Switzerland), micro burette (Scientific JENCONS USA), vessel developers and other glassware for completeness titration, analytical balance (Metler AT 200), FT-IR (Shimadzu Prestige -21), TLC scanner (Camac 3), UV-Vis (array Miltonroy 3000) , 500 MHz 1H-NMR and 13C-NMR 125 MHz (JEOL JNM ECA 500), pH meter (Hanna HI 8314),column chromatography (length 60 cm, diameter 2 cm).
Research Procedures
AGRITECH, Vol. 33, No. 3, Agustus 2013
321 using shaker for 20 hours. The mixture was filtered using
Whatman filter paper number 1. Residues contain no solvents were re-extracted using ethyl acetate 2.5 L for 20 hours. Then ethyl acetate extracts were separated by filtration using the same paper. The residues were re-extracted with 2.5 L of methanol-HCl 1% (v/v) for 20 hours. Methanol-HCl extracts were filtered with Whatman filter paper number 1. The filtrate was then concentrated using a rotary vacuum evaporator at 60-65oC and then analyzed by UV-Vis spectrophotometer at
λ 200-700 nm with methanol-HCl 0.01% as solvent and the color test conducted with NH3 vapor.
Isolation of anthocyanidin from the wora-wari flowers. Wora-wari extract was spotted on a plastic plate of silica gel 60 F254 TLC. The combination of developer used was n-butanol and HCl 1% (v/v) with a variety of comparisons. Observations with UV light were done at λ 254 and 366 nm. Then the qualitative color test of anthocyanidin was performed using NH3 vapor. From the TLC data, solvents that can separate the anthocyanidins from Wora-wari extract were mixture of n-butanol-HCl 1% (BHCl) with a ratio of 4:1.
Identification of structure by UV-Vis spectrophotometer, FT-IR and 1H and 13C-NMR. UV-Vis spectra can be obtained by steps of work as follows: measured 50 µL solution anthocyanidin from Wora-wari flowers with a micro pipette. Methanol-HCl 0.01% was added to get volume became 500 µL, and then measured with a spectrophotometer UV-Vis at λ 200-700 nm. Structure of the compound was analyzed with FT-IR spectrometer, 1H and 13C-NMR, as carried out by Adje et al. (2008).
Application as indicator acid-base. Weighed as much as 1 mg pelargonidin, put in a brown bottle, then added with 10 mL of methanol. Next, measured 0.1 M acetic acid and 0.1 M NaOH each 5 ml and put in a different test tube, then added 3 drops a solution of pelargonidin into each tube. Finally, the color changes were observed.
RESULTS AND DISCUSSION
Identification of Anthocyanidin in Wora-wari Flower
The results of extraction with methanol-HCl 1%, obtained extract was red. Furthermore, to determine the presence of anthocyanidin in each Wora-wari, analysis was conducted using color reagent NH3 vapor and UV-Vis spectrophotometer. Flower extract was reacted with NH3 vapor to form blue color; this indicates the presence of anthocyanidin. The blue color produced in this study suggested the formation of complex compounds between the
vapors NH3 with anthocyanidins forming quinoid bases, in consequence of the loosed H from the acidic OH group on the cation flavilium in the anthocyanidin molecule (Figure 1).
Figure 1. Anthocyanidin reaction with NH3 vapor
Color changes occurred after reaction with NH3 vapor, indicating that in the extract Wora-wari contains anthocyanidin which is likely to have a bound hydroxy group at position C-5, C-7 in ring A and C-4’ on ring B (Jackman et al., 1987).
Analysis using UV-Vis spectrophotometer gave spectrum which presented λmax at 515 nm. According to Andersen and Markham (2006), anthocyanidins have characteristic absorption on λmax region 465-560 nm. Based on analysis by UV-Vis, this λmax was still within reached of
λmax anthocyanidins, thus reinforcing the notion that in
Wora-wari flower extract contains anthocyanidins.
Isolation of Anthocyanidin from Wora-Wari Flowers
Isolation using TLC was done to find out eluent that gave separation, which presented different spots with different Rf and the distances are relatively far (not piles). The results gave eluent n-butanol: 1% hydrochloric acid (BHCl) with a ratio (4:1), which resulted in two spots, the first spot with Rf 0.63 and the second at Rf 0.37. The first spot after being separated was obtained red powder and then a color test with NH3 vapor showed positive anthocyanidin.
Identification of Anthocyanidin Structure by FT-IR, 1H
and 13C-NMR
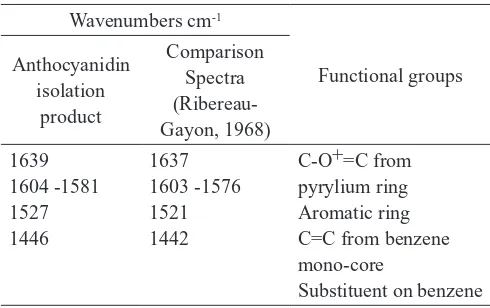
FT-IR spectrum from the isolation of extract of Wora-wari flower could be interpreted that the absorption band at 1639 cm-1 shows the vibrational stretching of C-O=C bonds
on pyrylium ring (ring C) conjugated with C-C double bond. Absorption in those area according to Qin et al. (2010) and Riubereau-Gayon (1968) derived from the absorption of O-heterocyclic (ring C) which conjugated with benzene. Absorption in the 1639 cm-1 probably overlap with absorption
bands from C=C bond. While the absorption band at 1581 cm-1 probably from the C=C bond of benzene mono-core.
Absorption band at 1446 cm-1 indicated that the benzene
cores contain substituent. When compared with the infrared Motor penggerak
Bajak lorong Boks tanah
Soil bin Bridge box
Strain amplifier ADC
AGRITECH, Vol. 33, No. 3, Agustus 2013
322
spectra of anthocyanidins by Ribereau-Gayon (1968) as seen in Table 1, it was acquired that the anthocyanidins was not the kind of peonidin, petunidin or malvidin. This was supported by no absorption at 1460 cm-1 which is typical for methyl
group absorptions anthocyanidins. Therefore, from FT-IR data suggested that product may contain pelargonidin type of anthocyanidin.
Table 1. The interpretation comparison of anthocyanidin FT-IR classified into protons rings A, B and C, hydroxy and sugar groups. 1H-NMR spectrum showed the existences of five peaks
that described the five protons were not equivalent. Signal (δ 8.62 ppm, singlet, 1 H) derived from C-4 protons on the C ring. Signal (δ 8.61 to 8.59 ppm, duplet, J = 9 Hz, 2 H) and (δ 7.06 to 7.05 ppm, duplet, J = 9 Hz 1 H) represented protons at C-2’; C-6’; C-3’ and C-5’ in B ring. Duplet appearance with coupling constant J of 9 Hz indicated that two types of protons have ortho-coupling with each other. Proton-proton on the A ring indicated by the signal (δ 6.91 to 6.90 ppm, duplet, J = 1.8 Hz, 1 H) and (δ 6.63 to 6.63 ppm, duplet, J = 1, 8 Hz, 1 H). Based on the value of the coupling constant J = 1.8 Hz, it can be said that the two protons are located at the meta position to one another. According to Hillis and Horn (1965) and Marby et al. (1970), protons of aromatic ring A (H-6 and H-8) gave signal at δ = 6.80 and 7.10 ppm, while the aromatic B ring protons appears at δ = 7.50 to 7.70 ppm, when compared to the results of the research data there were similarities.
Anthocyanidins were flavonoids group that have C6-C3-C6 as basic framework. The determination of the suspected compound structure (predictable) isolated product of Wora-wari flower was a type of anthocyanidin pelargonidin. Then, in this study performed the analysis using 13C-NMR
spectrometer. The interpretation results of the analysis by 1
H-and 13C-NMR are summarized in Table 2.
Table 2. Interpretation of 1H and 13C-NMR anthocyanidin
iso lation product from Wora-wari flowers
Anthocyanidin isolation from Wora-wari. There was absorption at 163.76 ppm which describes the C atom number 2 binding double bond with O atom. Carbon (C9) that bounded to the same O atom was indicated by the signal at 151.12 ppm. The signal at 217.88; 197.57; 162.39 and 151.12 ppm derived from the benzene ring which bonded to the hydroxy group of C7, C4, C5 and C3. That position was more downfield peak due to the position of the carbon atoms located next to the electronegative oxygen atoms. The absorption of B ring carbon atoms at position 3’and 5’ appeared at 117.8 ppm, the position of C2’and C6’ appears at 135.04 ppm, while C1’ atom appears at 106.32 ppm. Furthermore, the absorption at 103.26 ppm describing atom C10, C6 and C8 positions of the atoms in the ring A indicated by the signal at 94.99 and 68.73 ppm, respectively. The signal at 111.09 ppm represents the absorption of carbon atoms in position 4.
AGRITECH, Vol. 33, No. 3, Agustus 2013
323 with NH3 vapor, it was proved that in the extract Wora-wari
flower contains anthocyanidin pelargonidin type.
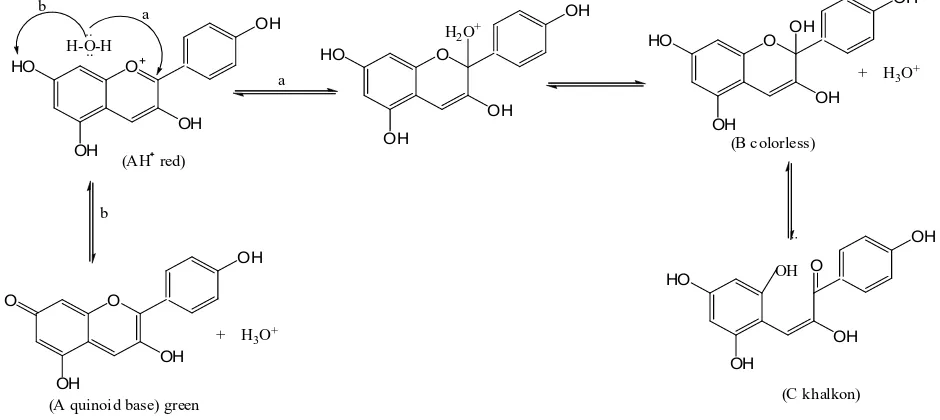
This anthocyanidin also gave color changes when in the acid solution became red. On the other hand, it became green when in base solution. The fact was anthocyanidin
O
OH
OH HO O+
OH
OH HO
H-O-H a b
(AH red)
a
H2O+ O
OH
OH HO
OH
+ H3O+
(B colorless)
OH
OH HO
O
OH
(C khalkon) b
O
OH
OH O
+ H3O+
(A quinoid base) green
OH OH
OH
OH OH
had flavilium cation which was unstable in the change of pH solution; therefore the color change occurs due to the delocalization of phenolic ion to give quinoid. Thus, gave color change from red in acidic condition to green in basic condition as on Figure 2.
Figure 2. Equilibrium of Pelargonidin into quinoid (A), pseudobase carbinol (B) and chalcone (C)
CONCLUSIONS
Wora-wari (Hibiscus rosa sinensis L.) is contain anthocyanidins pelargonidin type. The anthocyanidins can be used as an acid-base indicator, in the acidic solution was red and in alkaline solution was green.
REFERENCES
Adje, F., Lozano, Y.F., Meudec, E., Lozano, P., Adima, A., Agbon’zi, G. and Gaydou, E.M. (2008). Anthocyanidin characterization of pilot plant water extracts of Delanix regia flowers. Molecules13: 1238-1245.
Andersen, Ø.M. and Markham, K.R. (2006). Flavanoids Chemistry, Biochemistry and Applications. CRC Taylor and Francis, New York.
Andersen, Ø.M., Fecent, T., Torskangerpoll, K., Forcen, A. and Hauge, U. (2004). Anthocyanidin from strawberry (Frangaria ananassa) with the Novel Aglycone, 5- carboxypyranopelargonidin. Phytochemistry65: 405-410. Day, R.A. and Underwood, (2002). Quantitative Analysis:
Analisis Kimia Kuantitatif, Terbitan ke-6. (translated by Soendoro, Widaningsih and Rahardjeng). Erlangga, Surabaya.
Hillis, W.E. and Horn, D.H.S., (1965). Nuclear magnetic resonance spectra and structures of same C-glycosyl-flavonoids. Australian Journal of Chemistry 18: 531-542 Jackman, R. L., Yada, R. Y., Tung, M. A. and Speers, R. A.
(1987) Anthocyanidins as Food Colorants-a Review.
Journal of Food Biochemistry 11: 201-247.
Mabry, T.J., Markham, K.R. and Thomas, M.B. (1970). The Systematic Identification of Flavonoid. Springer Verlag,
New York.
Puckhaber, L.S., Stipanovic, R.D. and Bost, G. A. (2002). Analyses for flavonoid aglycones in fresh and preserved
Hibiscus flowers. In: Janick J. and Whipkey, A., Trends
in New Crops and New Uses, page 556-563. ASHS Press Alexandria VA.
Qin C., Ly, Y., Niu, W., Ding, Y., Zhang, R. and Shang, X., (2010). Analysis and characterisation of anthocyanidins in mulberry fruit. Journal of Food Science28(2): 117-128. Ribereau-Gayon P. (1968). Les Composess Phenoliquesdes
Vegetaux Les Anthocyanidin. Dunod, Paris.